Technical analysis by BINDIsCOINs about Symbol ZEC: Sell recommendation (6 hour ago)

پیشبینی سقوط قیمت: آیا سهام به ۳۷۵ دلار میرسد؟ (تحلیل الگوی M متوالی)
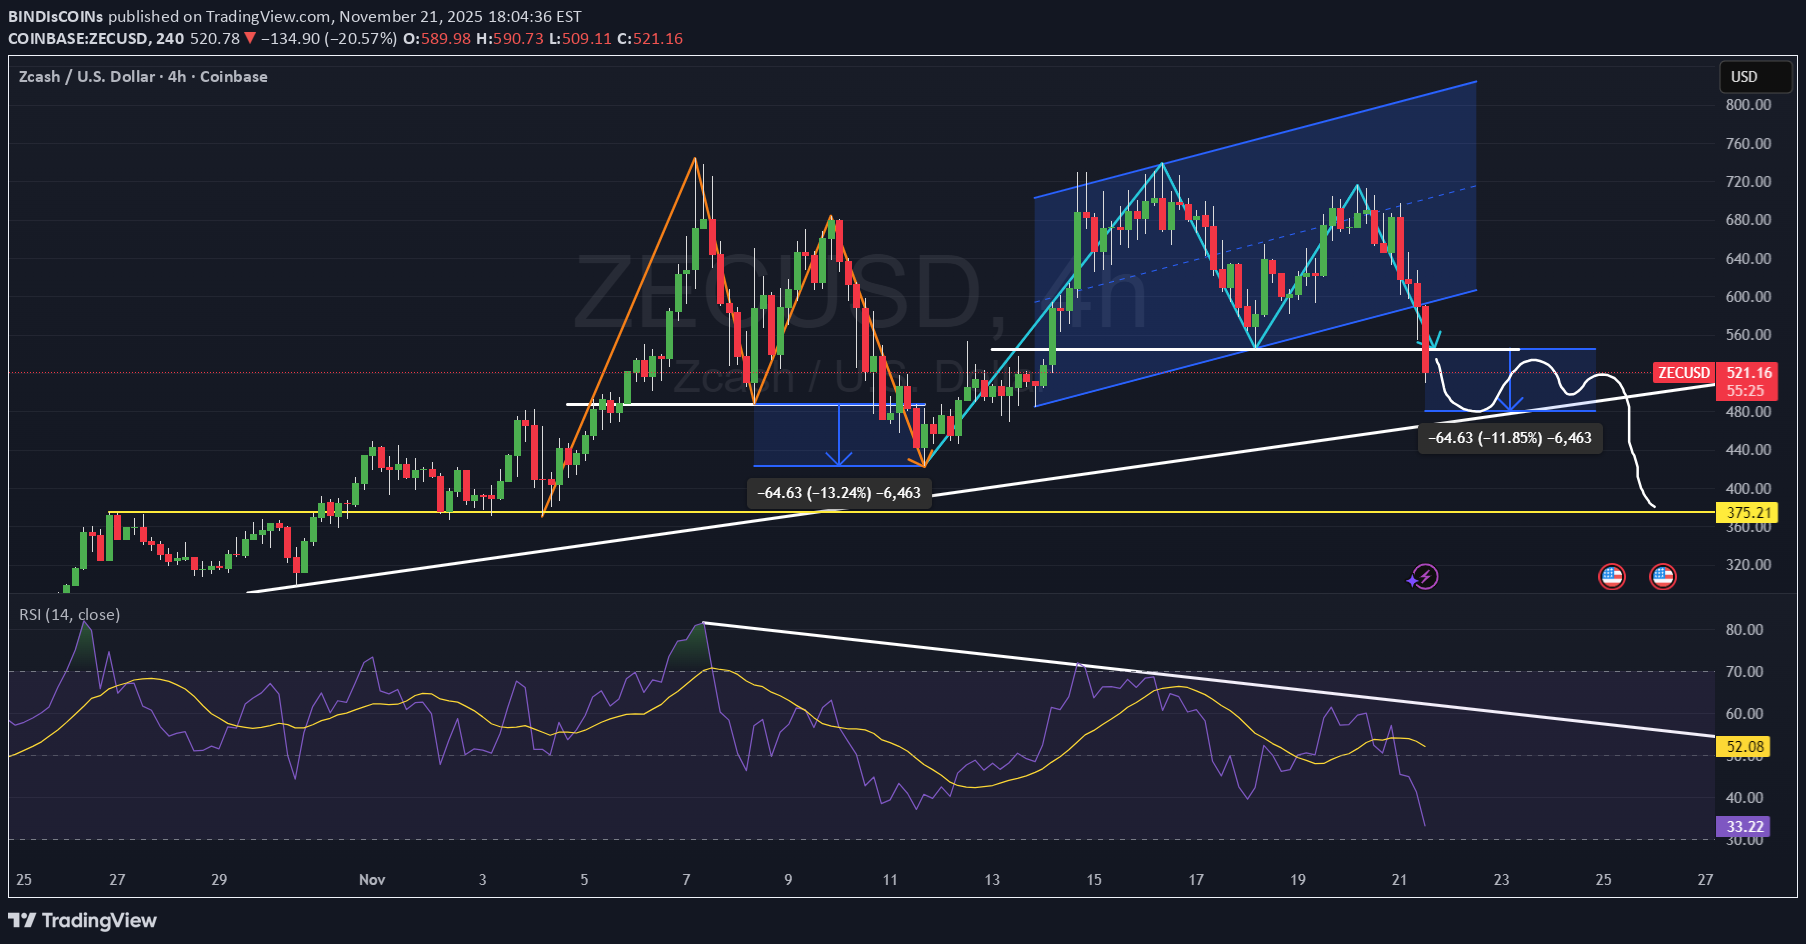
This 4H Chart shows a potential downward move to $375. Price has just broken the neckline of the second consecutive M pattern (Mtop), thus making this next downward move more extreme than the first. Please see the first M pattern in orange with a clear white neckline that was broken with a measured move down from the breakpoint to the next pivot low where price reversed, trended upwards to start forming the move up for the second M pattern to form. The second M pattern in light blue has now formed and broken below its neckline in white, with a duplicated measured move down added from first M pattern neckline. Notice how the second measured move down coexists with a strong upsloping trend line. There is also an upsloping parallel channel that has been broken. Also, negative divergence on RSI. Lastly, notice my projected path down in white.