
XVG
Verge
| تریدر | نوع سیگنال | حد سود/ضرر | زمان انتشار | مشاهده پیام |
|---|---|---|---|---|
 Javlonbek4000Rank: 1439 | خرید | حد سود: تعیین نشده حد ضرر: تعیین نشده | 8 hour ago | |
 delovoikot834Rank: 461 | خرید | حد سود: تعیین نشده حد ضرر: تعیین نشده | 11/4/2025 | |
 julia17Rank: 763 | خرید | حد سود: تعیین نشده حد ضرر: تعیین نشده | 11/20/2025 |
Price Chart of Verge
سود 3 Months :
سیگنالهای Verge
Filter
Sort messages by
Trader Type
Time Frame
Javlonbek4000
پیشبینی انفجار قیمت XVGUSDT: استراتژی نوسانگیری با اهداف صعودی بزرگ
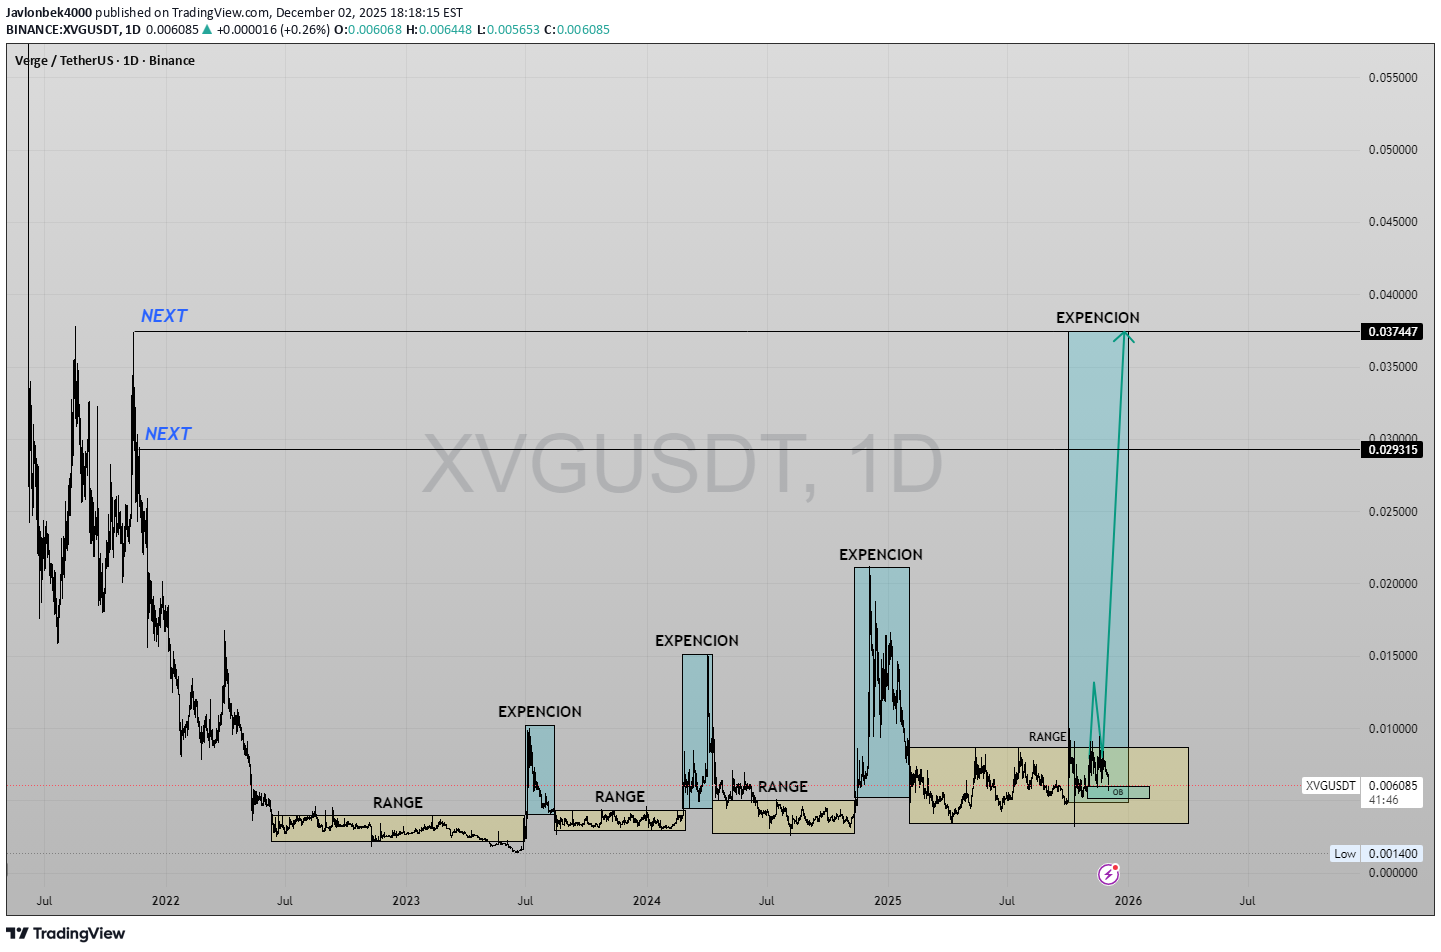
XVGUSDT – 1D | Range → Expansion Cycle, Swing Plan with Targets XVG has been respecting a very clear “range → expansion” behaviour on the daily chart. Each time price spends a long period inside a horizontal range, it is followed by a sharp vertical expansion leg. The previous cycles are marked on the chart, and the current structure is again trading inside a similar range. As long as price holds above the current range low, my bias is for one more expansion from this base. Swing idea from the current range Entry zone: around 0.0061 – inside the range and above the local demand/OB. Invalidation (SL): below 0.0047 – a clean daily break under this level means the range support has failed and the idea is invalid. Risk from entry ≈ -22%. First target (TP1): 0.0087 – retest of the range high / first liquidity pocket. Reward from entry ≈ +40%, giving roughly 1 : 1.8 R:R. If the market repeats previous “range → expansion” cycles and macro conditions stay supportive, I am looking at the following higher-timeframe expansion targets: TP2 – “NEXT” level: 0.0293 – major HTF supply zone from the last impulsive sell-off and a logical area to secure large profits if an expansion starts. TP3 – final extension: 0.0374 – upper resistance and full measured-move objective for a complete range expansion. These levels are scenario targets, not guarantees. I will reassess the structure at each target and adjust risk accordingly. This is a personal trading plan, shared for educational purposes only and not financial advice.
julia17
تحلیل تکنیکال XVGUSD: سیگنال صعودی قوی با تارگت 0.0114!

XVG has completed a reversal pattern - bullish gartley with target 0.0114.

CryptoNuclear
سقوط یا انفجار بزرگ XVG: آیا مثلث دو ساله به نقطه جوش رسیده است؟
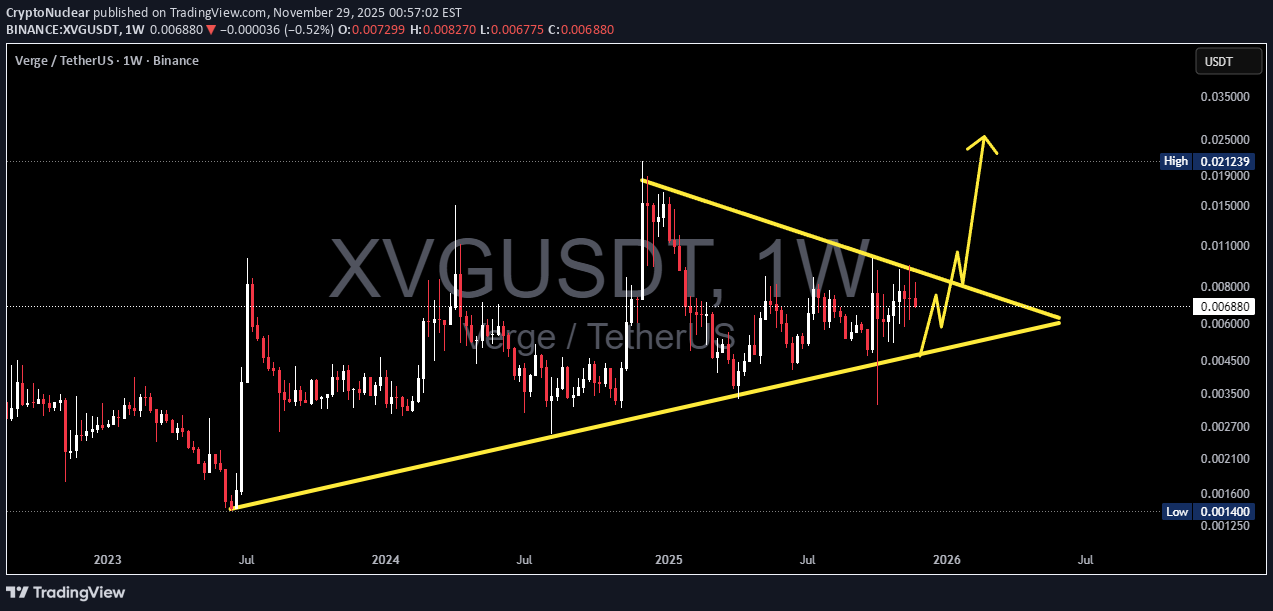
XVG is approaching one of its most critical technical moments in the last two years. Price has been compressing inside a large Symmetrical Triangle since mid-2023, defined by: 1. Higher Lows showing steady accumulation from smart money, and 2. Lower Highs showing persistent supply pressure. Both trendlines are now converging tightly into the Apex, creating a classic volatility squeeze — a condition where markets typically unleash a powerful breakout or breakdown once the compression phase is complete. For XVG specifically, this setup is rare and historically tends to result in explosive volatility. In short: The next move could define XVG’s direction for months ahead. --- Pattern Explanation The Symmetrical Triangle on the Weekly chart signals a buildup of energy. Shrinking volume + tightening candle range = compression before expansion. This type of pattern often ends with a sharp directional move, not a gradual drift. XVG rarely forms long-term triangles, making this squeeze even more significant. This is a classic “calm before the storm” structure. --- Bullish Scenario (If Breakout Occurs) A bullish continuation will be confirmed if XVG closes a weekly candle above the upper trendline. 1. Bullish Trigger Weekly close above 0.0075–0.0080 noticeable volume increase. 2. Follow-Through A retest of the broken trendline turning into support strengthens the breakout. 3. Bullish Targets Target 1: 0.011 – 0.015 → historical resistance Target 2: 0.020 → psychological supply zone Target 3 (Measured Move): 0.026 – 0.028 If fully realized, the upside potential ranges from +150% to +300%. --- Bearish Scenario (If Breakdown Happens) Weekly close below 0.0040–0.0045 triggers the bearish case. 1. Bearish Trigger Breakdown + selling volume spike. 2. Bearish Targets Target 1: 0.0030 → minor support Target 2: 0.0014 → historical bottom A breakdown would send XVG back into deep-discount territory, though so far the structure shows stronger bullish pressure via consistent higher lows. --- Overall Summary XVG is entering the final stage of a 2-year compression pattern. With almost no room left inside the triangle, the market is preparing for a decisive breakout or breakdown. Historically, when XVG reaches this kind of pattern maturity, the move that follows tends to be fast, aggressive, and highly directional. The next 1–2 weekly candles could shape the trend all the way into 2026. #XVGUSDT #XVG #Verge #CryptoBreakout #TrianglePattern #VolatilitySqueeze #PriceAction #WeeklyChart #AltcoinAnalysis #CryptoTechnicalAnalysis
julia17
julia17
پیشبینی حرکت XVGUSD: آیا این ارز به هدف ۰.۰۱۴ میرسد؟
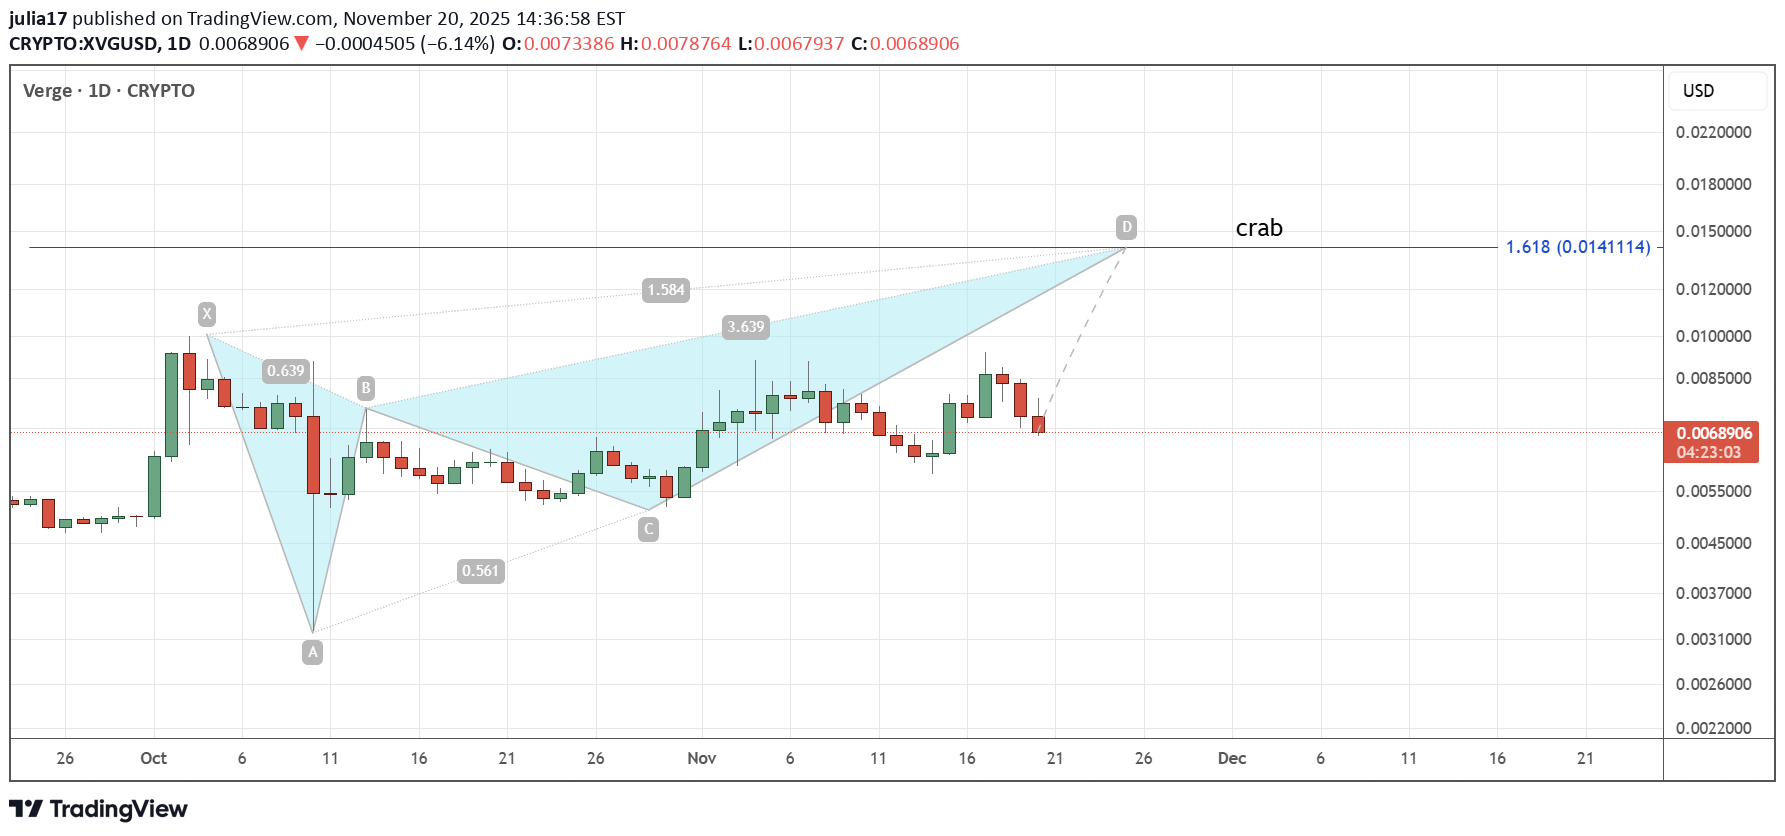
XVG is moving in a crab pattern with target 0.014.
julia17
پیشبینی جدید XVG/USD: آیا اصلاح تمام شد؟ هدف بعدی کجاست؟
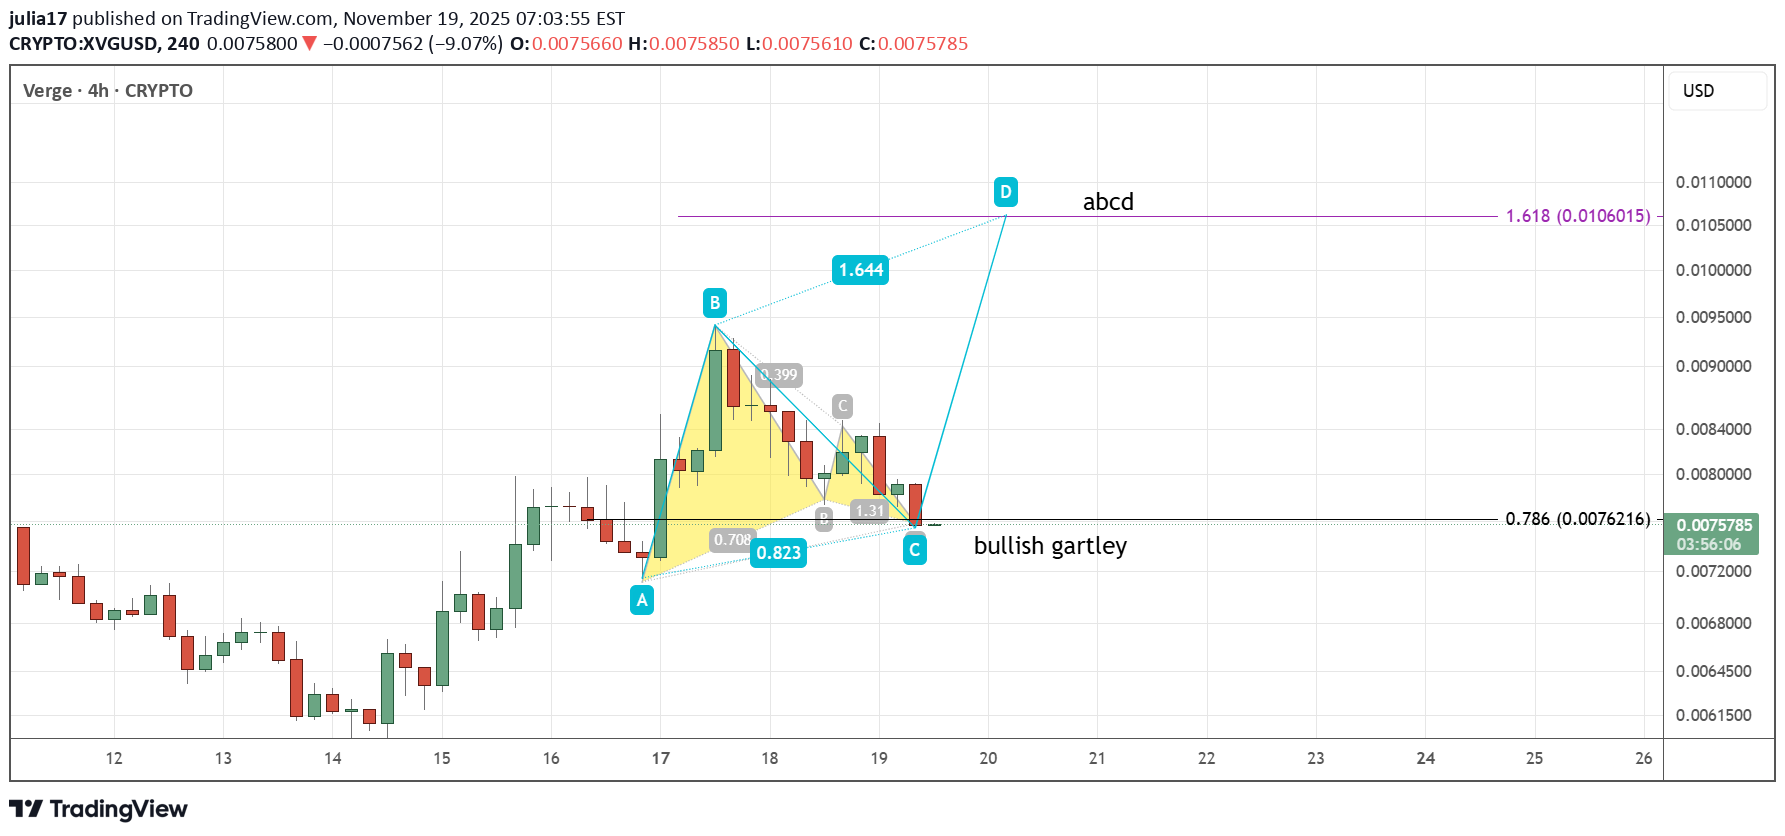
Looks like correction is over in the form of gartley, the next target - 0.0106 as abcd.

PraveenTrader1
تحلیل حرکت XVG/USDT: راز نقدینگی و بازی روندها (استراتژی قیمتگذاری SMC)

In this XVG/USDT setup, the market is showing a clear HTF bullish structure on the 15-minute timeframe, while the LTF (3-minute) is still in a corrective downtrend. This type of HTF–LTF mismatch usually indicates that the market is searching for liquidity before aligning back with the major trend. To understand the direction more accurately, I combined Price Action and SMC, especially focusing on order blocks, trend shifts, and liquidity sweeps. HTF (15m) Analysis Price is still respecting bullish structure. The last valid 15m demand/Order Block lies between 0.008095 – 0.007851. Market recently tapped into this range, indicating potential accumulation and a high chance of a continuation move to the upside. LTF (3m) Analysis 3m trend is currently in a controlled downtrend, forming clean impulsive and corrective legs. A refined 3m OB is identified between 0.007968 – 0.007851. This refined OB aligns perfectly with the deeper 15m OB, giving a high-probability confluence zone. If this zone holds, a bullish shift on LTF is expected. Trade Plan I entered based on the expectation that price will shift bullish after filling the 3m OB and aligning with the 15m HTF trend. Entry: 0.007967 Stop Loss: 0.007851 TP 1: 0.008084 (1:1 RR) TP 2: 0.008334 (1:3.16 RR)

TheCryptoFire
تحلیل تکنیکال XVG: آیا ارز ورج آماده شکستن مقاومت دوساله میشود؟

Verge XVGUSDT is now pressing into a big resistance zone that has stopped price for more than two years. The trendline under the price keeps rising, and that means buyers are getting stronger. Sellers in that zone look weaker. Volume is also picking up, which usually shows interest before a big rally. This setup is ascending triangle. If XVG closes a weekly candle above the full resistance block with strong volume, the next move can be fast because there is not much supply sitting above that level. For now, the chart is squeezing tighter and the demand zone keeps holding. These signs often show that a breakout is getting closer. If you follow a basic plan, it is easy. Wait for a clean close above resistance. No guesswork. No rushing in early. Get in when you have confirmation. TheCryptoFire

tradecitypro
تحلیل XVG/USDT: زمان خرید نقدی فرا رسیده است؟ (سیگنال ورود و سطوح کلیدی)

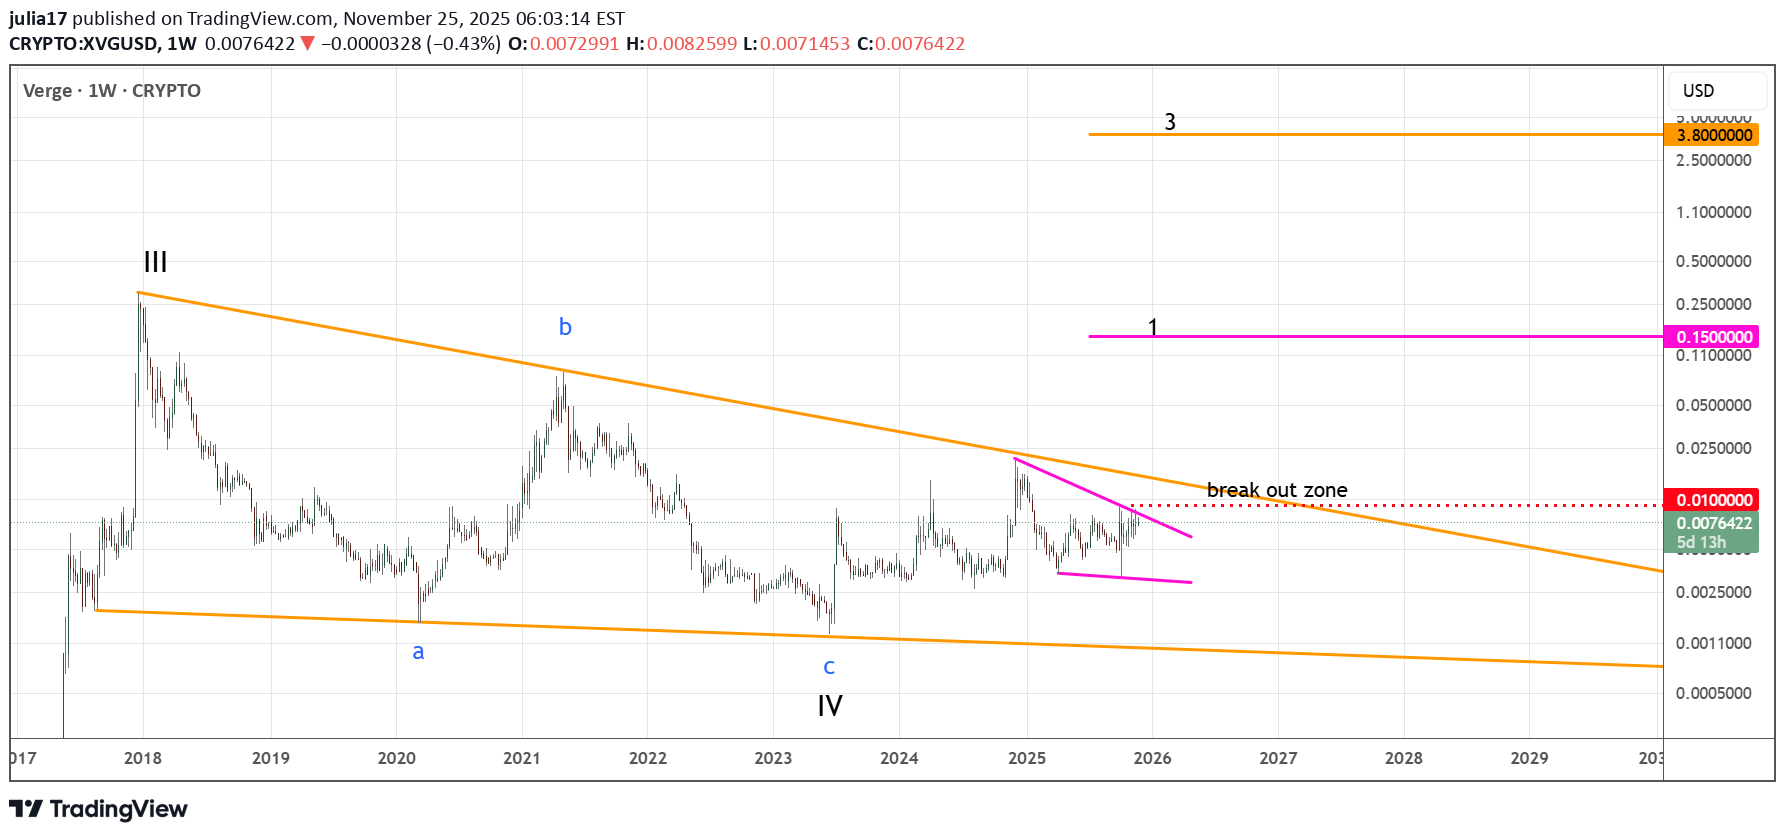
👋 Welcome to TradeCityPro! Let’s move on to the analysis of XVG, another privacy-focused coin similar to XMR, and take a closer look at its current market structure. 🌐 Overview of Bitcoin Before starting the analysis, let me remind you once again that we’ve moved the Bitcoin analysis section to a dedicated daily report at your request — allowing us to discuss Bitcoin’s trend, dominance, and overall market sentiment in greater detail each day. In the weekly timeframe, price was heavily rejected from 0.034978, falling all the way down to 0.001, marking a massive 90% correction. However, in the new calendar year, the market has consistently formed higher lows compared to the previous year, and price is currently oscillating around a solid weekly trendline. For a spot buy, our trigger is completely clear: After the breakout of 0.008828, we can enter the position and target 0.0152, following the bullish move. Our risky stop-loss is currently set at 0.004460, while the safer, more reliable stop-loss level is 0.003247. 📝 Final Thoughts Stay calm, trade wisely, and let's capture the market's best opportunities! This analysis reflects our opinions and is not financial advice.

asilturk
ورج (XVG) در مسیر صعودی قدرتمند: آیا این ارز دیجیتال به قلههای جدید میرسد؟

The XVG Verge coin, which we added to the portfolio on November 5 at a price band of 0.0080 cents, continues to be traded at a price band of 0.0091 cents as of now. We stated that we observed a real trend formation for XVG in the POW status, when compared to the alt coins in the other POW group during the past 12 days, according to the XVG/BTC technical analysis, the weekly trend was gaining strength and gaining certainty, and that the other alt coins in this group, ZEC-ZEN-DASH-DCR- and the other alt coins we shared, were left behind in terms of price performance, but this situation is a continuation of the trend with volume increases being recorded. I believe that it will bring new price targets together. As a result, the positive technical data predicts that the trend will continue for XVG and new price formations will continue in proportion to the volume. I find it useful to point out that more active days are coming for XVG. I wish you pleasant spending. Foot note: Please do not ask about the stocks and cryptos I shared today the next day. Investable levels in the medium and long term (covers the period of 3 months to 6 months). I only answer via Whatapss in the summer whenever possible.
Disclaimer
Any content and materials included in Sahmeto's website and official communication channels are a compilation of personal opinions and analyses and are not binding. They do not constitute any recommendation for buying, selling, entering or exiting the stock market and cryptocurrency market. Also, all news and analyses included in the website and channels are merely republished information from official and unofficial domestic and foreign sources, and it is obvious that users of the said content are responsible for following up and ensuring the authenticity and accuracy of the materials. Therefore, while disclaiming responsibility, it is declared that the responsibility for any decision-making, action, and potential profit and loss in the capital market and cryptocurrency market lies with the trader.