
TOSHI
Toshi
| تریدر | نوع سیگنال | حد سود/ضرر | زمان انتشار | مشاهده پیام |
|---|---|---|---|---|
 JCTRUTHERRank: 35345 | خرید | حد سود: تعیین نشده حد ضرر: تعیین نشده | 12/3/2025 | |
خرید | حد سود: تعیین نشده حد ضرر: تعیین نشده | 12/7/2025 |

Price Chart of Toshi
سود 3 Months :
سیگنالهای Toshi
Filter
Sort messages by
Trader Type
Time Frame
Neden olmasın ?
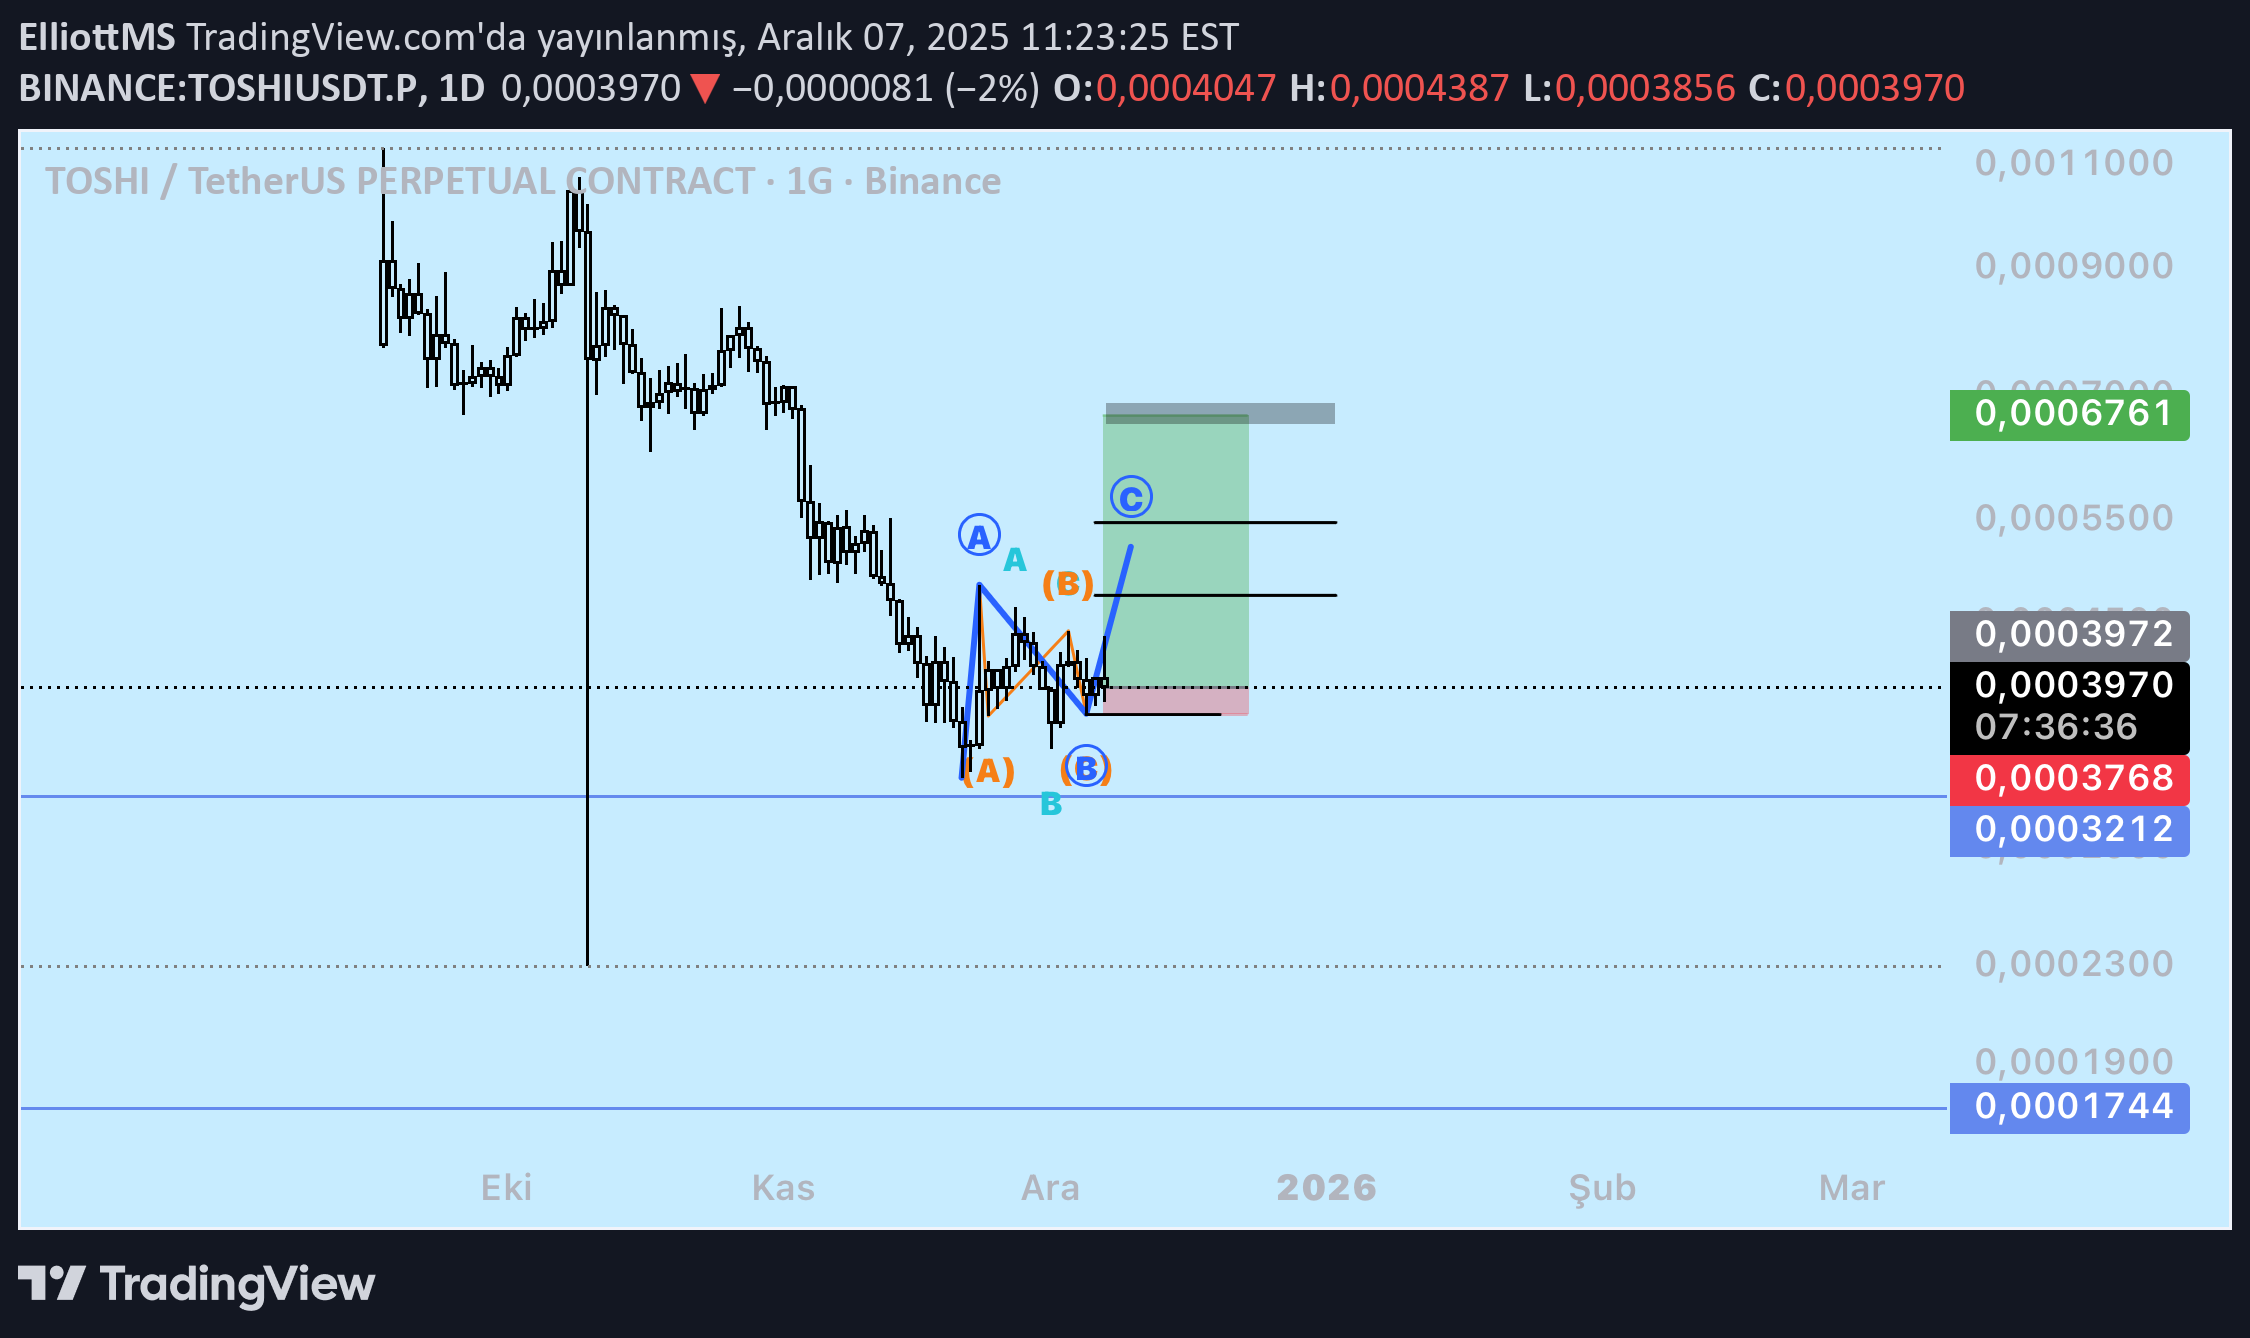
It has been stuck for a few days and the fact that it coincided with the weekend made it complicated. My expectation is that it can be tried with a small risk anyway. YTD.
JCTRUTHER
توشی (TOSHI): میم کوین گربهای بیس که قصد دارد سقف قیمت را فتح کند!
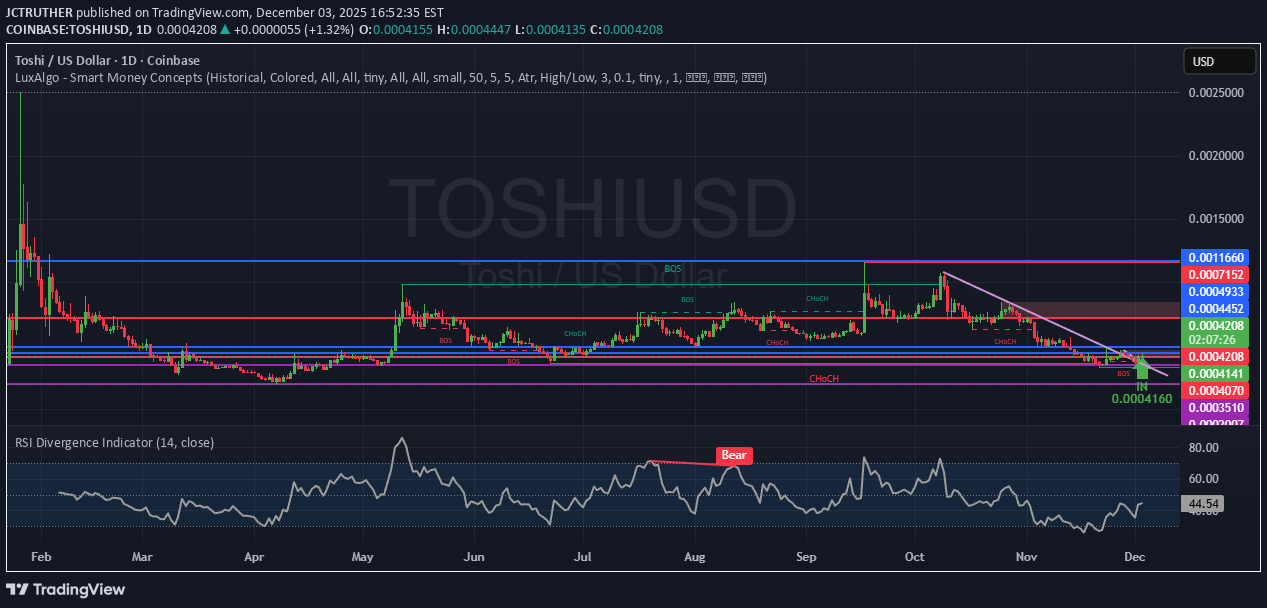
TOSHI is a cat-themed meme coin inspired by Coinbase co-founder Brian Armstrong's cat and Bitcoin's creator, Satoshi Nakamoto, serving as the mascot of the Base blockchain. TOSHI is entirely community-driven, with its circulating supply in the hands of its holders close to 1 million, and with a max supply of 420.69 billion tokens! TOSHI wants to get HIGH! So, let's help with that! :) Spot long! In around 0.0004160 TOSHI is a good token to trade!

CryptocurrencyBlot
توشی (TOSHI): آیا این میمکوین سراب است یا یک استراتژی پنهان؟

Is Toshi a fluke this year? So far, the price of the meme has not left the price of the origin starting price. 10 months and no change in price for long term holders, not great. Meme stability not a fluke? The price is not lower than the starting price and that is not always a bad thing because keeping money is better then losing money.

datforexkid
میم کوین پرطرفدار بیس: آیا این ارز دیجیتال برای انفجار آماده است؟

-Heavy accumulation on this based on chart pattern -Holding up well despite recent uncertainty in the crypto altcoin market -Second most popular meme coin on base -Still early for this one

MoonTradingForecast
TOSHI Technical Analysis | Key Levels & Market Outlook
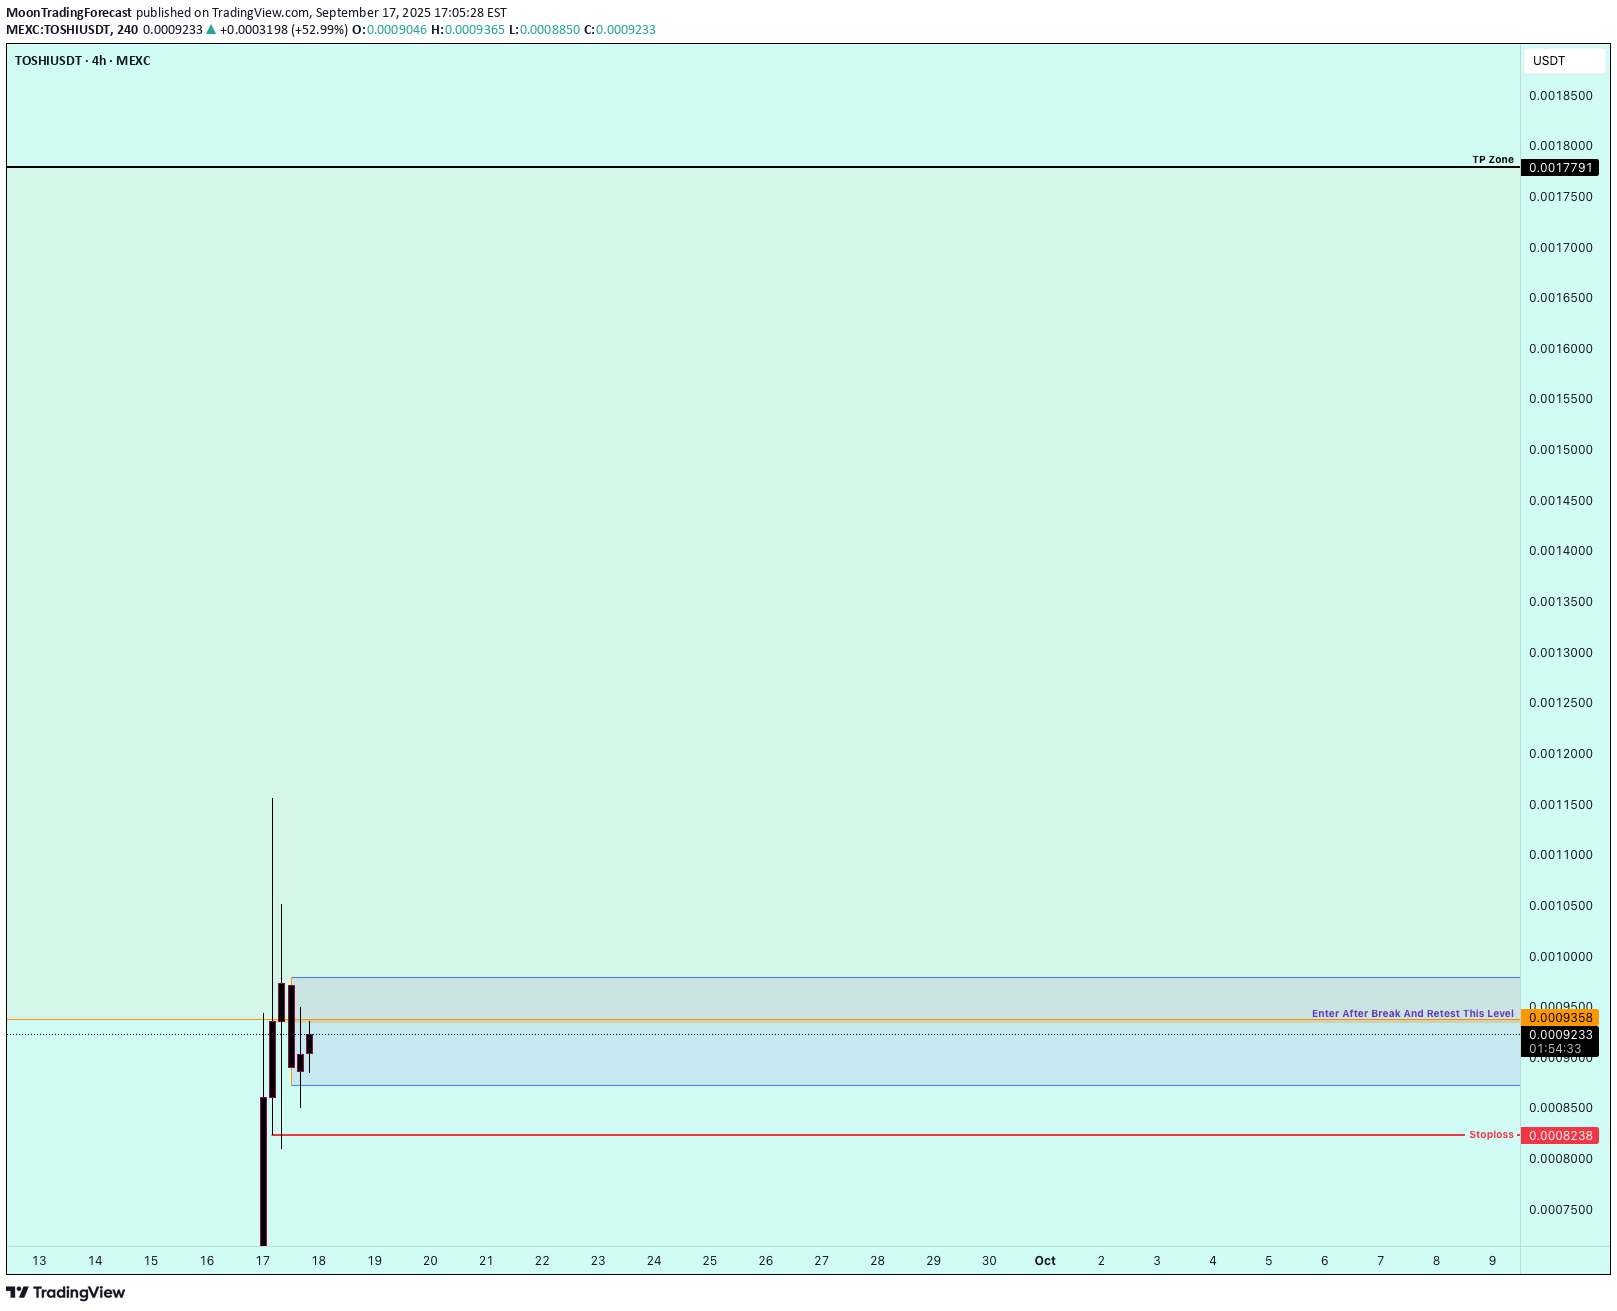
Description: Toshi ( $TOSHI ) is a community-driven cryptocurrency built on Ethereum, focusing on decentralization and long-term adoption. Despite being relatively new, it has gained attention through strong community support and rapid trading activity. In this analysis, I highlight critical support and resistance levels, trend structure, and potential breakout zones to watch. Market sentiment and volume dynamics remain essential in shaping short-term price direction. ⚠️ Disclaimer: This is not financial advice. The content is for educational and informational purposes only. Always do your own research before making investment decisions. #Toshi #Crypto #TechnicalAnalysis #Ethereum #Trading #PriceAction #CryptoCommunity #Altcoins #MarketOutlook

WaveRiders2
TOSHI Market Update
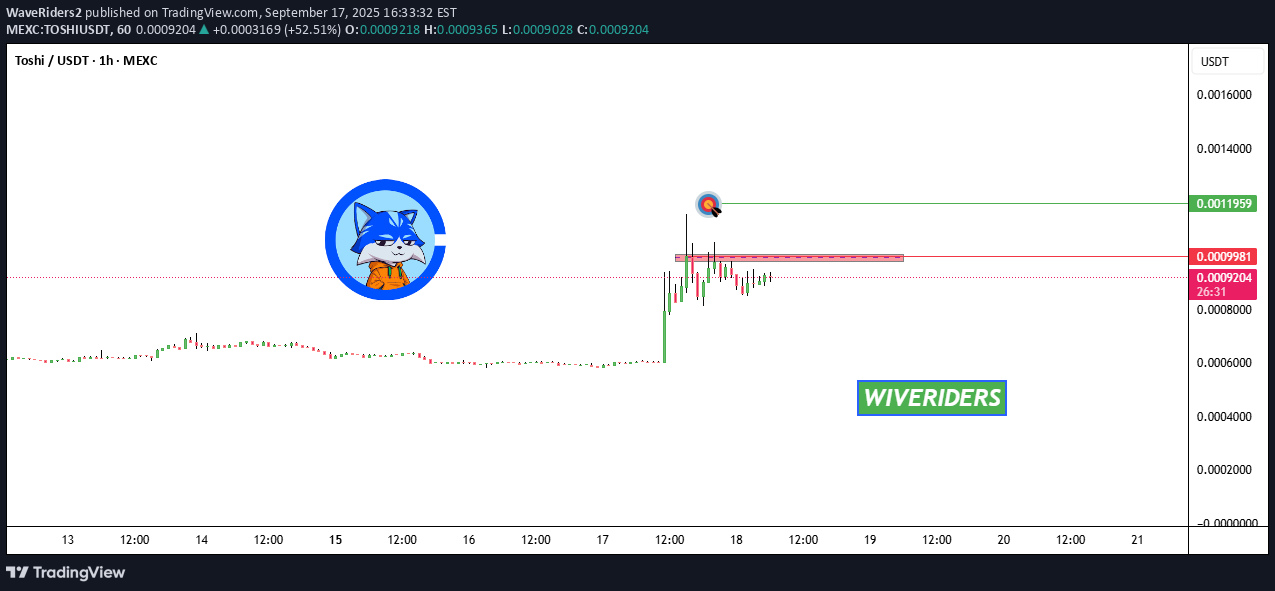
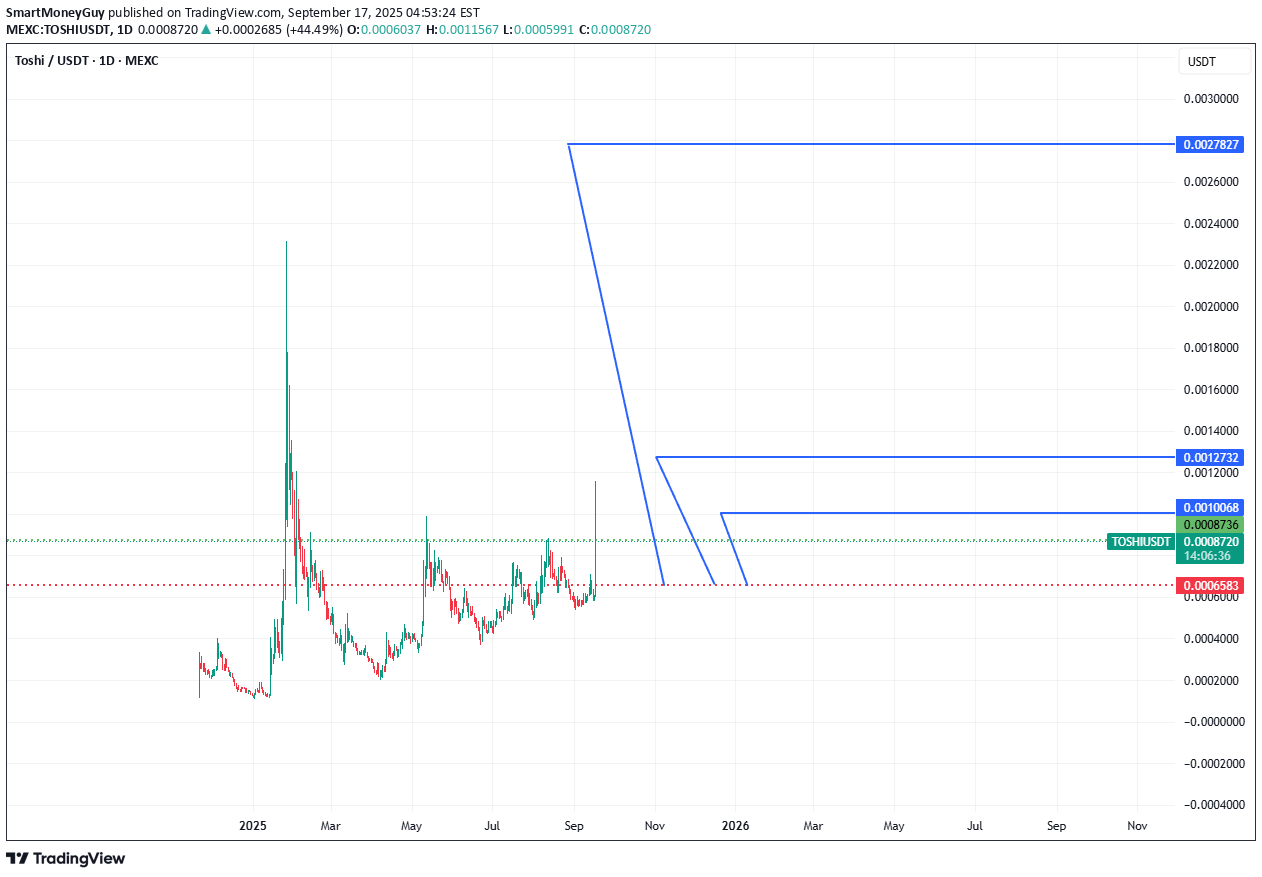
📊 $TOSHI Market Update $TOSHI is testing the red resistance zone 🔴 👉 If buyers step in with strength and confirm breakout, the first target will be the green line level 🎯

SmartMoneyGuy
Toshi 3X heading for 0.0027
WaveRiders2
TOSHI Breakout Watch – Testing Red Resistance Again!

🚨 $TOSHI Breakout Watch – Testing Red Resistance Again! 🔴⏳ $TOSHI is testing the red resistance zone again. 📊 If breakout confirms, realistic targets in this bull market are the green line levels. 💡 If you have $TOSHI , don’t sell now — at this moment, there’s no sell signal. Best move is to hold and wait for a breakout.

ZenTradesRW
CEX Listings
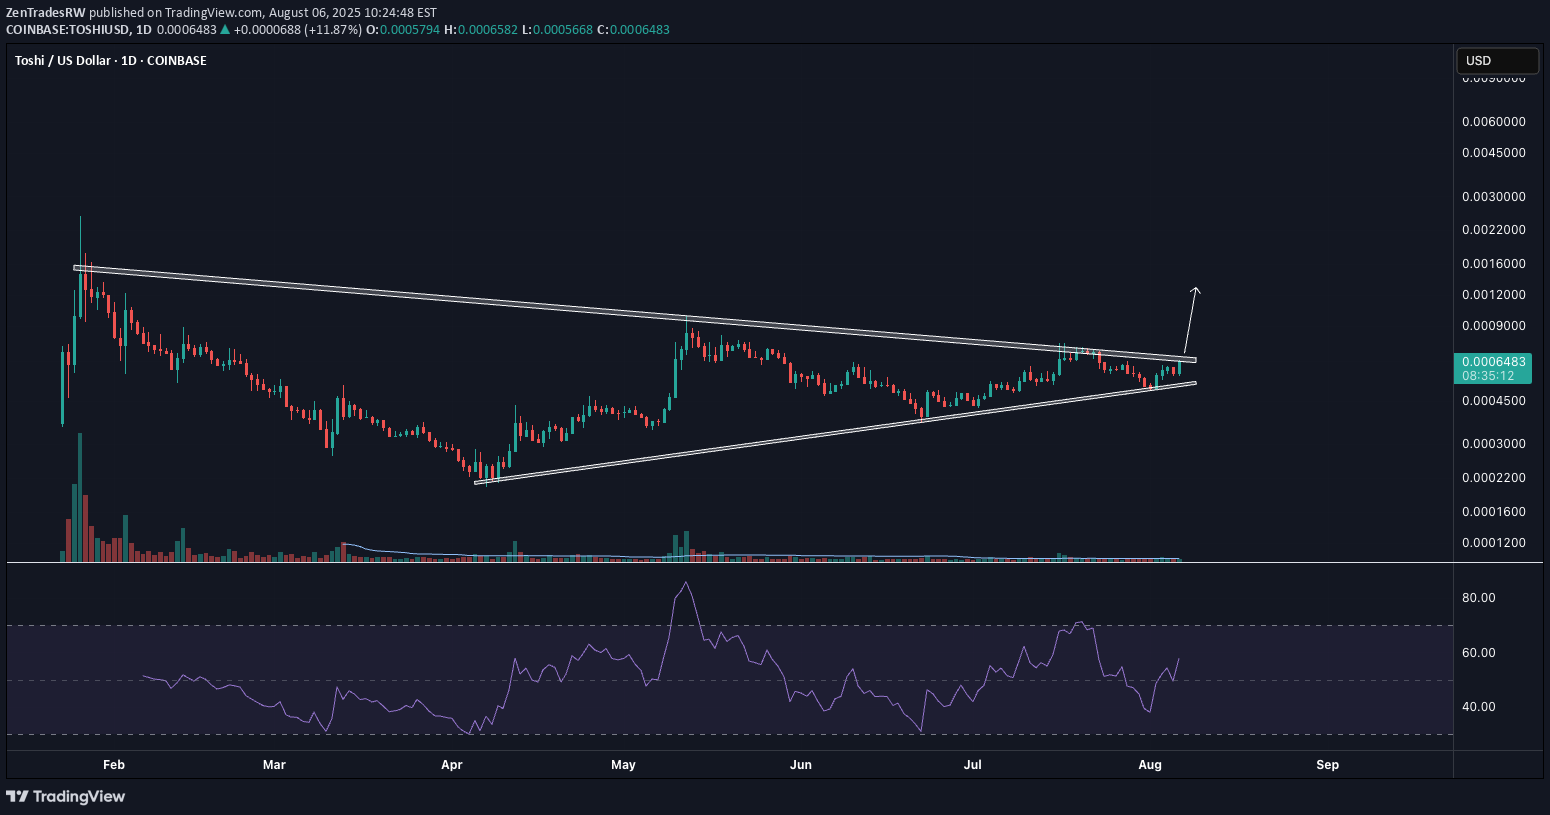
Huge base tightening up and looks like it's coming to an end. TOSHI getting listed on Binance tomorrow, which likely leads to a cascade of CEX listing (Upbit, OKX, Robinhood, etc.). The initial Jan 2025 price surge was due to its Coinbase listing. History often rhymes...
ZenTradesRW
2025 Altcoin Leader
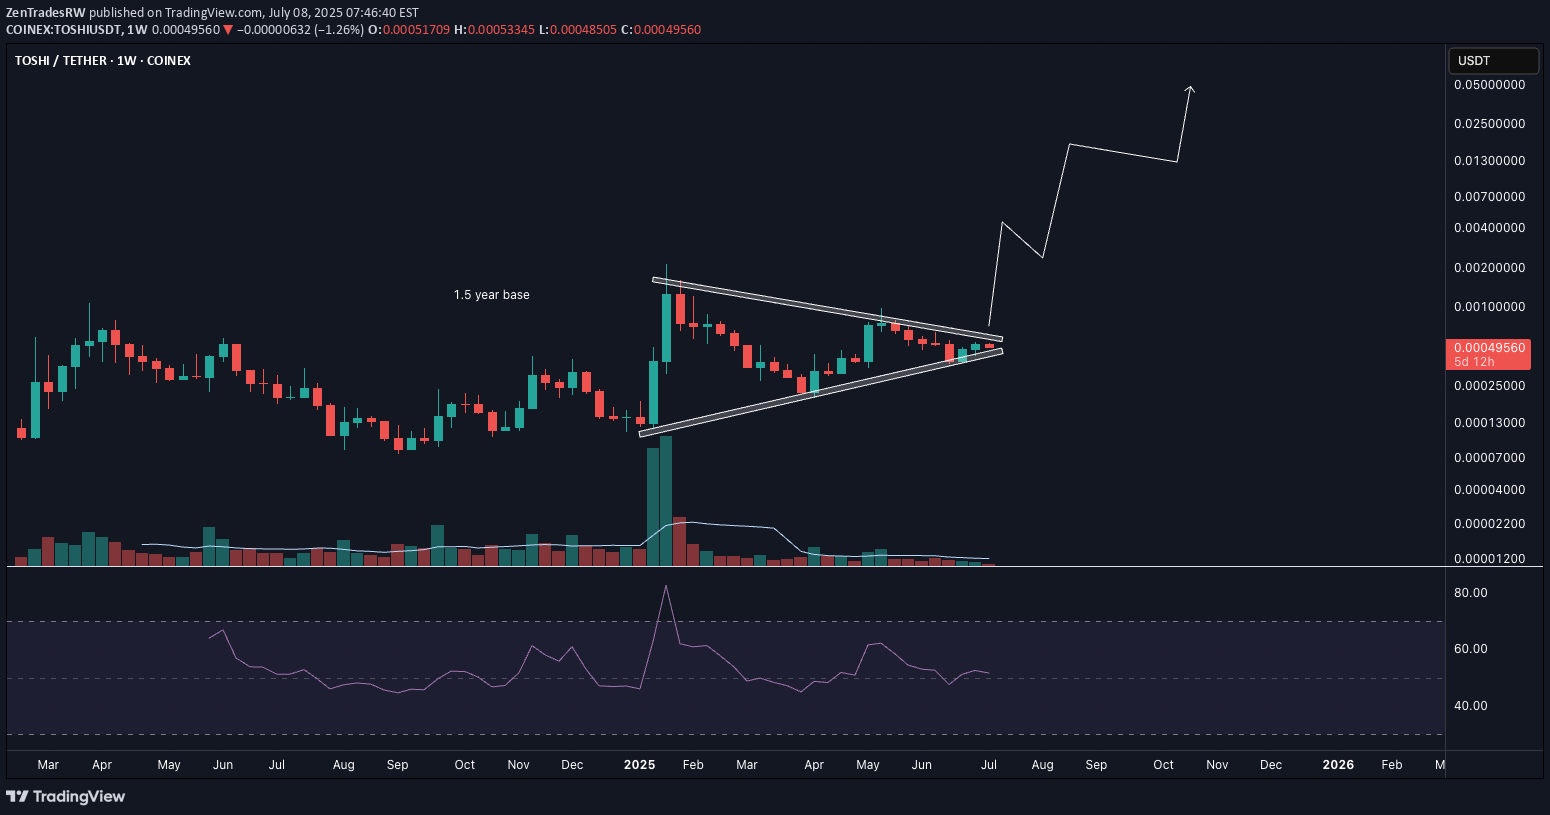
TOSHI, the primary meme on BASE, is tightening up at the end of a 1.5 year base. Looking back at prior leaders like DOGE (2021) and XRP (2017), they based for ~1.5 years before breaking out and going on their huge runs. BASE likely to lead crypto this year given Coinbase's efforts and connections with Washington and TradiFi firms like BlackRock.🎯 Weekly breakout ⏳ Follow-through higher
Disclaimer
Any content and materials included in Sahmeto's website and official communication channels are a compilation of personal opinions and analyses and are not binding. They do not constitute any recommendation for buying, selling, entering or exiting the stock market and cryptocurrency market. Also, all news and analyses included in the website and channels are merely republished information from official and unofficial domestic and foreign sources, and it is obvious that users of the said content are responsible for following up and ensuring the authenticity and accuracy of the materials. Therefore, while disclaiming responsibility, it is declared that the responsibility for any decision-making, action, and potential profit and loss in the capital market and cryptocurrency market lies with the trader.