
TKO
Toko Token
| تریدر | نوع سیگنال | حد سود/ضرر | زمان انتشار | مشاهده پیام |
|---|---|---|---|---|
No results found. | ||||
Price Chart of Toko Token
سود 3 Months :
سیگنالهای Toko Token
Filter
Sort messages by
Trader Type
Time Frame

Traders_Notes
97% Down — Capitulation or Opportunity?
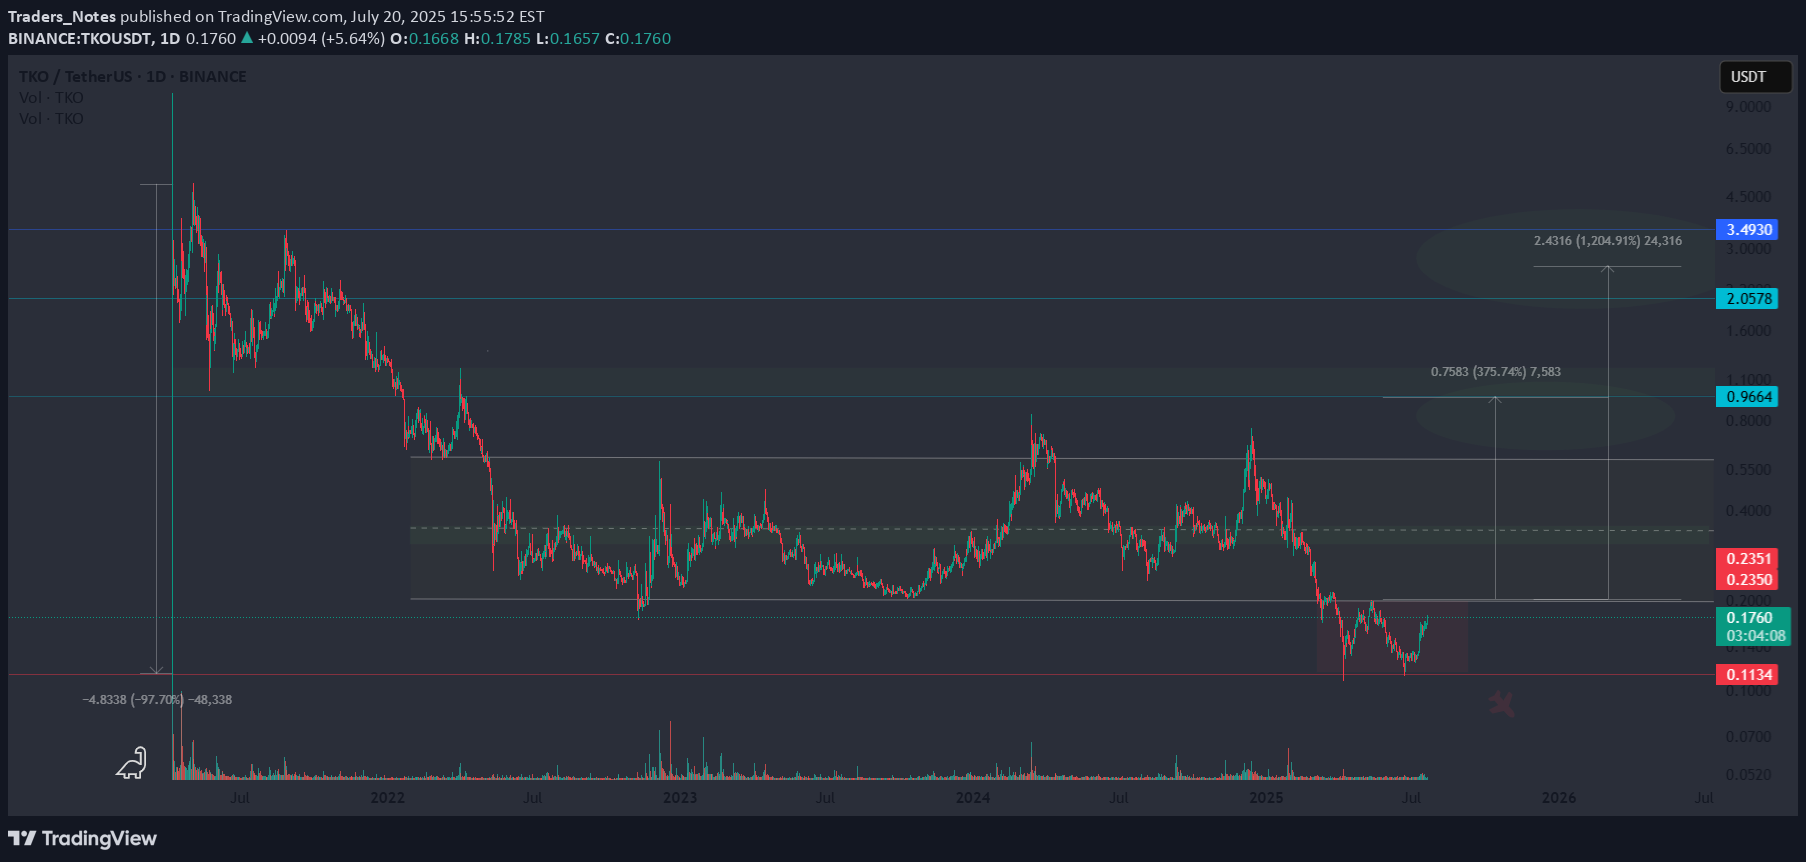
💀 This is beyond a correction — it's a total wipeout. Down 97% from the highs. What looked like a solid accumulation zone? Crushed. Stop-loss hunters had a feast — anyone still holding got flushed out. Now the price is trapped below the former floor — a channel under the channel, the basement of the market. Below that? A void. A drop into the unknown. Yes, there's a theoretical chance of a complete collapse or even a rug pull — unlikely, but your risk management must account for it. 🧠 But here’s what’s more realistic: This is often the exact kind of setup where a silent reversal brews. Fear at extremes. Liquidity dried up. Everyone gave up. First target — a bounce to the midline of the old accumulation zone. ( 0.31-0.34)

behdark
TKO Buy/Long Setup (4H)
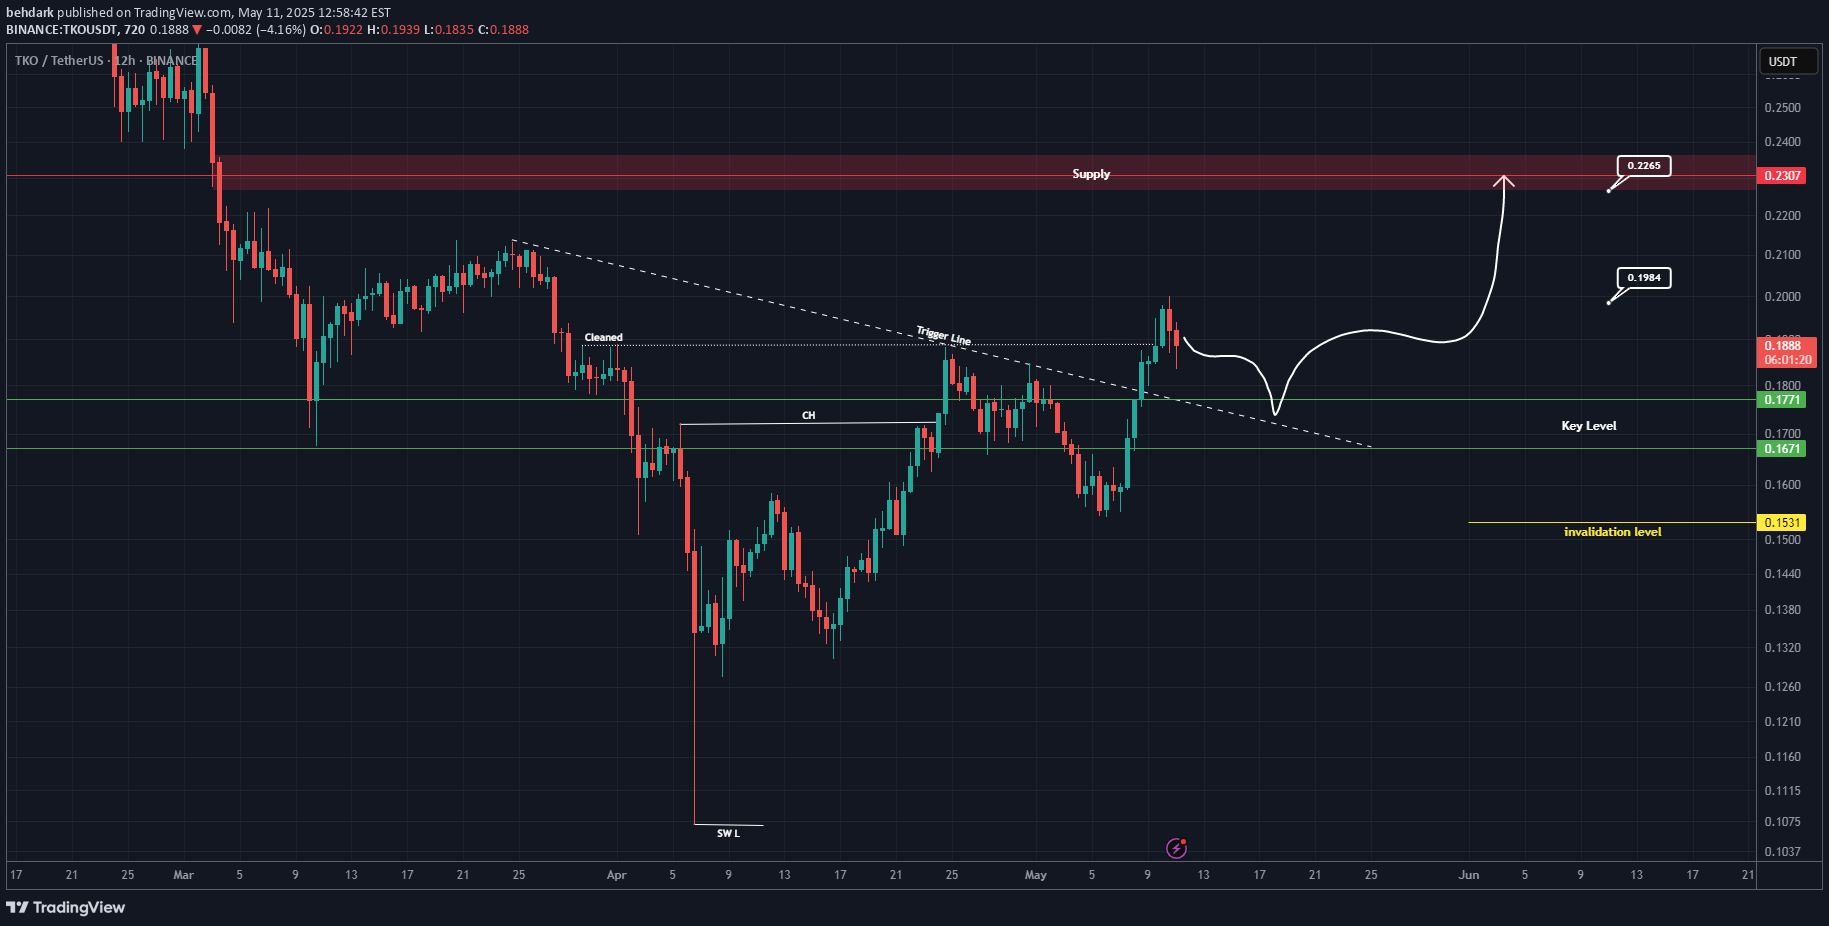
A key level has been reclaimed, a bullish CH has formed on the chart, and an important zone has also been cleared. Additionally, a trigger line has been broken. On the pullback to the key level, we can look for buy/long setups.Targets are marked on the chart.A daily candle closing below the invalidation level will invalidate this analysis.For risk management, please don't forget stop loss and capital managementWhen we reach the first target, save some profit and then change the stop to entryComment if you have any questionsThank You

stanleycrypto
TKO/USDT Update

Bulls holding the $0.42 - $0.43 support with a potential upside to $0.55. Key zone to watch!Bullish or bearish? Share your thoughts!

navid_aerospace
TKOUSDT Analysis: Waiting for the Blue Box

Buyers are active in TKOUSDT, but it's more strategic to wait for the blue boxes to form for a better entry point.Key Insights:Active Buyers: Market sentiment shows buying pressure, but the blue box offers a more defined and reliable demand zone.Waiting for the Blue Box: This approach gives a better risk-reward ratio, allowing for a more calculated entry.Confirmation Checklist:When trading the blue box, I will confirm using:Cumulative Delta Volume (CDV)Liquidity HeatmapVolume ProfileVolume FootprintUpward Market Structure Breaks on Lower Time FramesLearn Advanced Trading Techniques:Want to explore how to use CDV, liquidity heatmaps, or volume profiles for accurate entries? DM me for more details.Final Words:Stay patient, let the blue box form, and make your entry with confidence!If you think this analysis helps you, please don't forget to boost and comment on this. These motivate me to share more insights with you!I keep my charts clean and simple because I believe clarity leads to better decisions.My approach is built on years of experience and a solid track record. I don’t claim to know it all, but I’m confident in my ability to spot high-probability setups.If you would like to learn how to use the heatmap, cumulative volume delta and volume footprint techniques that I use below to determine very accurate demand regions, you can send me a private message. I help anyone who wants it completely free of charge.My Previous Analysis (the list is long but I think it's kinda good : )🎯 ZENUSDT.P: Patience & Profitability | %230 Reaction from the Sniper Entry🐶 DOGEUSDT.P: Next Move🎨 RENDERUSDT.P: Opportunity of the Month💎 ETHUSDT.P: Where to Retrace🟢 BNBUSDT.P: Potential Surge📊 BTC Dominance: Reaction Zone🌊 WAVESUSDT.P: Demand Zone Potential🟣 UNIUSDT.P: Long-Term Trade🔵 XRPUSDT.P: Entry Zones🔗 LINKUSDT.P: Follow The River📈 BTCUSDT.P: Two Key Demand Zones🟩 POLUSDT: Bullish Momentum🌟 PENDLEUSDT.P: Where Opportunity Meets Precision🔥 BTCUSDT.P: Liquidation of Highly Leveraged Longs🌊 SOLUSDT.P: SOL's Dip - Your Opportunity🐸 1000PEPEUSDT.P: Prime Bounce Zone Unlocked🚀 ETHUSDT.P: Set to Explode - Don't Miss This Game Changer🤖 IQUSDT: Smart Plan⚡️ PONDUSDT: A Trade Not Taken Is Better Than a Losing One💼 STMXUSDT: 2 Buying Areas🐢 TURBOUSDT: Buy Zones and Buyer Presence🌍 ICPUSDT.P: Massive Upside Potential | Check the Trade Update For Seeing Results🟠 IDEXUSDT: Spot Buy Area | %26 Profit if You Trade with MSB 📌 USUALUSDT: Buyers Are Active + %70 Profit in Total🌟 FORTHUSDT: Sniper Entry +%26 Reaction🐳 QKCUSDT: Sniper Entry +%57 Reaction📊 BTC.D: Retest of Key Area Highly LikelyI stopped adding to the list because it's kinda tiring to add 5-10 charts in every move but you can check my profile and see that it goes on..

Psychometriks
TKO bullish wave starting


rainbow_sniper
Crypto Pick of the Day: TKOUSDT (Spot)

🌟 Crypto Pick of the Day: TKOUSDT (Spot)Market Overview:TKOUSDT is gearing up for a new bullish wave on the D1 timeframe, perfectly aligning with the larger W cycle. This multi-timeframe confluence suggests strong momentum, making it a prime setup for substantial short-term gains.Trade Plan:📌 Entry: $0.52 - $0.60 – A favorable range to accumulate ahead of the breakout.🎯 Target: Over 100% profit – Doubling your capital as the new wave unfolds.⏳ Horizon: Max 2 weeks – Riding the bullish wave for a timely and profitable exit.About My Indicator:I use RainBow MG3, a custom tool designed to integrate signals across D1 and W cycles, ensuring precise entry points and alignment with broader market trends.👉 Curious about how this works? Contact me for more details!💡 Disclaimer: Not financial advice. Always do your own research.

CryptoAnalystSignal
#TKO/USDT Ready to go up

#TKOThe price is moving in a descending channel on a 1-day frame and sticking to it wellWe have a bounce from the lower limit of the descending channel, this support is at 0.2906We have a downtrend, the RSI indicator is about to break, which supports the riseWe have a trend to stabilize above the moving average 100Entry price 0.3650First target 0.3883Second target 0.4330Third target 0.4890

enerjix
TKO USDT WOLF WAVE

5 Wave wolf formation has formed, when it pulls back to the buy zone, it can be bought YTD
enerjix
TKO USDT WOLF WAVE

5 Wave wolf formation has formed, when it pulls back to the buy zone, it can be bought YTD

AlanSantana
Tokocrypto Goes Bullish (Inverted Head & Shoulders)

Tokocrypto (TKOUSDT) now confirms the continuation of a bullish-trend. We have the classic inverted head and shoulders pattern.The head and shoulders pattern tends to come at the top of a trend, but the inverted version is also valid when it shows up at the bottom. This is a reversal signal.Coming up at this juncture, coupled with really high volume and breaking decidedly above "resistance," we can conclude that TKOUSDT is set to continue with the wave that started in late 2023, that is, the continuation of the bullish move.We have the start of the wave in October 2023. A peak in March 2024 and a bottom in August 2024, the end of the correction.We can say that the correction ended in August because of the signals that are present on the chart now. Such strong action indicates the bulls are entering the market with force.The target on the chart is for illustration only, short-term; long-term there can be more, much, much more.My intention here is to show you what I see, the pair, the analysis, the signals... When we look at several of these charts, we will get a clear picture as to how the market will be moving. I am talking about the USDT pairs. We already looked at enough BTC pairs. Don't you agree?Namaste.
Disclaimer
Any content and materials included in Sahmeto's website and official communication channels are a compilation of personal opinions and analyses and are not binding. They do not constitute any recommendation for buying, selling, entering or exiting the stock market and cryptocurrency market. Also, all news and analyses included in the website and channels are merely republished information from official and unofficial domestic and foreign sources, and it is obvious that users of the said content are responsible for following up and ensuring the authenticity and accuracy of the materials. Therefore, while disclaiming responsibility, it is declared that the responsibility for any decision-making, action, and potential profit and loss in the capital market and cryptocurrency market lies with the trader.