
Traders_Notes
@t_Traders_Notes

What symbols does the trader recommend buying?
Purchase History
پیام های تریدر
Filter
Traders_Notes
تحلیل TRUMP-USDT: آماده جهش یا سقوط؟ محدوده حیاتی پیش رو!

After a sweep into the capitulation zone below the April lows, the price has returned to the resistance area of the descending channel. A classic range breakdown–retest structure is forming, with price now consolidating within the resistance zone — a typical accumulation phase before a potential breakout. Further movement may turn into an impulse, depending on the broader market context — either breaking out of the channel or retesting lower levels once more. 📊 Watch the price reaction in this zone — it will define the next medium-term move.
Traders_Notes
کانال صعودی FET: آیا تکرار تاریخ، فرصتهای جدیدی میسازد؟
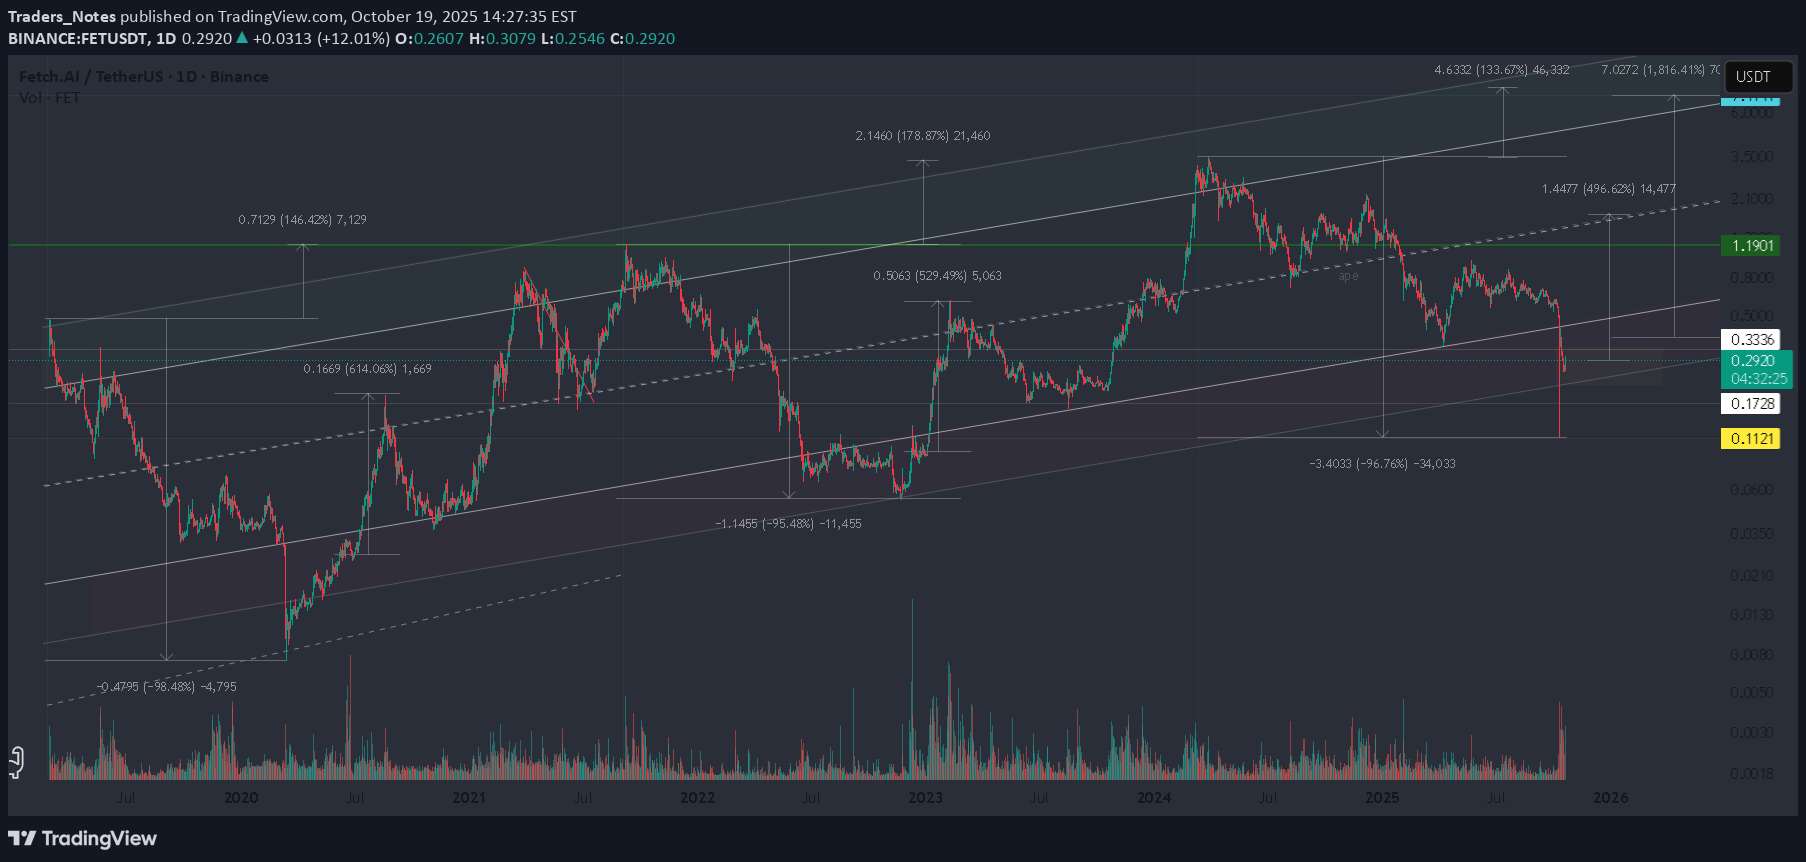
The current deep wick strongly resembles the COVID-era capitulation — essentially, the same market structure repeating. Cycle lows consistently occur around –96–98% from the peaks, forming a clear historical pattern. Everything is clearly shown on the chart — the next move depends on your strategy and risk control. What matters most is not the direction itself, but how you act in each specific market situation.
Traders_Notes
آینده میمون (APE): نزدیک شدن به نقطه انفجار قیمتی پس از تثبیت تابستانی!

After a prolonged downtrend, APE has entered a summer consolidation phase, with the range tightening week by week. Such formations usually precede a strong breakout. The market is now approaching a decisive move. 📌 Breakout to the upside may confirm a bullish pennant, with the first target around 0.64 and further potential toward dynamic resistance near 0.94. That could trigger a broader recovery. 📌 Breakout to the downside would retest the lower support zone, once again checking the real demand for the token. ⚠️ On the macro scale, APE is still trading about -97% below its ATH. Scary to buy something that has dropped this much? Maybe. But think about it — at $2 it won’t feel scary anymore. Often, these are exactly the zones where the best long-term opportunities appear.
Traders_Notes
ZROUSDT — Breakout from Triangle Consolidation
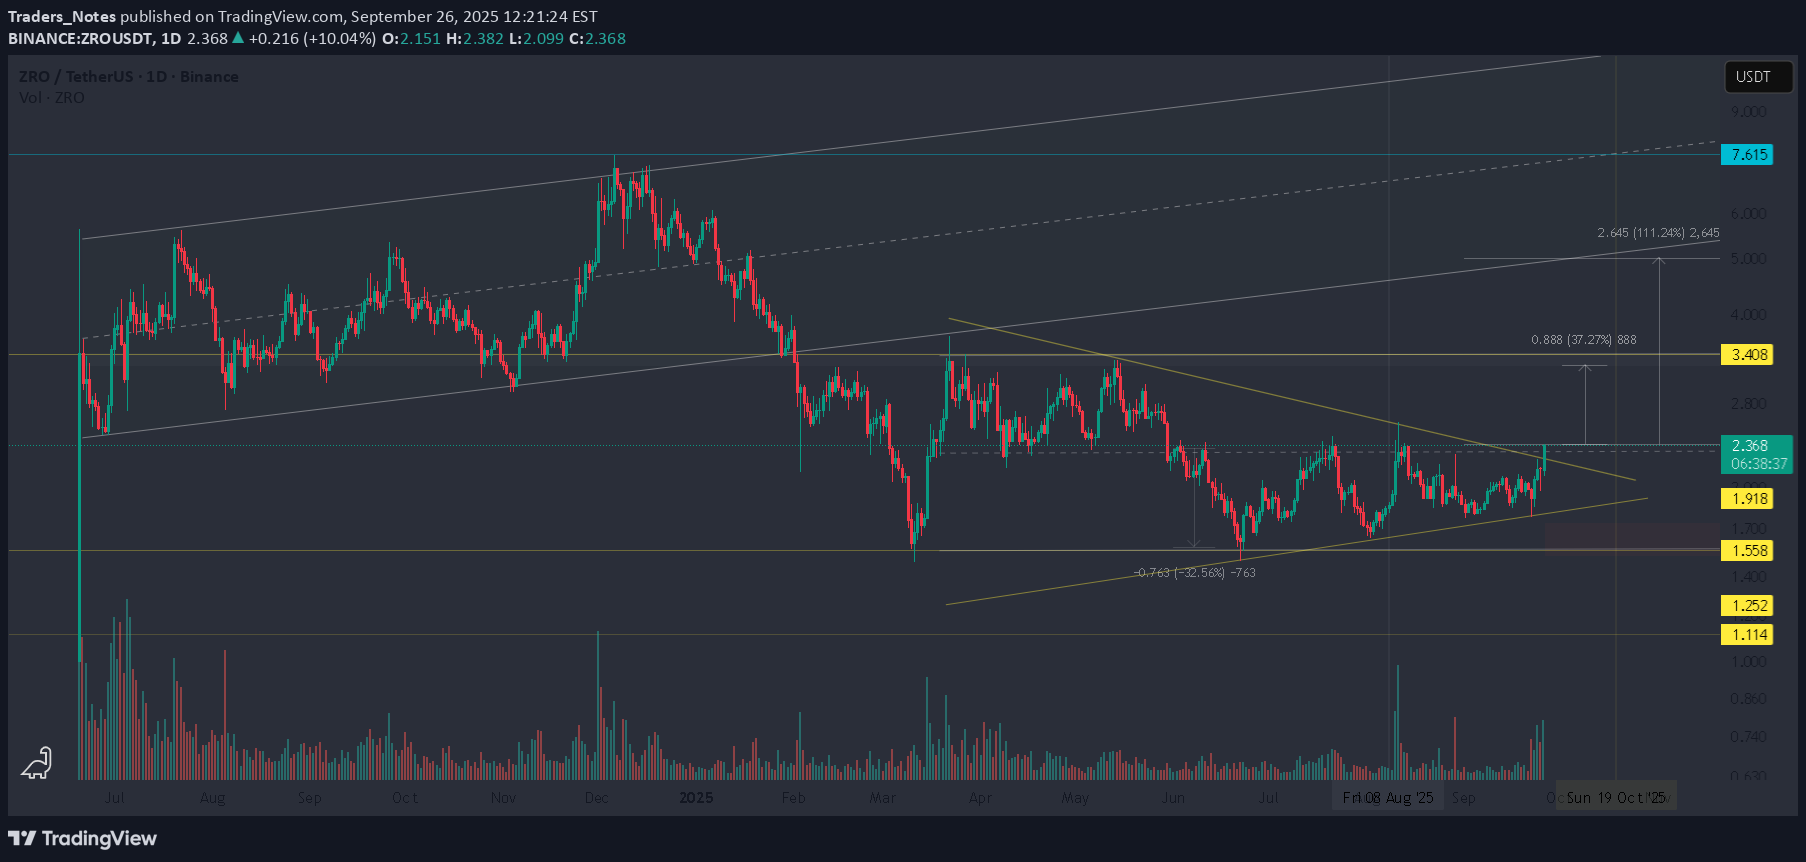
The price is breaking out of a triangular consolidation that had been forming for over three months during the summer. Near-term target: resistance zone around 3.40, which aligns with the top of the channel. Mid-term outlook: potential development of a cup formation with resistance in the 6.50–7.50 range. ⚠️ Keep in mind that the asset remains volatile, and downside risks are still present — price action will largely depend on overall market conditions. 📌 A confirmed breakout and hold above 3.40 would significantly increase the probability of accelerated growth.
Traders_Notes
High-Risk Crypto Bet – DODO Analysis

DODO is a decentralized finance (#DeFi) protocol that has seen a brutal 99% drawdown from its peak — making it one of the most devalued tokens in the market. 📉 Structure: The chart shows a “channel within a channel” structure — a signal of prolonged capitulation. DODO is currently in a range where most have written it off. But history shows that such zones often precede major reversals. 🌀 Formation: A potential inverse head and shoulders pattern is developing — a classic reversal setup. The minimal target from this structure is around $0.08. 📈 Early Signal: Price has already bounced +75% from the bottom — a possible sign of early accumulation. ☕ Bigger Picture: This zone might be forming the right side of a long-term cup pattern — hinting at a potential macro reversal if the market supports.
Traders_Notes
DOGS/USDT — Capitulation Zone. Is the Breakout Coming?

The price has been moving sideways for several months, forming a classic low-volatility summer channel. 🔹 Primary trend: still bearish — price remains inside a descending channel 🔹 Volume: mostly low, but occasional spikes near support may signal hidden accumulation 🔹 Formation: a triangle is forming near the top of the channel — false breakouts or wicks are likely 🔹 Sentiment: this is a classic capitulation zone — where most traders give up, exit positions, and lose conviction 📉 When everyone thinks it's dead — that's often where major bottoms are built. This is the time to stick to your risk strategy and position sizing, not emotions. 🐕 DOGS — key reasons to watch: • Twitter community: 3.4M followers — huge potential for renewed interest • If memecoins return to trend — moves could be fast and aggressive 📌 Watch closely for a breakout from the triangle — it could define direction for weeks ahead
Traders_Notes
AVAX: A Quiet Rocket?

This might be the calm before the cycle. 📍 All the liquidity is above. Levels like 33 and 61 aren’t just resistance — they’re fuel. Clusters of short liquidations and forgotten limit orders are sitting right there. If we get a breakout, it could be sharp. And if there’s another pullback? Don’t panic. That would be the test — the shakeout before the move. 🚀 If the cycle kicks in, AVAX could be one of the silent leaders. While the crowd is focused elsewhere, AVAX has been building quietly: structure, accumulation, time. The kind of setup that doesn’t scream hype, but whispers opportunity.
Traders_Notes
97% Down — Capitulation or Opportunity?
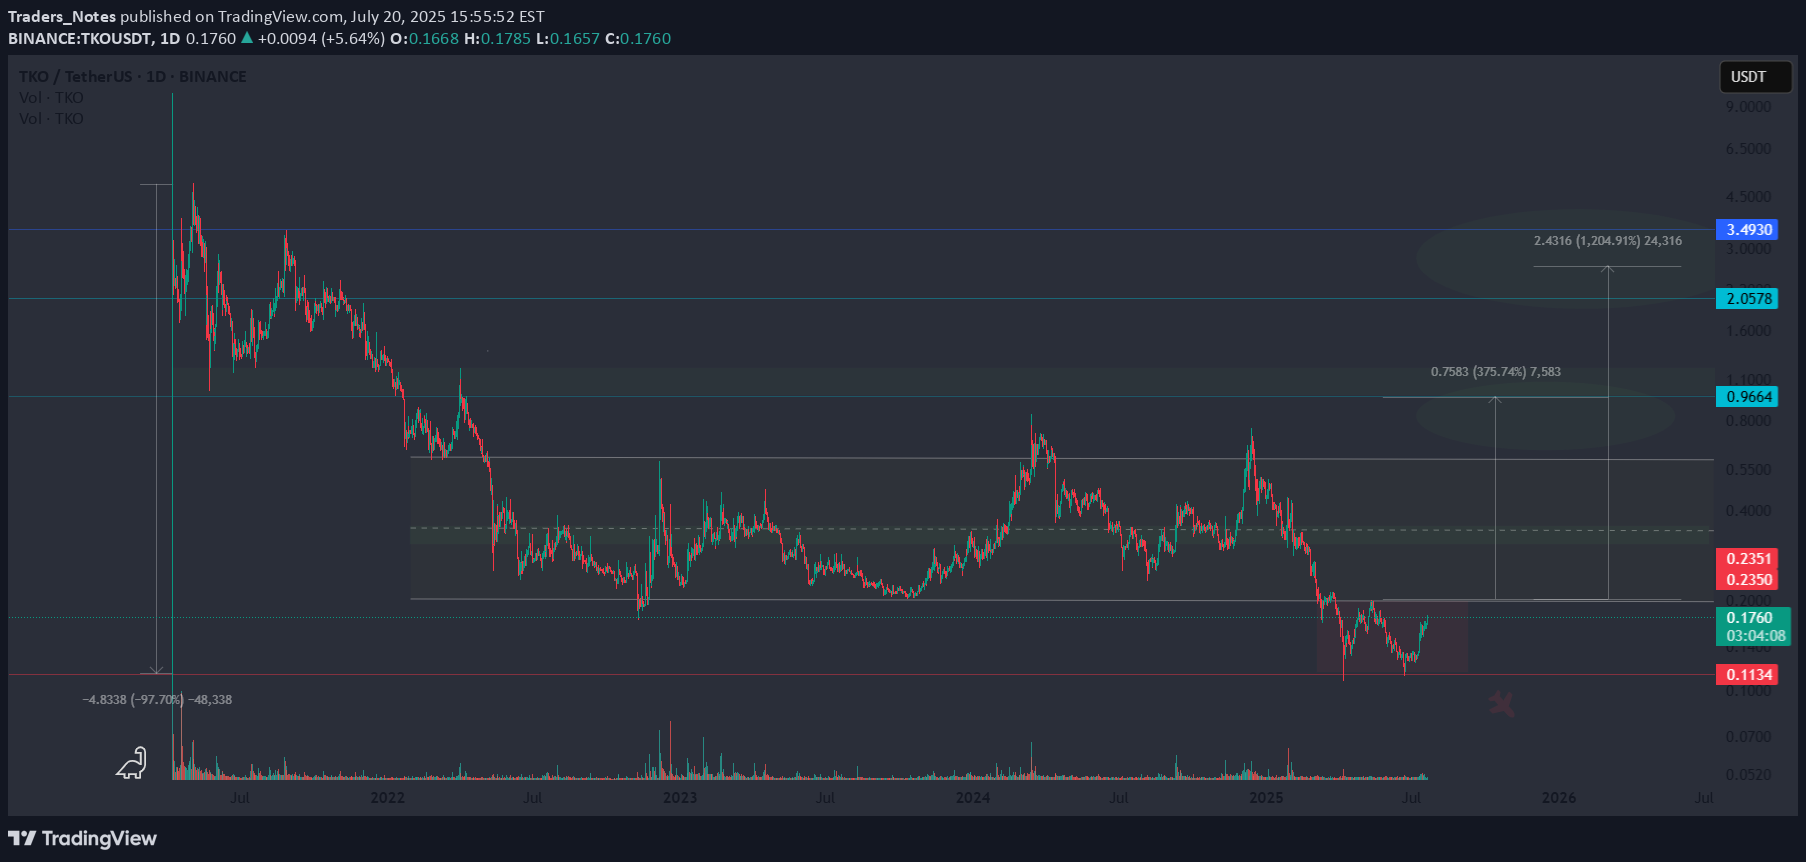
💀 This is beyond a correction — it's a total wipeout. Down 97% from the highs. What looked like a solid accumulation zone? Crushed. Stop-loss hunters had a feast — anyone still holding got flushed out. Now the price is trapped below the former floor — a channel under the channel, the basement of the market. Below that? A void. A drop into the unknown. Yes, there's a theoretical chance of a complete collapse or even a rug pull — unlikely, but your risk management must account for it. 🧠 But here’s what’s more realistic: This is often the exact kind of setup where a silent reversal brews. Fear at extremes. Liquidity dried up. Everyone gave up. First target — a bounce to the midline of the old accumulation zone. ( 0.31-0.34)
Traders_Notes
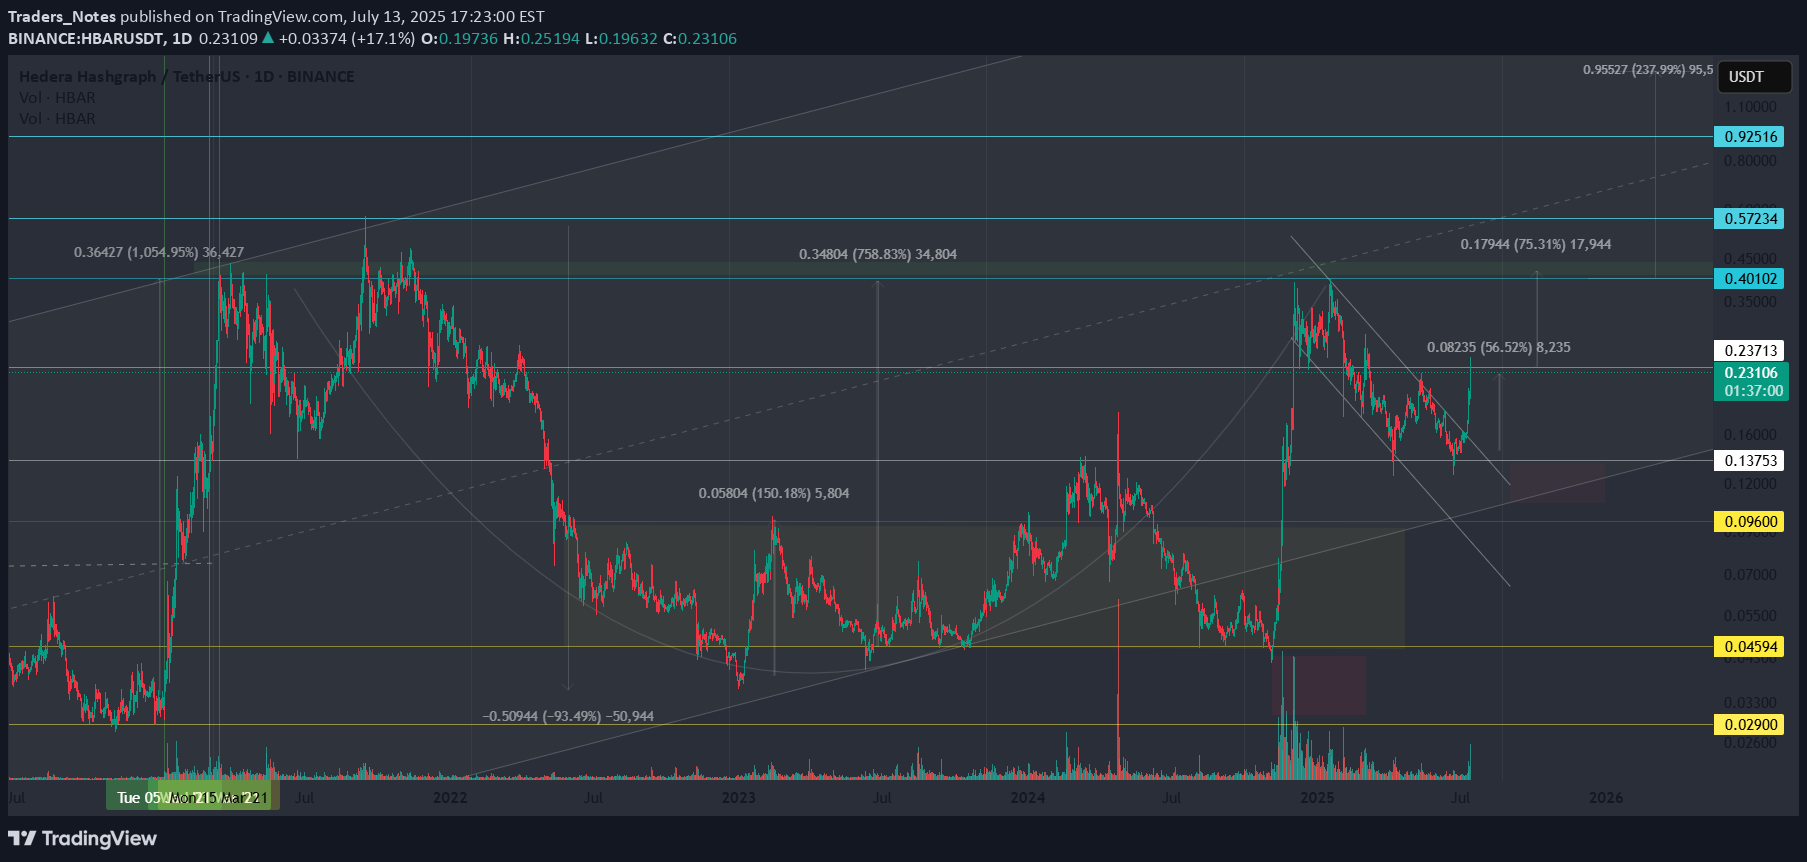
HBAR — “Cup and Handle” in Motion: Secondary Trend Unfolding

Secondary Trend (Recovery Phase After Capitulation) After a long accumulation phase at the bottom, the price made a strong impulsive move upward with growing volume. This created a classic “Cup and Handle” formation, where the initial surge was stopped by major resistance near the cup's rim. Currently, the price is finalizing the handle and may be preparing for a potential breakout continuation. Local Trend (Within the Handle) The handle has formed a Double Bottom pattern — typically a bullish structure. Since the price has already moved significantly off the lows, this is not the best entry point for short-term trades. However, from a secondary trend perspective, the setup still looks promising. Target Zones If the breakout continues, the first significant target lies near the resistance zone of the previous cup top — a key area where sellers previously stepped in. Reaching this zone would confirm the strength of the recovery trend and may lead to a broader reversal. ✅ Not financial advice. Always follow your own trading plan and risk management strategy.
Traders_Notes
HBAR — “Cup and Handle” in Motion: Secondary Trend Unfolding
Secondary Trend (Recovery Phase After Capitulation) After a long accumulation phase at the bottom, the price made a strong impulsive move upward with growing volume. This created a classic “Cup and Handle” formation, where the initial surge was stopped by major resistance near the cup's rim. Currently, the price is finalizing the handle and may be preparing for a potential breakout continuation. Local Trend (Within the Handle) The handle has formed a Double Bottom pattern — typically a bullish structure. Since the price has already moved significantly off the lows, this is not the best entry point for short-term trades. However, from a secondary trend perspective, the setup still looks promising. Target Zones If the breakout continues, the first significant target lies near the resistance zone of the previous cup top — a key area where sellers previously stepped in. Reaching this zone would confirm the strength of the recovery trend and may lead to a broader reversal. ✅ Not financial advice. Always follow your own trading plan and risk management strategy. 🔍 For more trade setups — find us on Telegram and join the discussion.
Disclaimer
Any content and materials included in Sahmeto's website and official communication channels are a compilation of personal opinions and analyses and are not binding. They do not constitute any recommendation for buying, selling, entering or exiting the stock market and cryptocurrency market. Also, all news and analyses included in the website and channels are merely republished information from official and unofficial domestic and foreign sources, and it is obvious that users of the said content are responsible for following up and ensuring the authenticity and accuracy of the materials. Therefore, while disclaiming responsibility, it is declared that the responsibility for any decision-making, action, and potential profit and loss in the capital market and cryptocurrency market lies with the trader.