
SUI
Sui
| تریدر | نوع سیگنال | حد سود/ضرر | زمان انتشار | مشاهده پیام |
|---|---|---|---|---|
 f.bhianRank: 2169 | خرید | حد سود: تعیین نشده حد ضرر: تعیین نشده | 12/3/2025 | |
 davidjulien369Rank: 4307 | خرید | حد سود: تعیین نشده حد ضرر: تعیین نشده | 6 hour ago | |
 pullbacksignalRank: 17180 | خرید | حد سود: تعیین نشده حد ضرر: تعیین نشده | 12/19/2025 | |
 Richtv_officialRank: 17494 | خرید | حد سود: تعیین نشده حد ضرر: تعیین نشده | 12/3/2025 | |
 Jos-ProTraderRank: 29495 | خرید | حد سود: تعیین نشده حد ضرر: تعیین نشده | 12/18/2025 |
Price Chart of Sui
سود 3 Months :
خلاصه سیگنالهای Sui
سیگنالهای Sui
Filter
Sort messages by
Trader Type
Time Frame
davidjulien369
Long trade
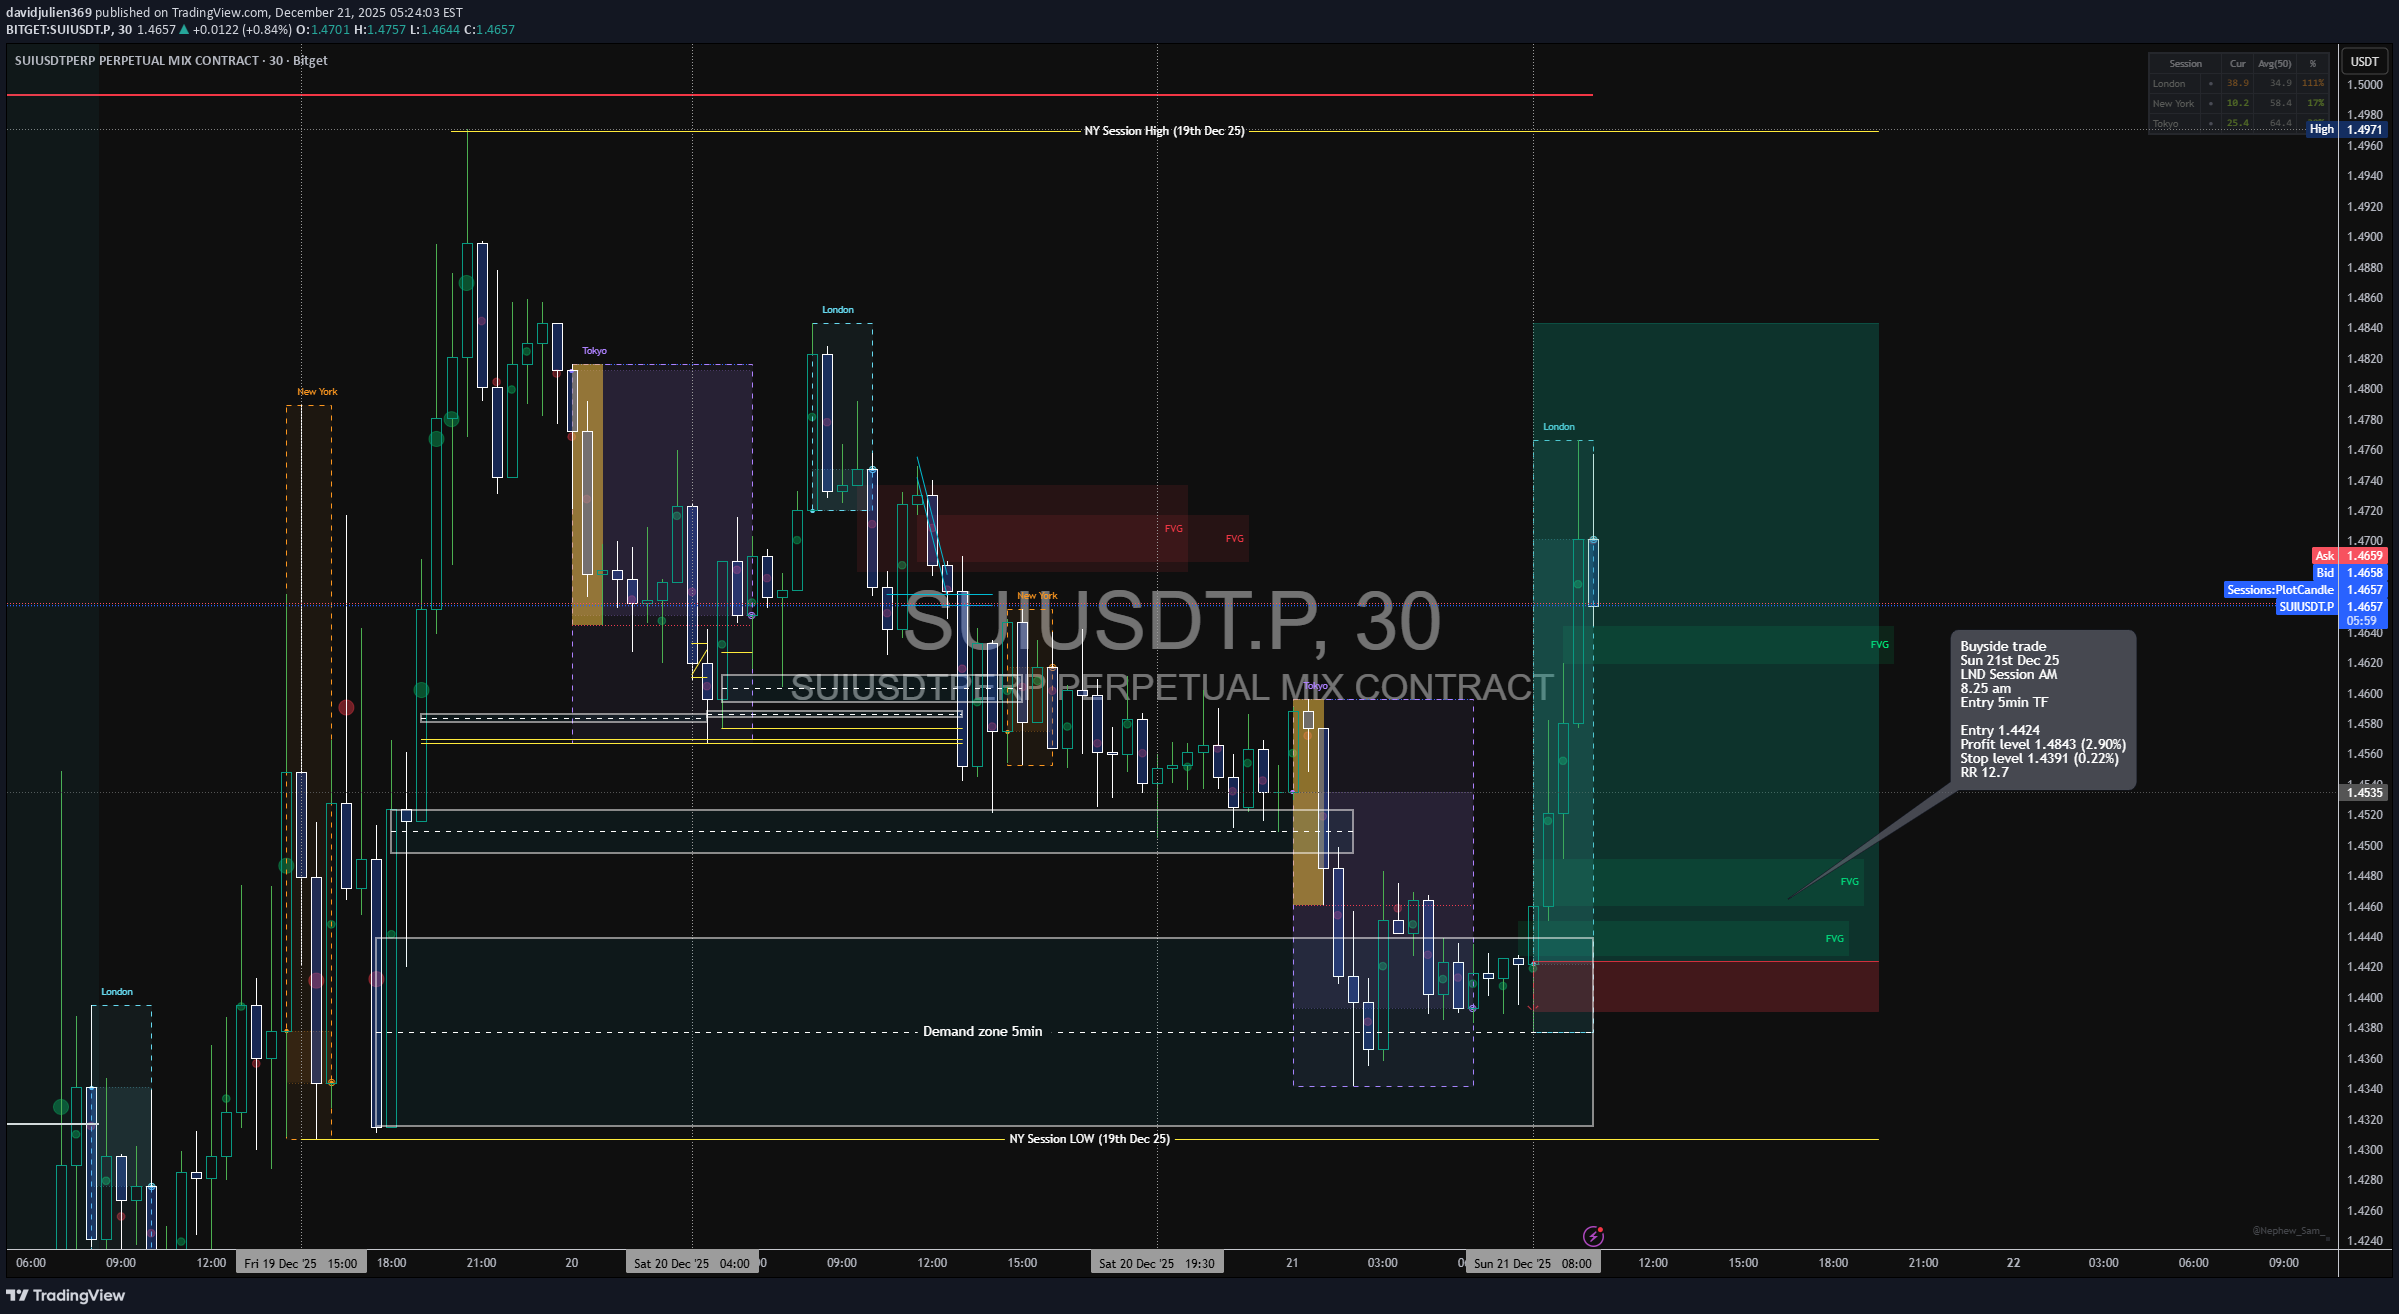
Buyside trade Sun 21st Dec 25 LND Session AM 8.25 am Entry 5min TF Entry 1.4424 Profit level 1.4843 (2.90%) Stop level 1.4391 (0.22%) RR 12.7 📌 SUIUSDT.P — Buy-Side Liquidity Expansion (30M) Market: SUIUSDT Perpetual Timeframe: 30 minutes Model: AMD (Accumulation → Manipulation → Distribution) Bias: Bullish continuation after sell-side failure 🔍 Market Context -STRUCTURE The price traded back into discount territory following a controlled sell-side sweep below the prior session's lows. Higher-timeframe structure remains intact, with no bearish BOS confirmed. This created a classic environment for buy-side delivery once liquidity has been engineered. 🧠 Setup Logic (Institutional Narrative) Accumulation (A): Range compression following sell-side sweep Price stabilises inside a defined demand zone Manipulation (M): Wick and displacement observed - demand zone Stops cleared beneath NY session lows Distribution / Expansion (D): Strong bullish displacement from demand Expansion delivered during the London → NY overlap 🟦 TAB 6 — FVG / INEFFICIENCY Multiple 5m / 30m FVGs below price Price respected FVG support on retest Clean imbalance → expansion behaviour
BUY BIAS
I've been watching it for days now, gotten my confluence so I'll entering now... posting it for those who would wanna take it as well, if you come across this 2 hours later I wouldn't recommend you join. Not a financial advice risk what you can afford to lose. The trade is just my idea nothing is certain in the market.
pullbacksignal
SUIUSDT İçin Alım Satım Sinyali
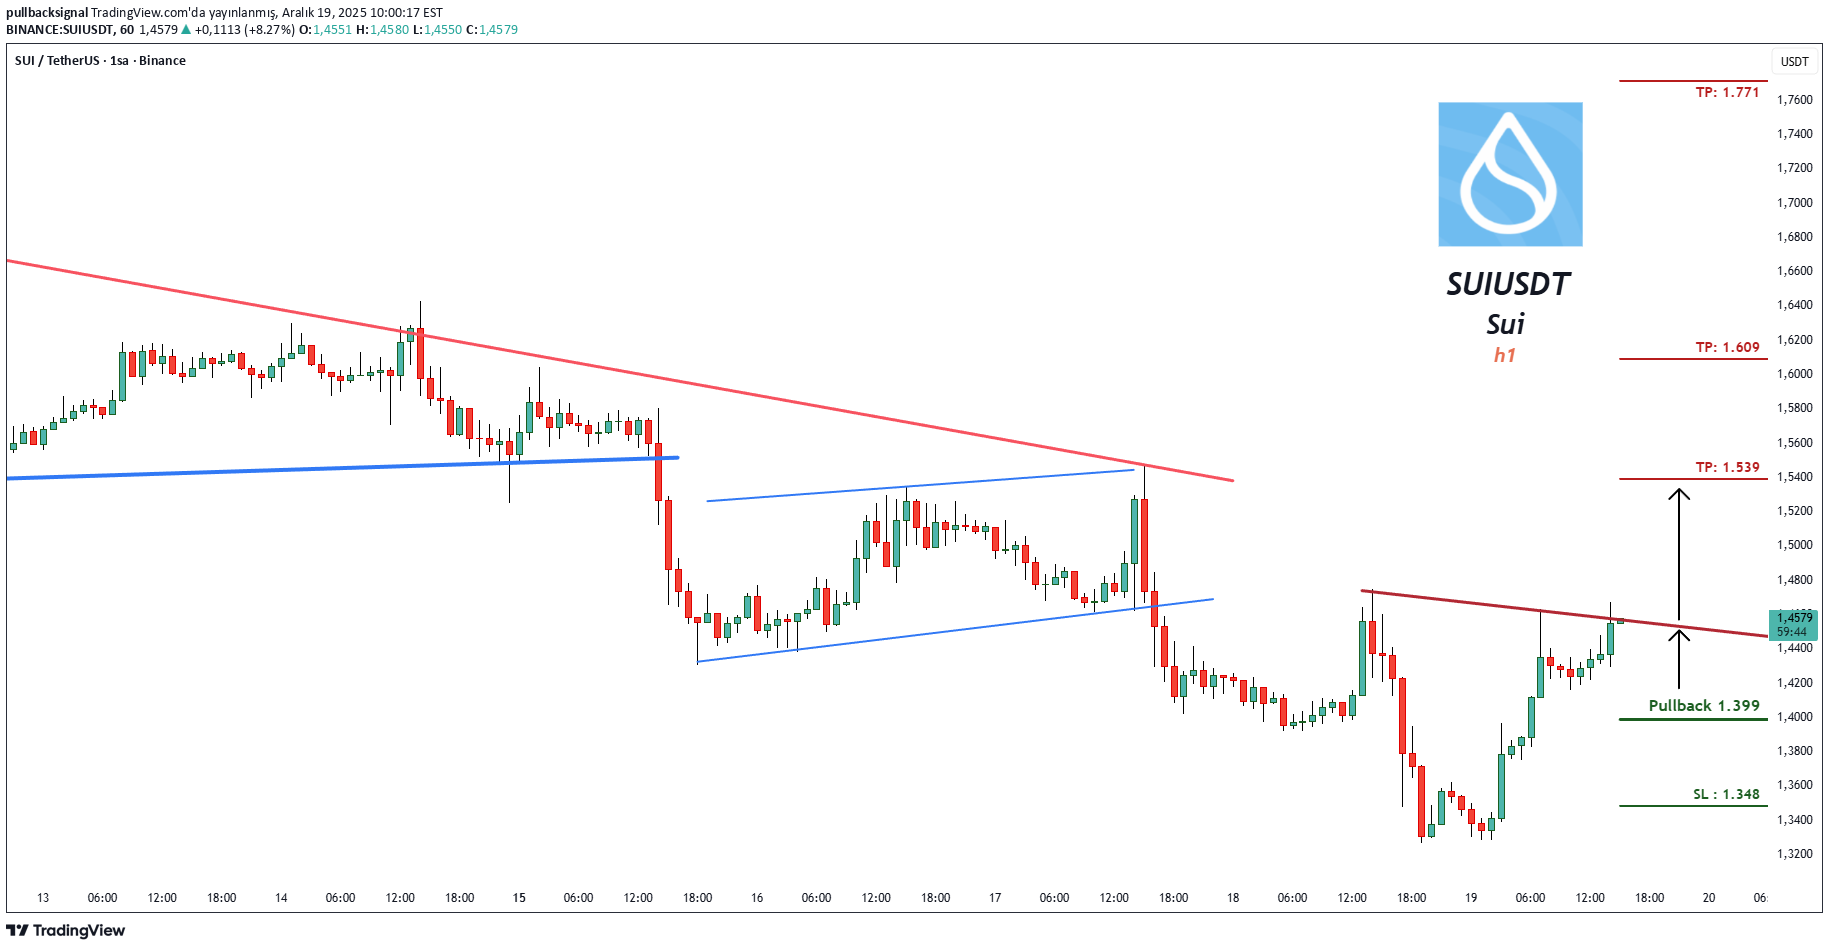
Alım Satım Kurulumu: SUIUSDT Sui (1h) (vadeli işlemler) için bir alım satım sinyali görülmektedir. EURUSD döviz çiftinde bir Alım Satım Sinyali bulunmaktadır. Yatırımcılar ŞİMDİ Alım işlemlerini açabilirler. ⬆️Şimdi Al veya 1.399'da Al ⭕️SL @ 1.348 🔵TP1 @ 1.539 🔵TP2 @ 1.609 🔵TP3 @ 1.771 Bu sinyaller neye dayanmaktadır? Klasik Teknik Analiz Fiyat Hareketi Mum Grafikleri Fibonacci RSI, Hareketli Ortalama, Ichimoku, Bollinger Bantları Risk Uyarısı Forex, CFD'ler, Kripto Paralar, Vadeli İşlemler ve Hisse Senetleri ticareti kayıp riski içerir. Lütfen bu tür işlemlerin sizin için uygun olup olmadığını dikkatlice değerlendirin. Geçmiş performans, gelecekteki sonuçların göstergesi değildir. Fikirlerimizi beğendiyseniz, lütfen beğenileriniz 👍 ve yorumlarınızla bize destek olun.
pullbacksignal
Trading Signal For SUIUSDT
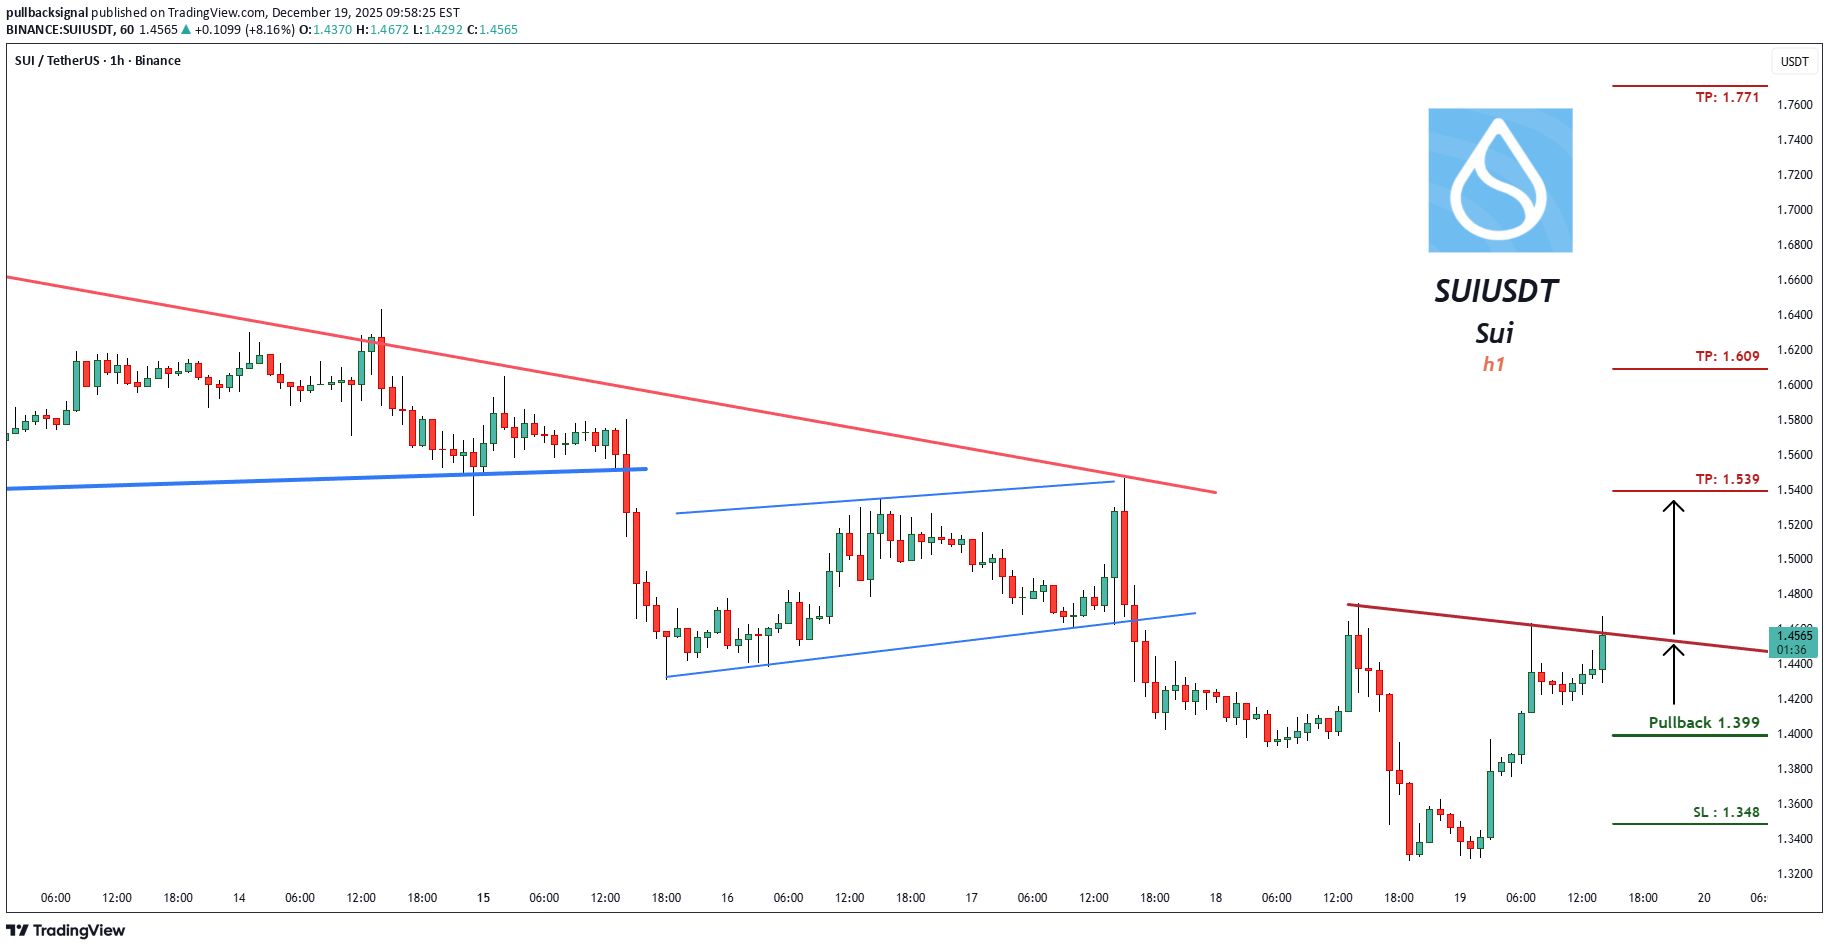
Trading Setup: A Trading Signal is seen in the SUIUSDT Sui (1h) (futures) There is a Trading Signal to Buy in EURUSD Currency Pair. Traders can open their Buy Trades NOW ⬆️Buy now or Buy on 1.399 ⭕️SL @ 1.348 🔵TP1 @ 1.539 🔵TP2 @ 1.609 🔵TP3 @ 1.771 What are these signals based on? Classical Technical Analysis Price Action Candlesticks Fibonacci RSI, Moving Average , Ichimoku , Bollinger Bands Risk Warning Trading Forex, CFDs, Crypto, Futures, and Stocks involve a risk of loss. Please consider carefully if such trading is appropriate for you. Past performance is not indicative of future results. If you liked our ideas, please support us with your likes 👍 and comments .

SwallowAcademy
Sui (SUI): Each Start of Pump Been Different | Looking For Pump!
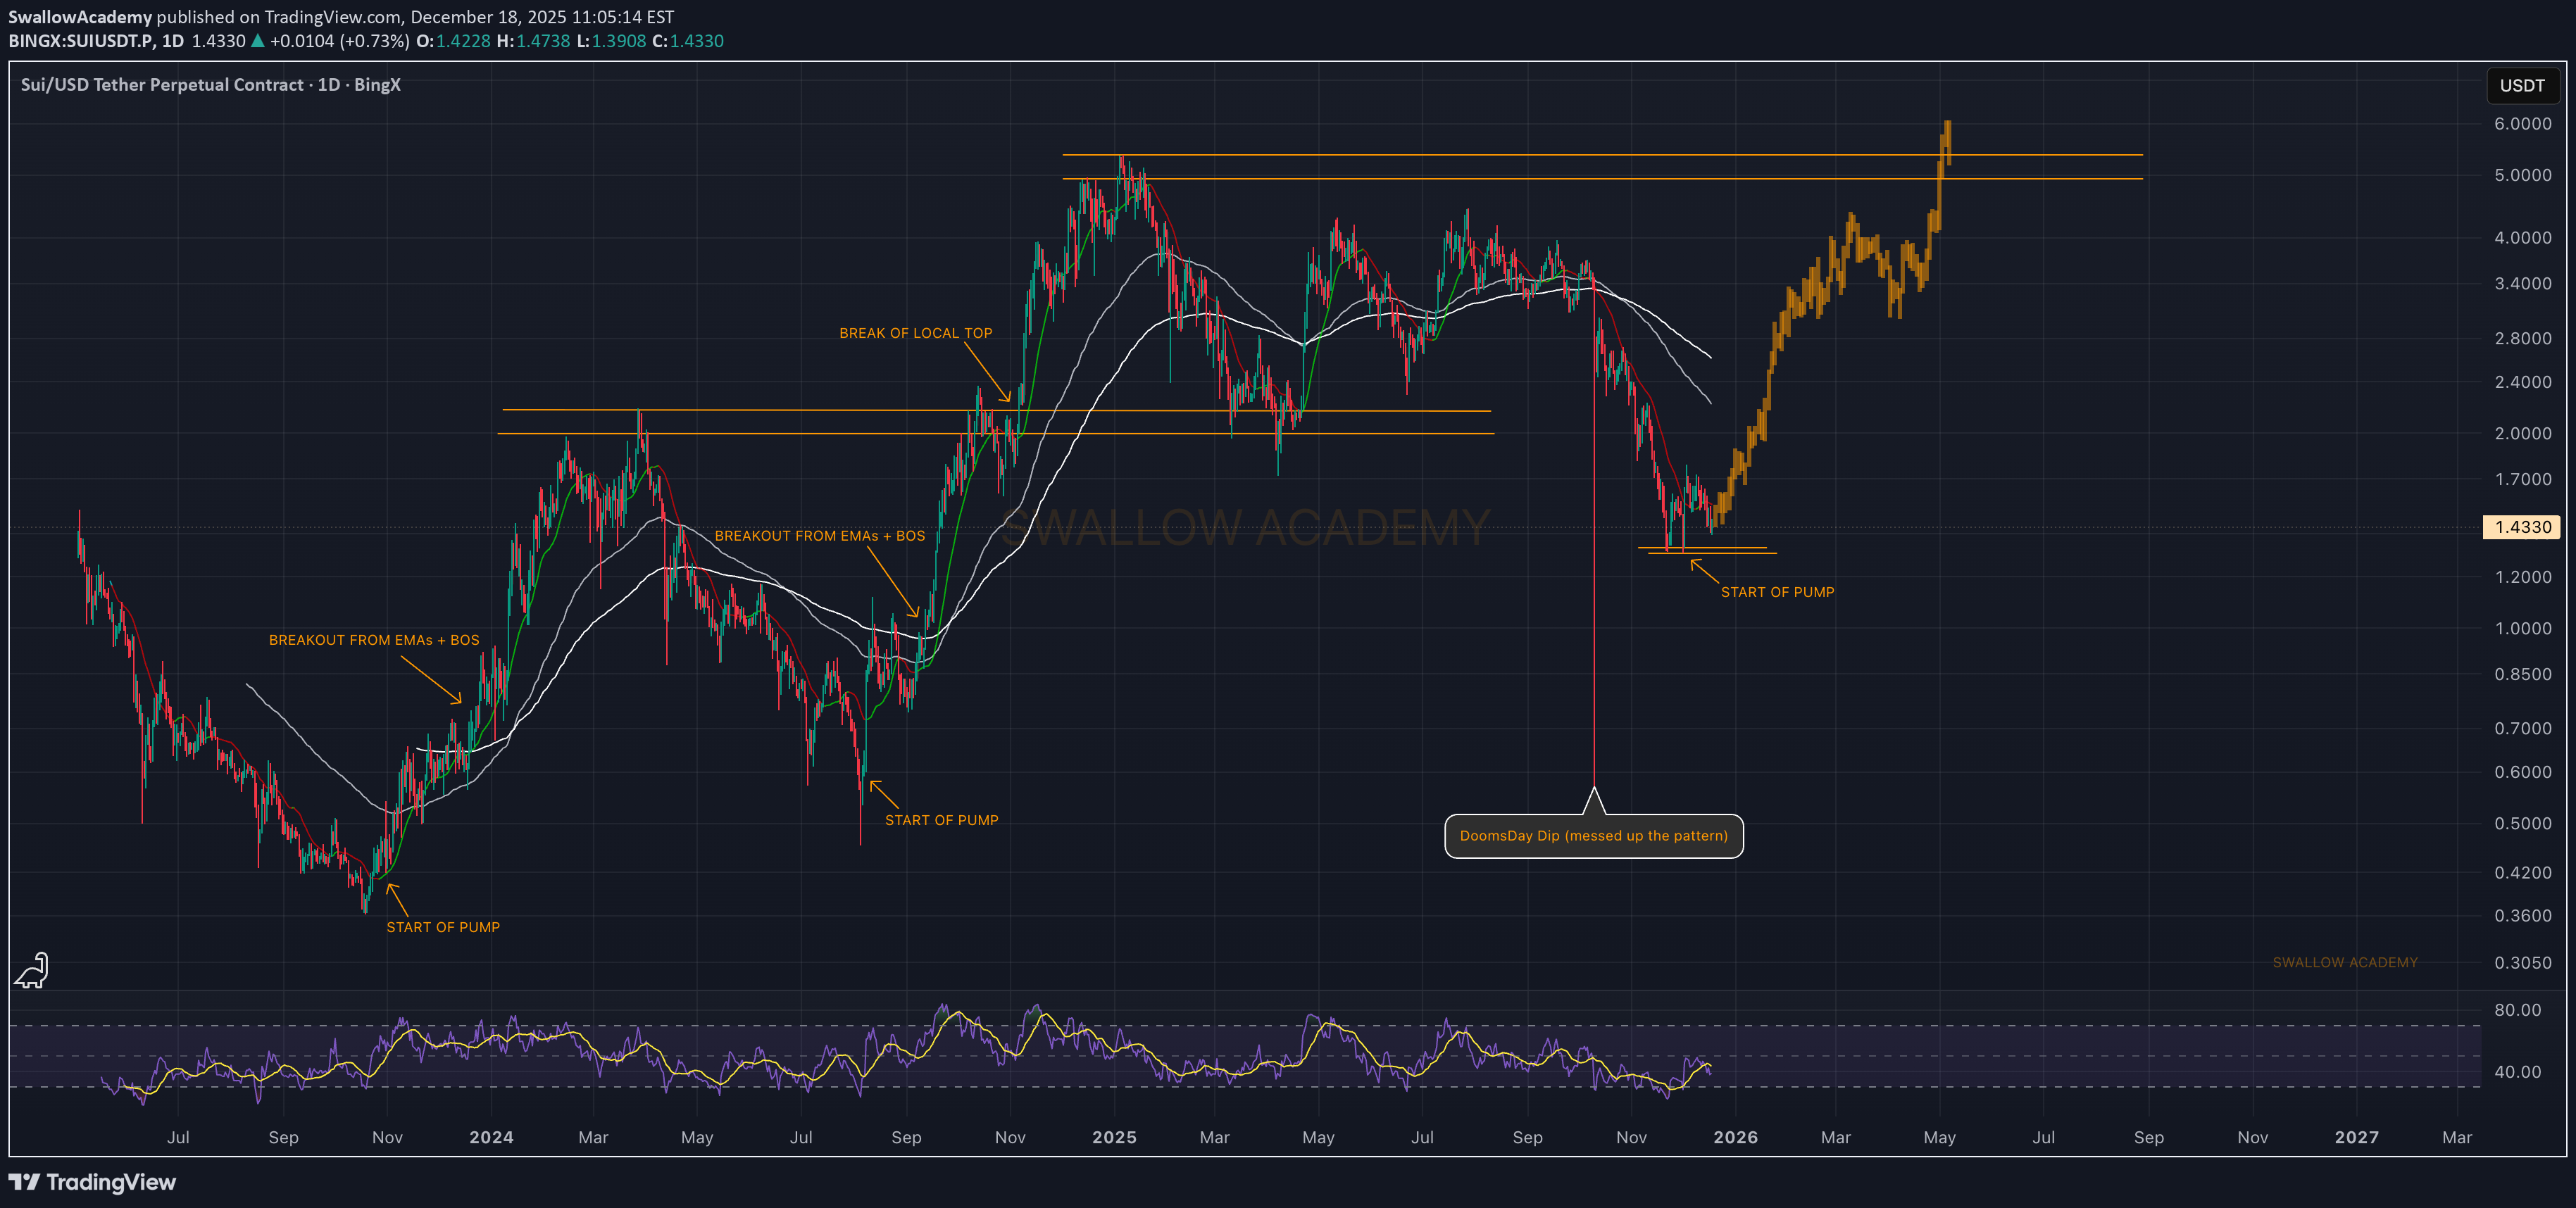
SUI might be forming for the 3rd time the pattern that previously has been giving us a decent upside movement. Now the start of the pump is hard to determine, as it has always been different but the pattern remains the same. As price currently has formed some kind of supportive zone, we are expecting to see a decent breakout to form from here, which would then lead the price to upper zones. The first target is going to be the EMAs, which, upon seeing a breakout from, will be our second confirmation where we could open another long position (until the next break of local top) Swallow Academy

wolffxtrader
SUI
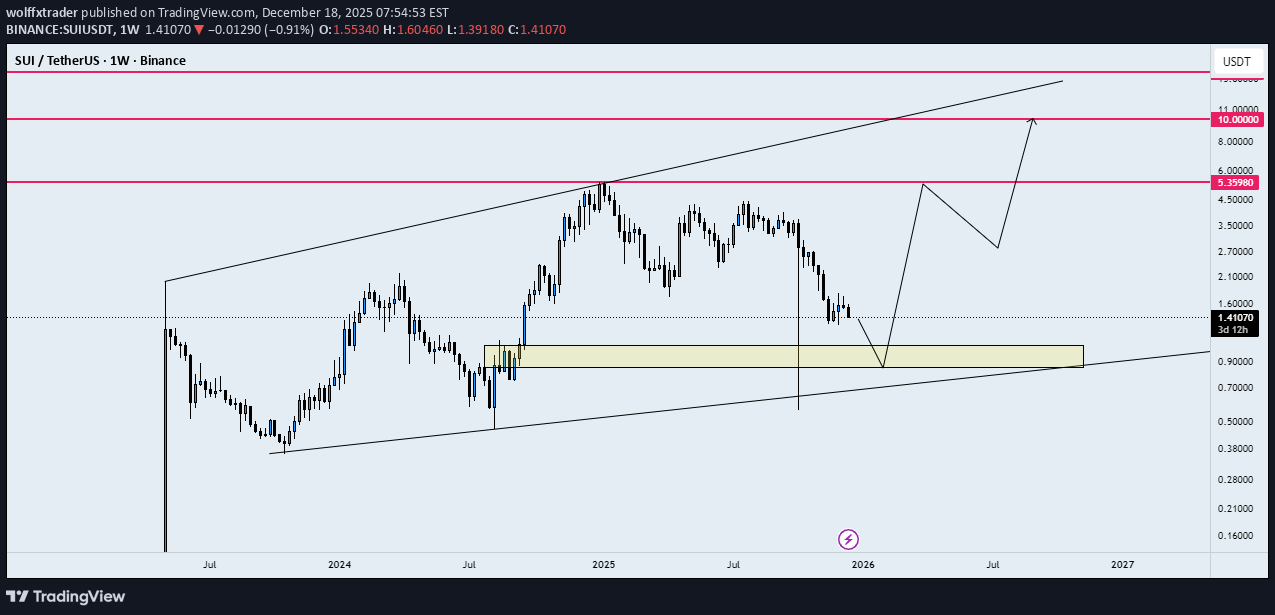
hello traders how are you today? as you can see price started a big correction and i think bulls are coming back and i want to buy at the correction. be safe enjoy.

CryptoAnalystSignal
#SUI/USDT Could switch sides soon. Be ready
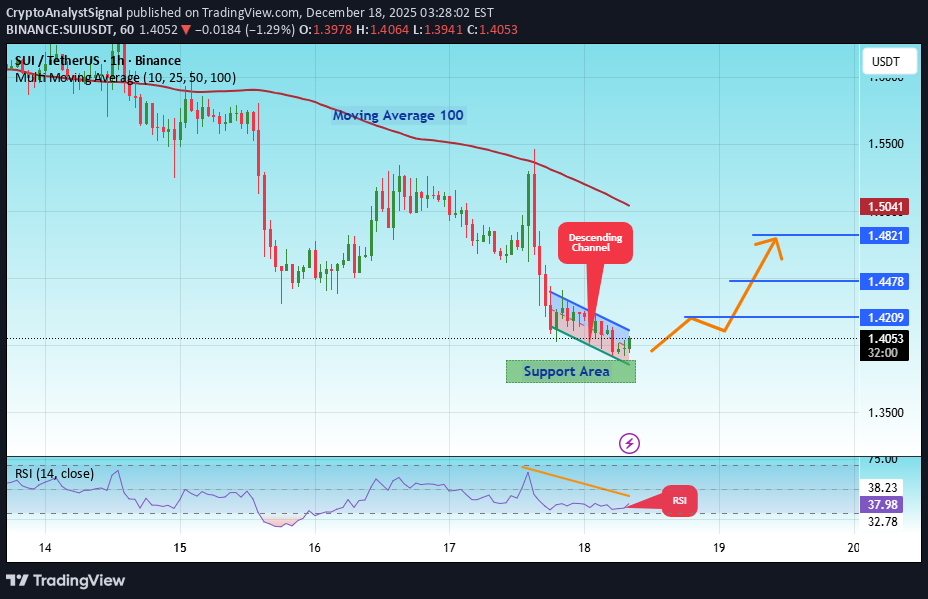
#SUI The price is moving in a descending channel on the 1-hour timeframe. It has reached the lower boundary and is heading towards breaking above it, with a retest of the upper boundary expected. We have a downtrend on the RSI indicator, which has reached near the lower boundary, and an upward rebound is expected. There is a key support zone in green at 1.38. The price has bounced from this zone multiple times and is expected to bounce again. We have a trend towards consolidation above the 100-period moving average, as we are moving close to it, which supports the upward movement. Entry price: 1.40 First target: 1.42 Second target: 1.44 Third target: 1.48 Don't forget a simple principle: money management. Place your stop-loss below the support zone in green. For any questions, please leave a comment. Thank you.#SUI First target: 1.42 Reached Second target: 1.44 Reached Third target: 1.48 Reached
Jos-ProTrader
SUIUSDT – Downward Channel | Bearish Continuation Setup
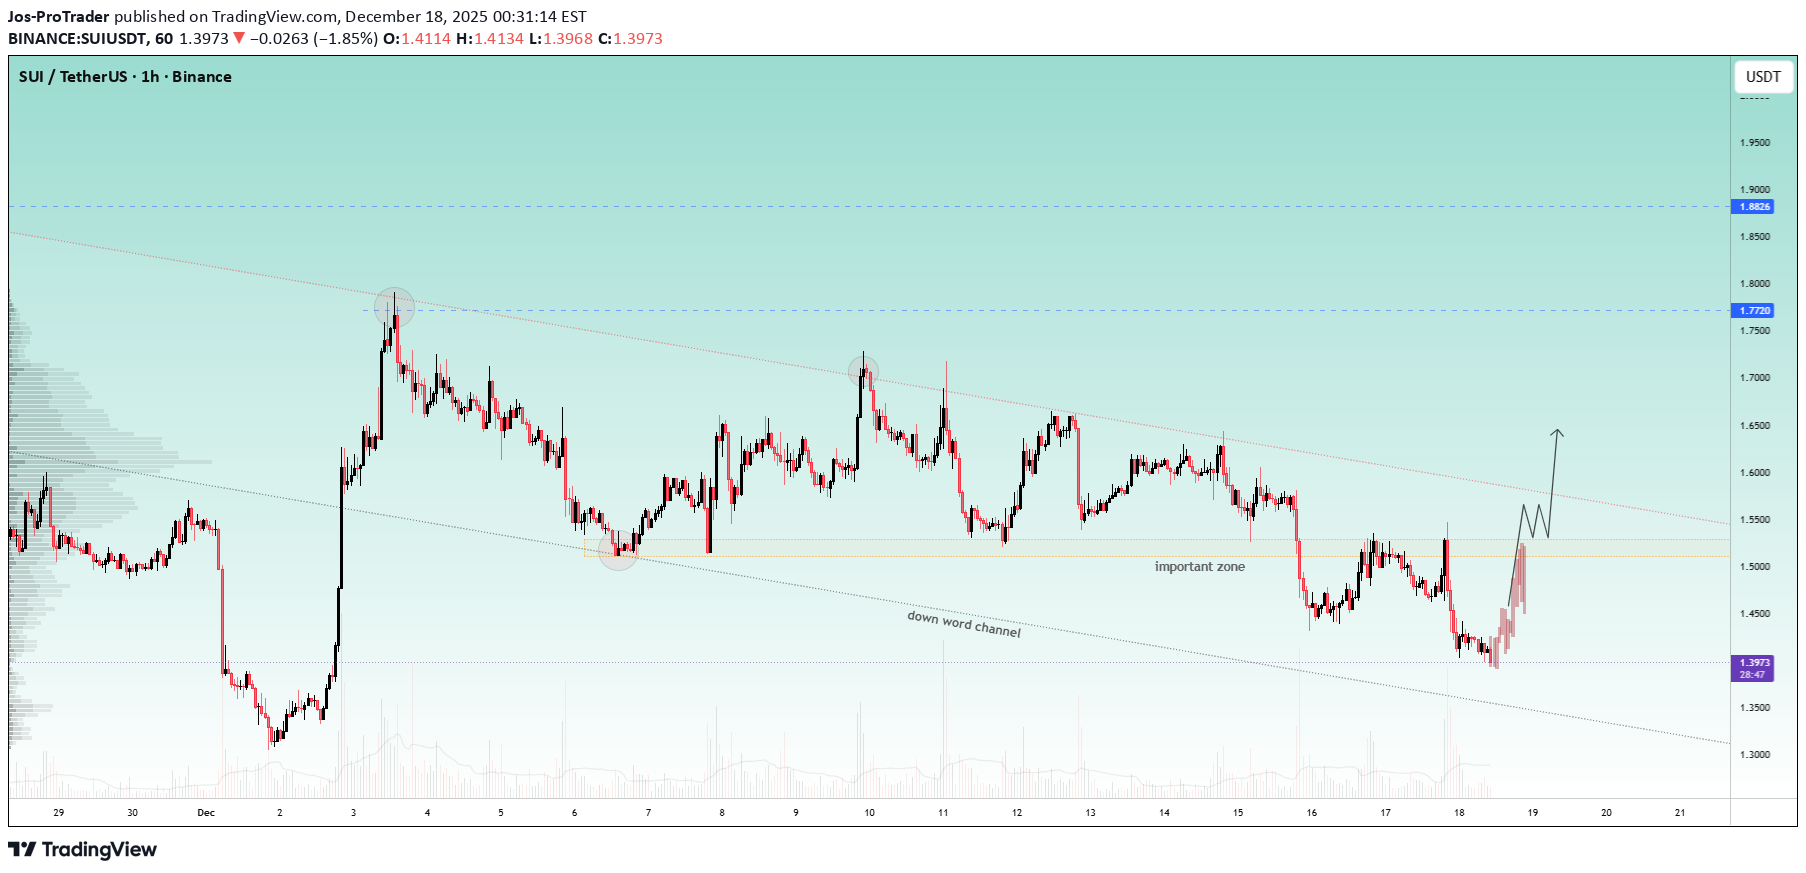
SUIUSDT is moving within a clear downward channel, and bearish momentum continues to drive price lower. As long as price stays under channel resistance, sellers remain in control and downside continuation is expected. Technical Outlook • Strong downward channel structure • Lower highs confirming bearish pressure • Expecting continuation toward downside targets Targets Levels TP1: 1.7720 TP2: 1.8826 If price breaks above channel resistance, bearish structure may weaken, so manage risk accordingly. This analysis is for educational purposes only, not financial advice. Like, comment and follow for more Smart Money and Price Action setups.

CRYPTOMOJO_TA
نقطه عطف حیاتی SUI: آیا اوج میگیرد یا سقوط میکند؟
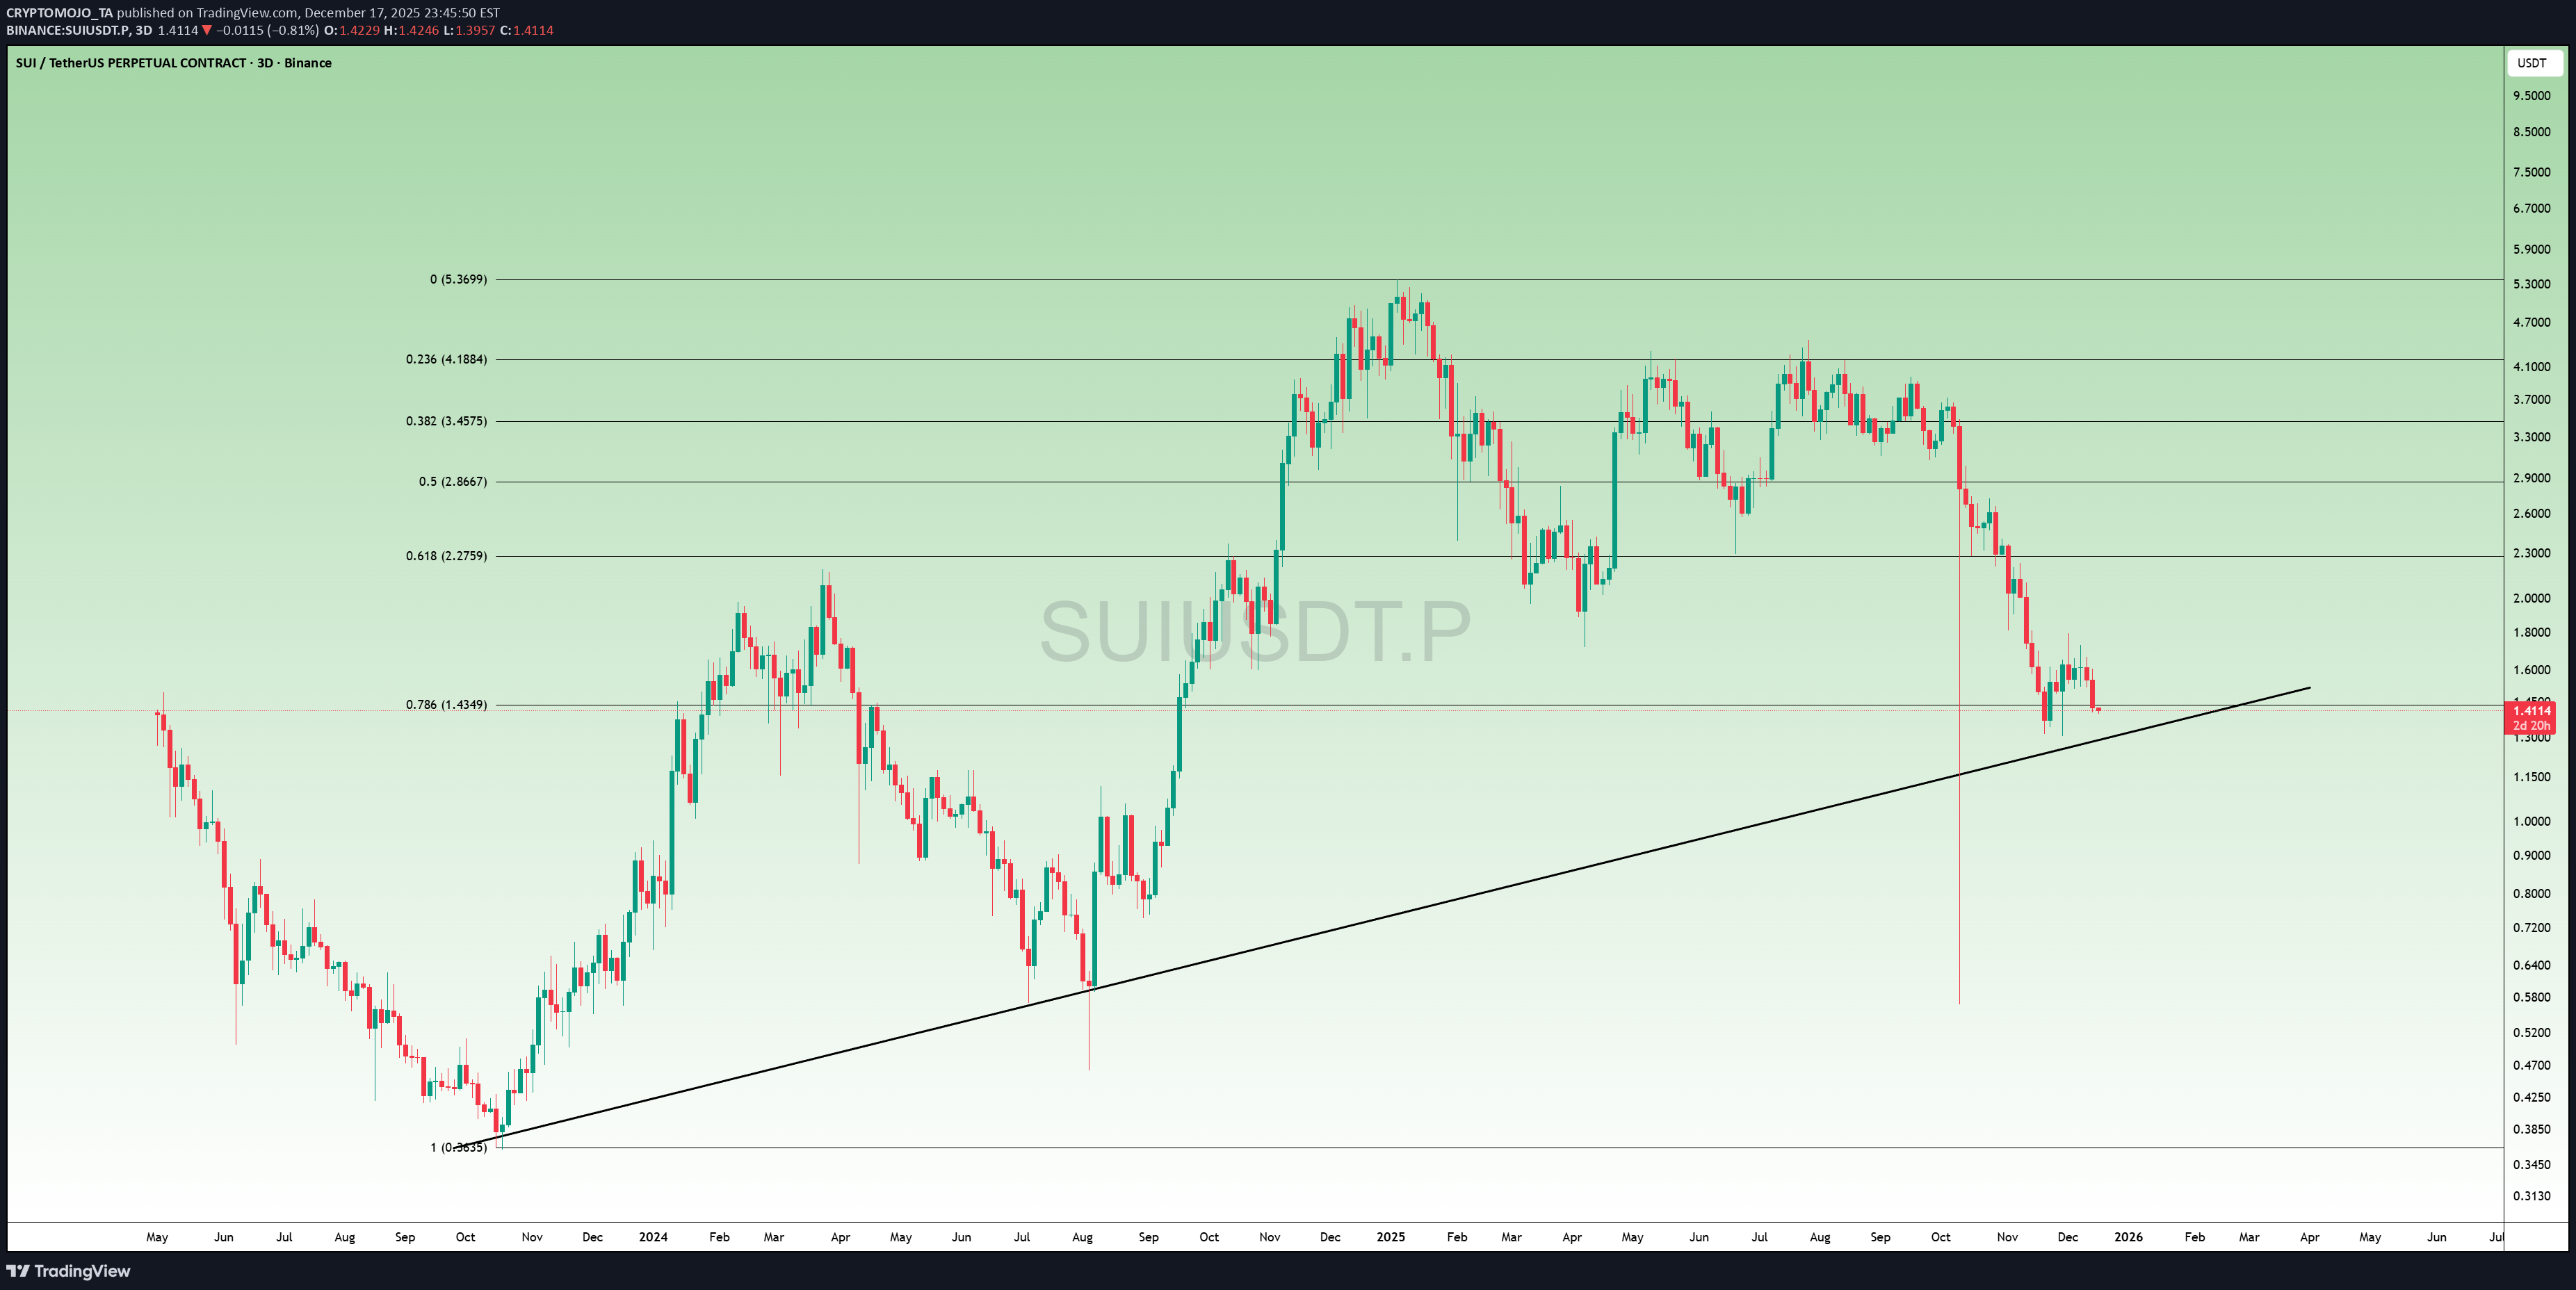
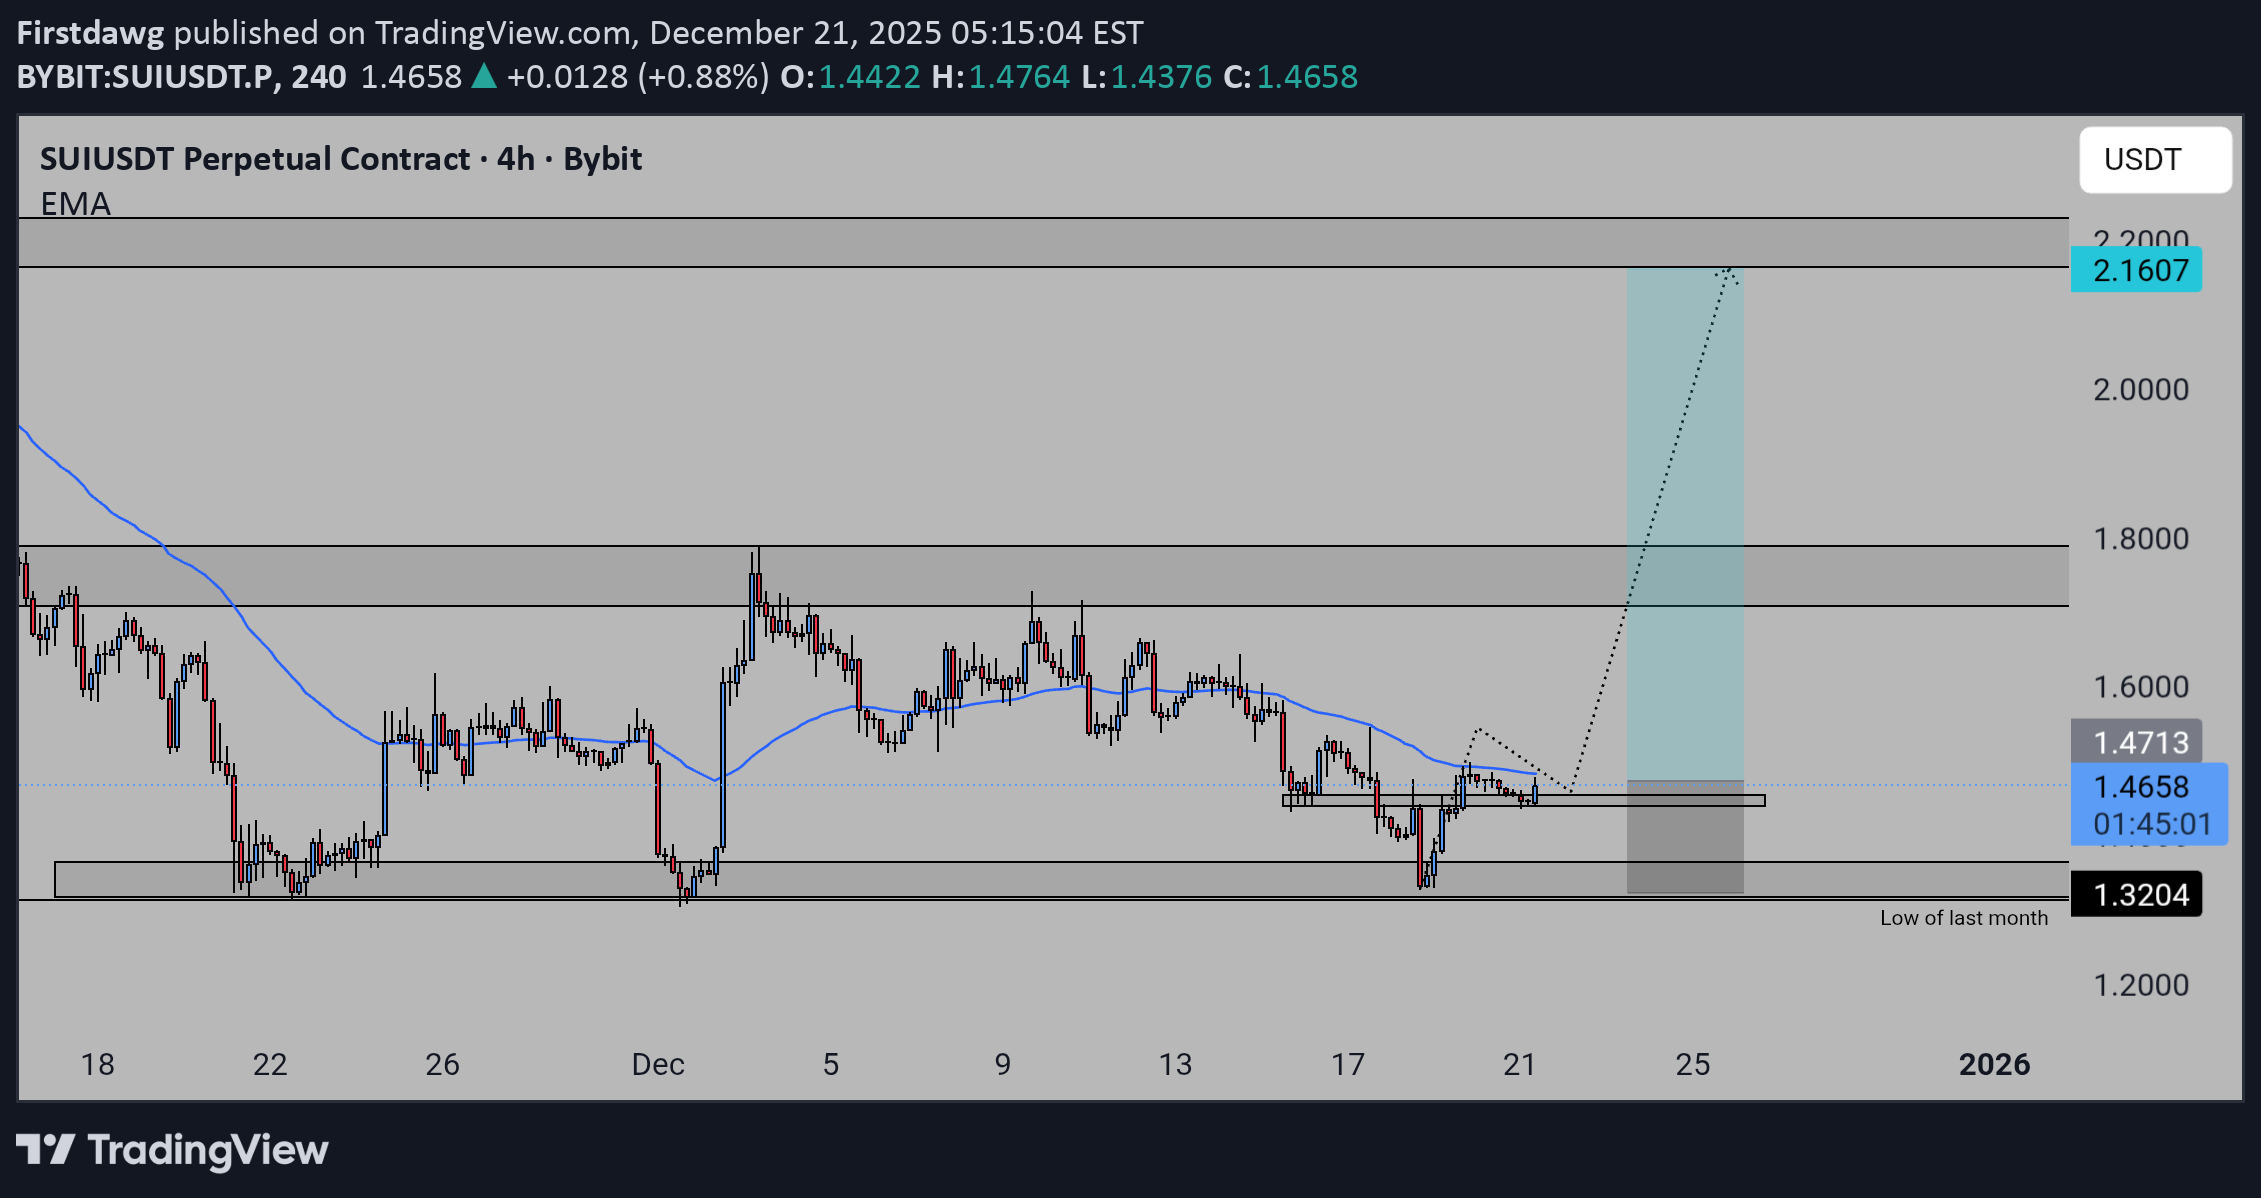
#SUI is now sitting on a major long-term trendline a level that has held since launch. 👀 Every time the price touched this trendline, SUI started a strong move up. We’re back here again… right at support + near the 0.786 Fib zone. If buyers step in, a bounce toward $2.2 → $2.8 is the next key target. If this level breaks, only then do we look lower. Big moment for SUI. Stay alert. #Crypto

minno91
SUI - Catching a Falling Knife
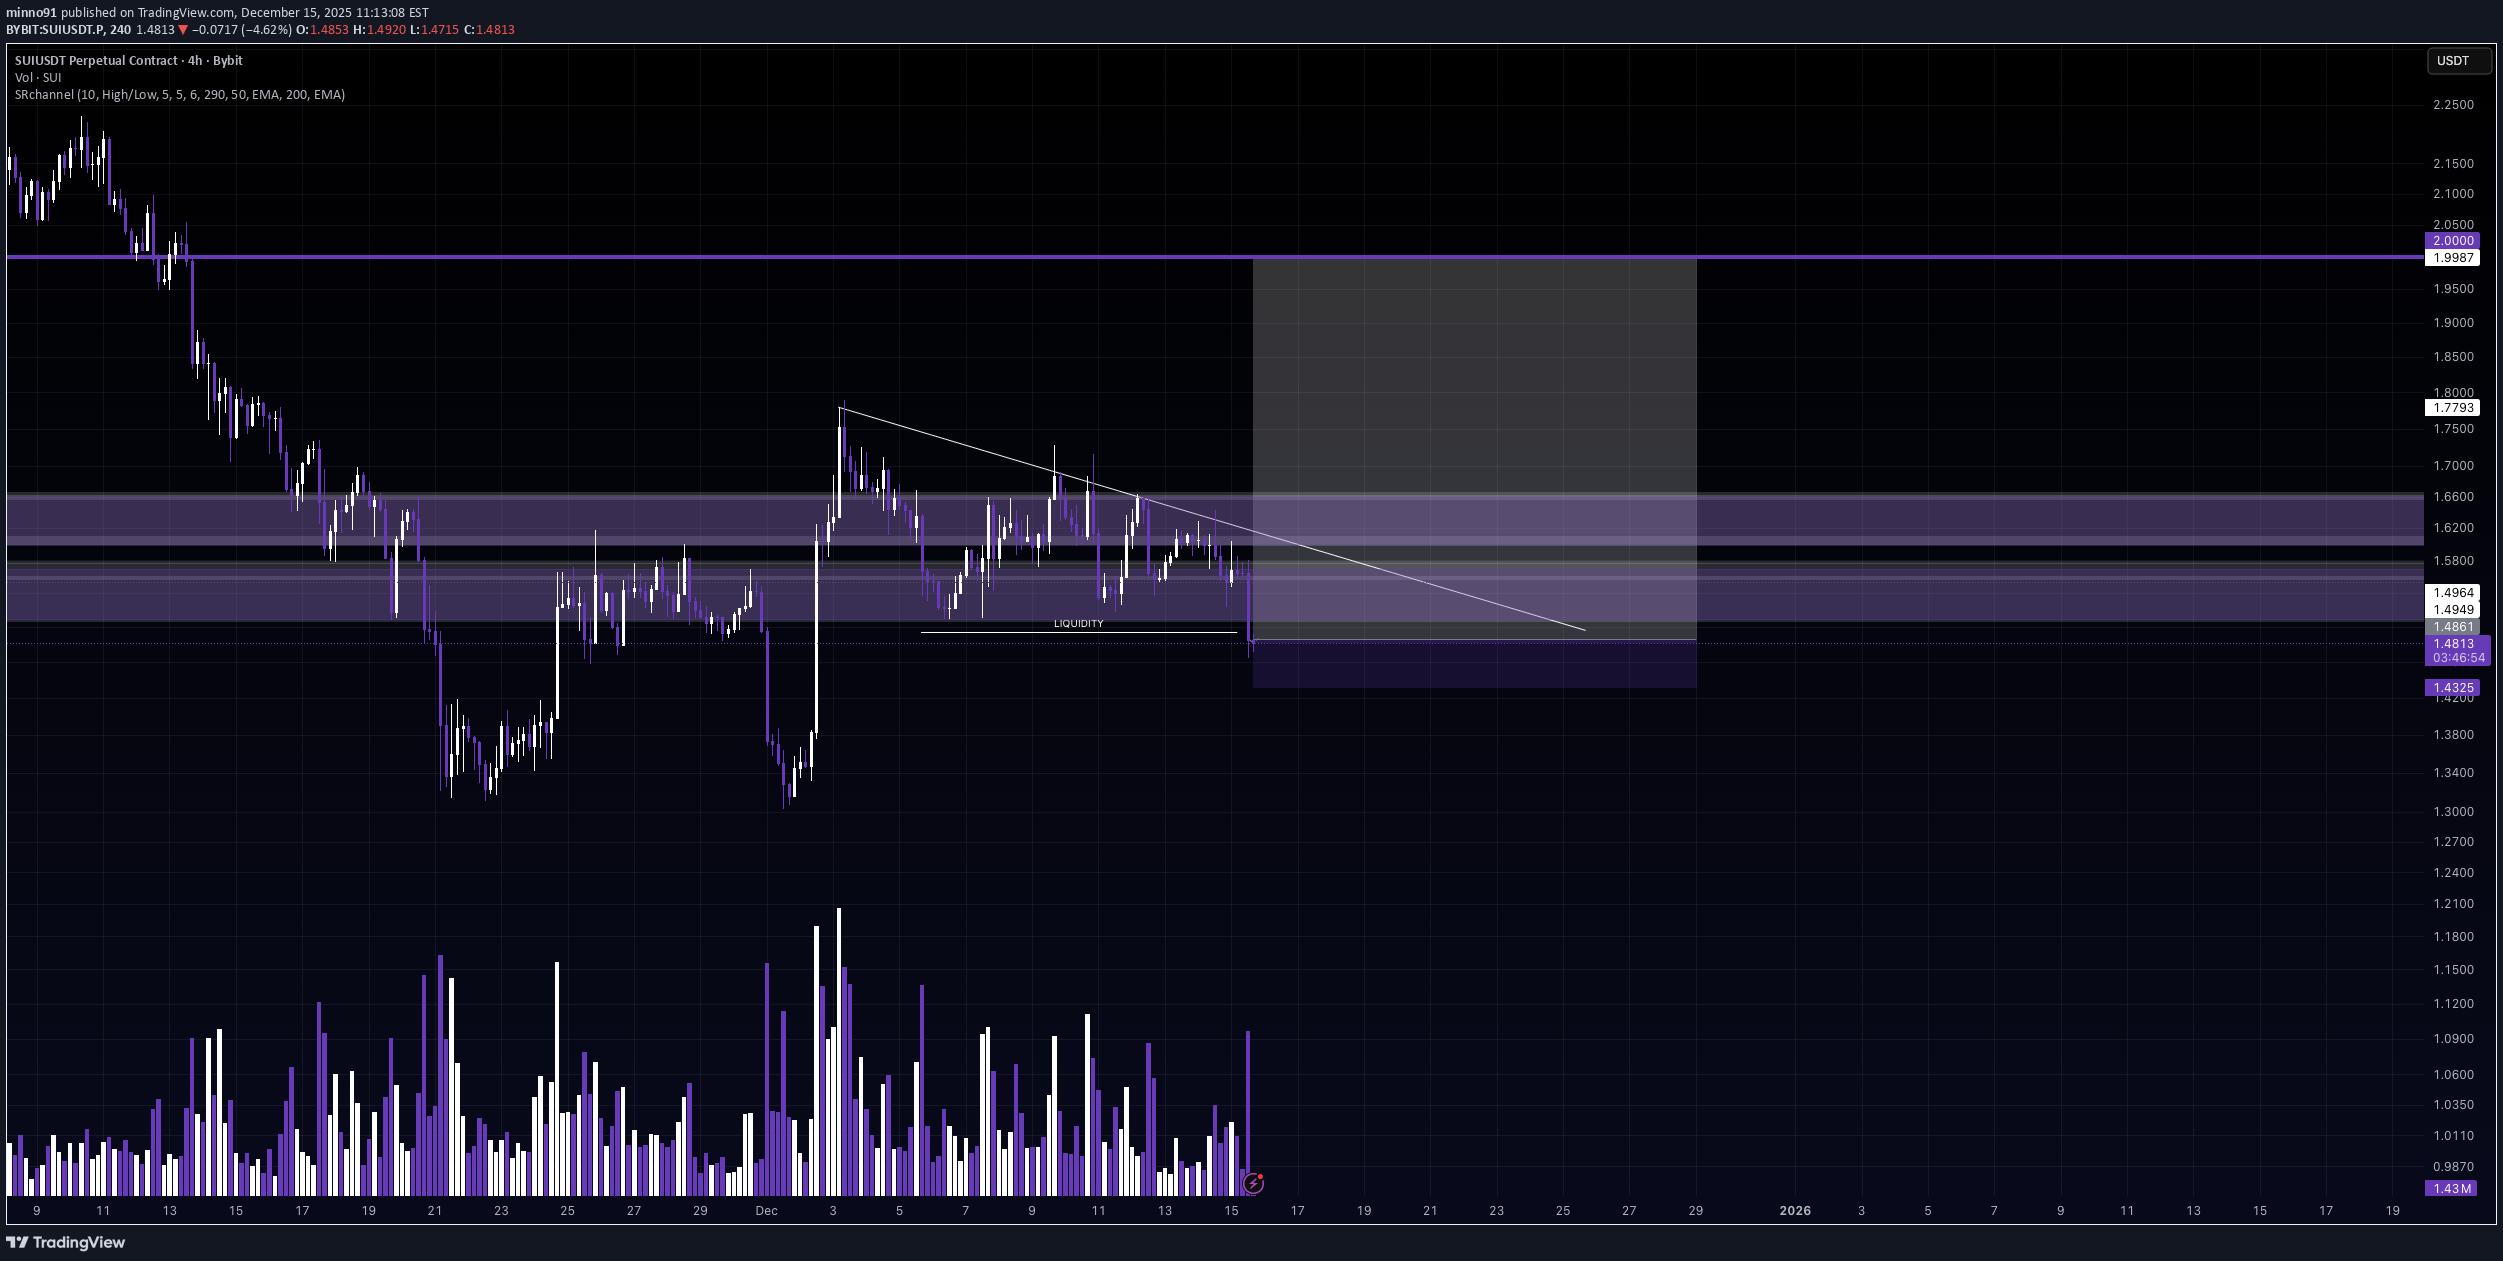
Alright traders, we’re clearly seeing a selloff today… BUT — and this is very scientific — I just don’t feel it. 😄 Somewhere deep inside my trader soul, I still smell a little Santa rally coming for the whole crypto market. Either that… or Trump tweets something weird, and we’re all instantly screwed. 50/50. 🎅💥😂 Now about SUI: Yes, this is technically a falling knife situation. Yes, that sounds scary. But honestly? The probabilities here are not that bad. Why I’m taking it: •liquidity was already taken below •we had a nice upward move a few days back •continuation is still possible •and this whole drop kinda smells like pre-macro manipulation So yeah — this is a swing trade, BUT with a tight stop loss, because I like excitement, not account destruction. 😄 Could this fail? Absolutely. Could it work beautifully? Also yes. That’s crypto. Let’s see how this plays out. Good luck traders — and may the knife stop falling right where we catch it 🔪📈😄
Disclaimer
Any content and materials included in Sahmeto's website and official communication channels are a compilation of personal opinions and analyses and are not binding. They do not constitute any recommendation for buying, selling, entering or exiting the stock market and cryptocurrency market. Also, all news and analyses included in the website and channels are merely republished information from official and unofficial domestic and foreign sources, and it is obvious that users of the said content are responsible for following up and ensuring the authenticity and accuracy of the materials. Therefore, while disclaiming responsibility, it is declared that the responsibility for any decision-making, action, and potential profit and loss in the capital market and cryptocurrency market lies with the trader.