
Jos-ProTrader
@t_Jos-ProTrader

What symbols does the trader recommend buying?
Purchase History
پیام های تریدر
Filter
Jos-ProTrader
هشدار طلا: الگوی سر و شانه شکل گرفت! آماده شکست و ریزش سنگین شوید؟
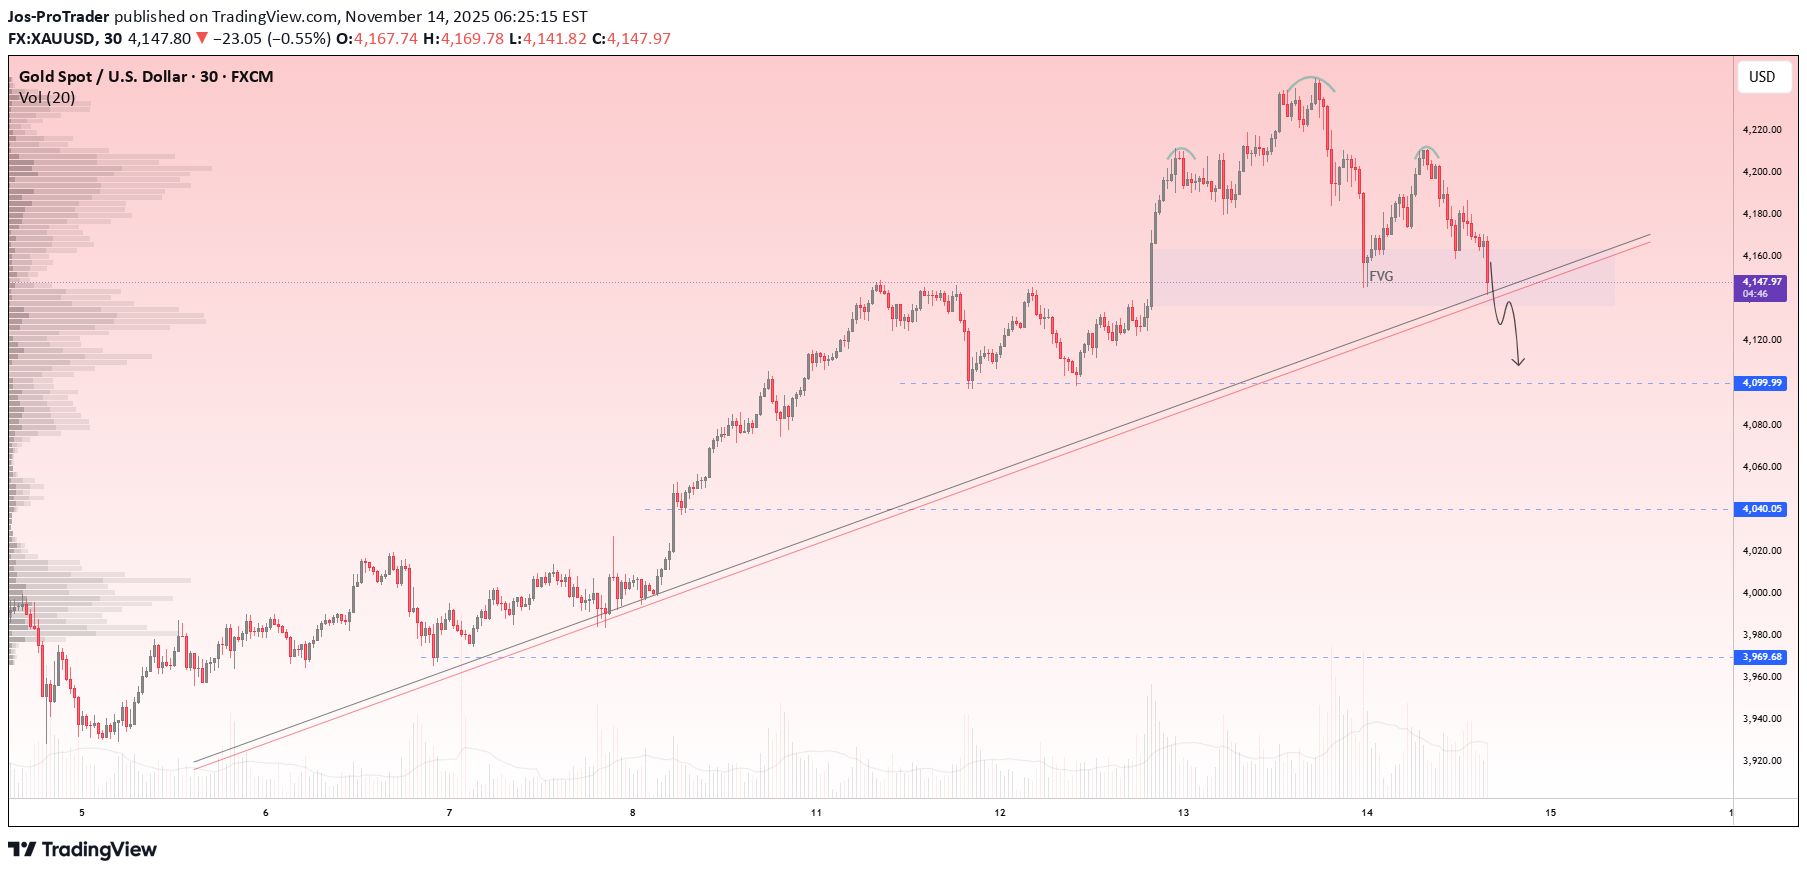
Gold has been trading within a strong bullish structure for several sessions, but the recent price action is now showing signs of potential exhaustion. The market is forming a clear head and shoulders pattern near the top of the range, which often signals a possible bearish reversal when confirmed by a neckline break. Price is currently reacting around the fair value gap region, showing a slowdown in bullish momentum. If the neckline is broken with a solid bearish candle, this would confirm the shift in market structure and open the way for deeper downside movement. The ascending trendline has also been tested multiple times, and a clean breakdown below both the trendline and the neckline would strengthen the bearish bias. Volume behavior suggests distribution as buyers lose control and sellers begin to step in. Traders should watch the neckline area closely. A confirmed breakdown followed by a retest would provide a more reliable entry for continuation to lower support levels. Until the neckline is broken, the pattern remains incomplete, so patience is important to avoid premature entries. Technical Target Levels First Target: 4099 Second Target: 4040 Third Target: 3969 If the breakdown plays out, gold could transition into a short-term bearish phase before any potential recovery. Manage risk carefully and avoid entries without confirmation. This analysis is for educational purposes only and not financial advice. Trade based on your own plan and apply proper risk management. 💬 Like, comment, and follow for more Smart Money and Price Action-based trade ideas.XAUUSD Trade Update TP1 has been successfully hit. Price touched 4085, delivering 650 pips of running profit. This move reflects the power of clear structure analysis, patience, and disciplined execution. Gold respected the technical levels perfectly and reacted strongly from the expected zone, confirming the bearish setup and continuing to follow the projected direction. As long as price holds below the broken structure, further continuation toward the next targets remains possible. Risk management and discipline remain the key focus moving forward. Congratulations to all traders who followed the plan. More updates will be provided as the market develops.
Jos-ProTrader
سیگنال صعودی اپل (AAPL): آمادگی برای شکست کانال صعودی و اوجگیری جدید!
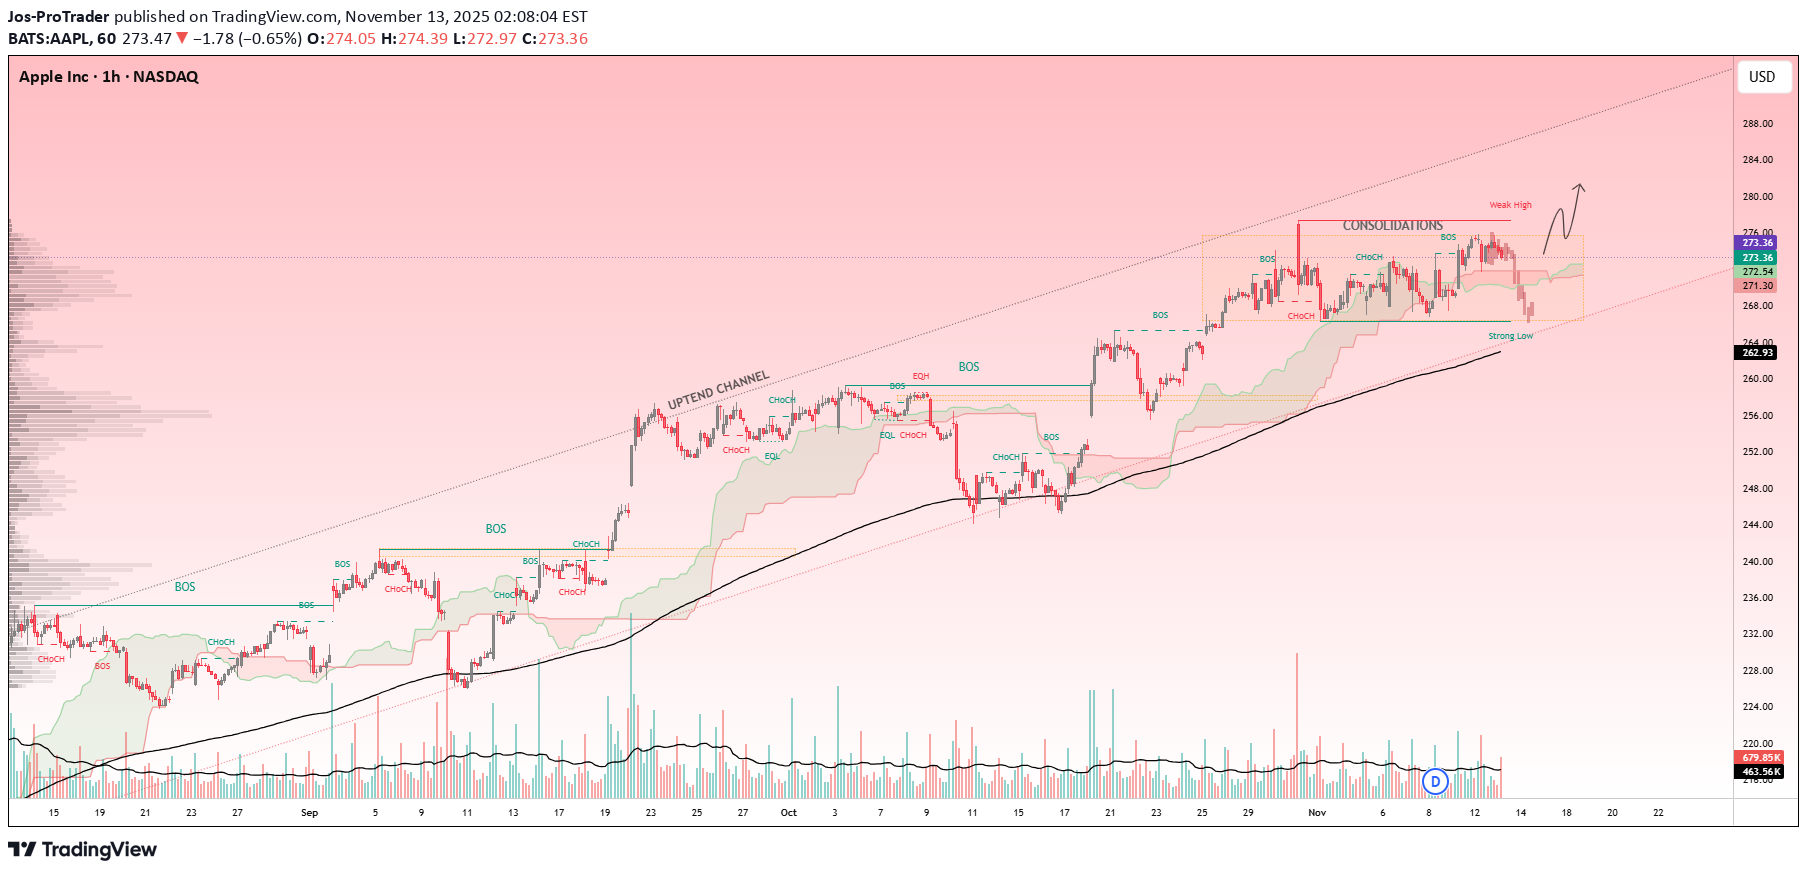
Apple Inc. has been moving within a well-defined uptrend channel, showing consistent bullish structure with higher highs and higher lows. After an impressive bullish run, price has entered a consolidation phase within the upper zone of the channel, suggesting a potential accumulation before the next impulsive move. Currently, the price is holding above the strong low zone and respecting the dynamic support levels provided by the channel trendline and the 200 EMA. This area has acted as a reliable support during previous pullbacks, showing strong buyer presence each time price revisits it. The consolidation phase near the channel’s mid to upper boundary signals that the market is pausing before possibly resuming its bullish momentum. Once the price breaks out of this consolidation zone with a decisive bullish candle, the next leg up is likely to follow, targeting the upper boundary of the trend channel. From a technical perspective, the structure remains strongly bullish as long as price holds above the 262–265 support range. A breakout above the consolidation area would confirm continuation of the prevailing uptrend and could trigger further buying interest from investors. Technical Target Levels First Target: 275.00 Second Target: 282.00 Third Target: 288.00 As long as the structure remains intact, the trend bias is bullish. Traders can watch for a clean breakout followed by a retest of the consolidation zone for potential entry confirmation. This analysis is for educational purposes only and not financial advice. Always trade according to your own plan and apply strict risk management. 💬 Like, comment, and follow for more Smart Money and Price Action-based trade ideas.
Jos-ProTrader
فروپاشی طلا (XAUUSD) تایید شد: پایان صعود با الگوی سقف دوقلو و هدف جدید نزولی!
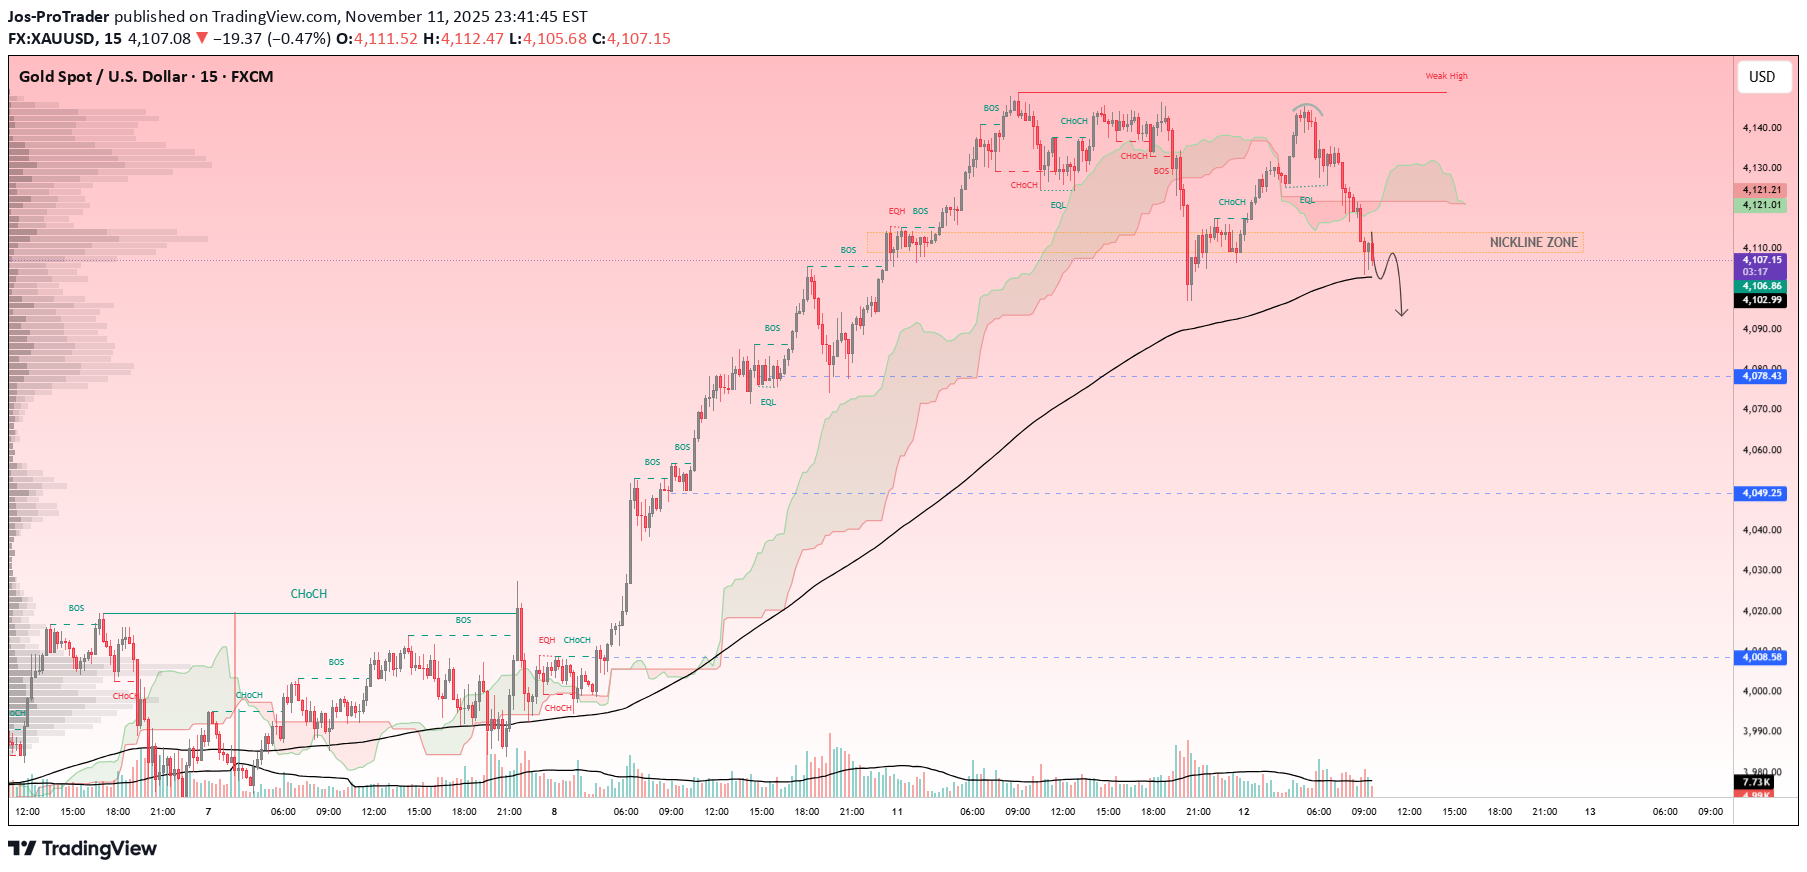
XAUUSD has completed a textbook double top pattern on the 15-minute chart, with the neckline zone at 4,080–4,085 giving way to a strong bearish displacement candle that swept liquidity and confirmed the reversal. The prior uptrend from the 4,000 equilibrium has now shifted, as sellers dominate with multiple breaks of structure to the downside. The breakdown was preceded by a weak high at 4,140, followed by a failed retest of the neckline where the zone flipped to supply. Price has since accelerated lower, forming lower highs and absorbing buy-side stops below the pattern base. Volume spiked on the bearish candle, while upside wicks remain shallow, reinforcing distribution and the transition from accumulation to markdown. Current consolidation is occurring directly beneath the broken neckline, now acting as overhead resistance. As long as price fails to reclaim 4,085 on a closing basis, the path of least resistance remains downward toward the measured move objective. The bearish bias holds firm with the neckline breach intact. A clean close above 4,085 would invalidate the pattern and target a retest of the double top highs. Technical Target Levels First Target: 4,078 Second Target: 4,049 Third Target: 4,008 Traders should monitor retests of the 4,080–4,085 supply zone for short continuations, using 5-minute confirmation via fair value gaps or engulfing patterns. Risk above the neckline ensures tight control, with partial scaling at each target to capture the full extension. This analysis is based purely on price action and structural behavior. It demonstrates the reliability of double top breakdowns when confirmed by volume and candle displacement at key levels. This is not financial advice. Always use proper risk management and follow your trading plan. Like, comment and follow for more Smart Money and Price Action-based trade ideas.trade is not activeted cancelled
Jos-ProTrader
سواپ قوی SUI/USDT: شکست مثلث صعودی و هدفهای جدید قیمتی!

SUIUSDT has completed a multi-week consolidation phase within a symmetrical triangle pattern on the 2-hour chart, with the decisive breakout above the upper resistance line near 2.2300 marking the resumption of the prior bullish trend that originated from the October swing low. This breakout has swept equal highs and flipped the local structure, confirming a change of character to the upside. The triangle apex aligned with a key equilibrium zone around 2.1500–2.1800, which previously acted as both support and resistance during the compression phase. Price has now closed convincingly above this level on expanding volume, with subsequent retests showing buyer absorption and higher lows forming on lower timeframes. The broken resistance line is expected to transition into dynamic support on any pullback, reinforcing the validity of the move. From a market structure perspective, the breakout has produced a series of breaks of structure to the upside, with the most recent strong high at 2.2669 serving as the new reference point. The pair is trading above the point of control of the triangle range, indicating a shift in order flow from distribution to expansion. As long as price respects the 2.2300 former resistance (now support), the path of least resistance remains higher. The bullish bias remains intact provided there is no clean 2-hour close below 2.2000, which would re-enter the triangle and delay the expansion phase. A sustained move above 2.3000 would confirm acceleration toward the measured move objective. Technical Target Levels First Target: 2.4000 Second Target: 2.6500 Third Target: 2.9000 Traders should monitor pullbacks to the 2.2300–2.2500 zone for high-confluence long entries, ideally with confirmation via a 15-minute fair value gap or displacement candle. Risk can be placed below the triangle support trendline, targeting progressive profit levels for a structured risk-to-reward progression. This analysis is based purely on price action and structural behavior. It highlights the importance of triangle breakouts as high-probability continuation signals when aligned with prior trend and order flow confirmation. This is not financial advice. Always use proper risk management and follow your trading plan. Like, comment and follow for more Smart Money and Price Action-based trade ideas.
Jos-ProTrader
سولانا (SOL) شکست مهم: ساختار صعودی قوی تایید شد و اهداف جدید در راه است!
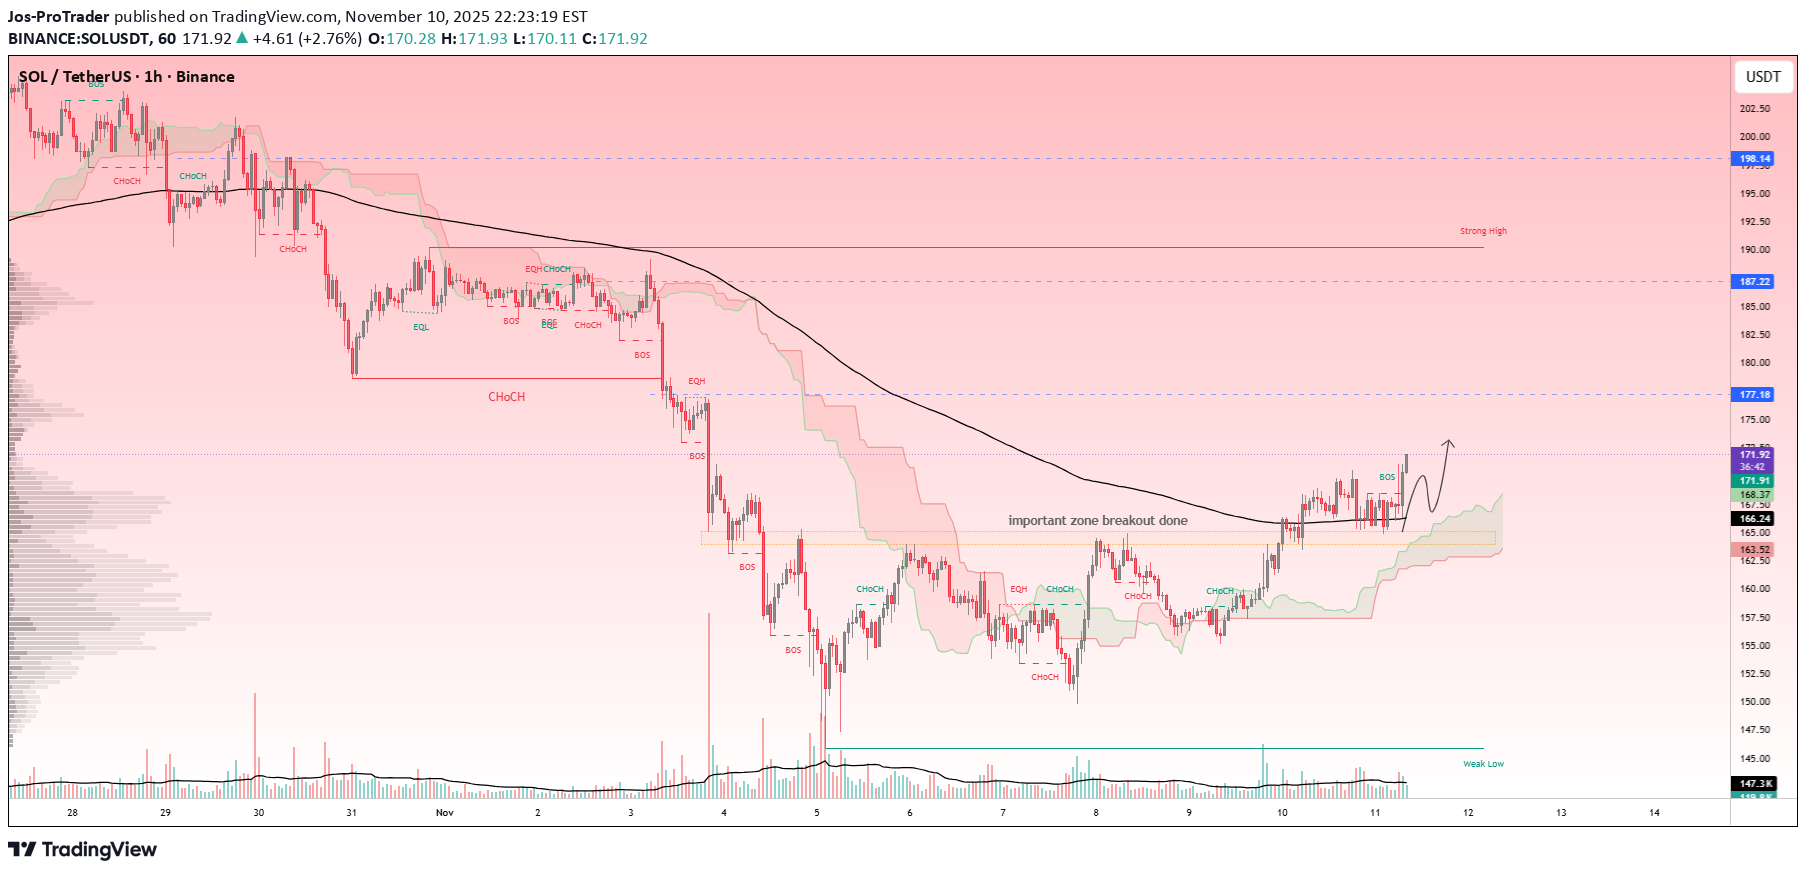
SOLUSDT has maintained a resilient bullish framework on higher timeframes, with the recent consolidation and subsequent breakout from the important zone marking a pivotal shift in order flow. The pair, which had been respecting a descending channel since mid-October, has now decisively broken above the upper boundary near 170.00, invalidating prior bearish attempts and signaling renewed accumulation by buyers. On the 1-hour chart, the breakout is supported by multiple breaks of structure to the upside, including a confirmed change of character above the equilibrium level at 170.00. This move has swept liquidity from the equal highs and formed a new strong high, with price action now trading above the prior supply zone that capped advances earlier in the week. The weak low at 146.00 has held as key support, aligning with the 0.618 Fibonacci retracement from the October swing low and providing confluence for the bullish reversal. From a market structure perspective, higher highs and higher lows are reestablishing on lower timeframes, with increasing volume on upward displacements indicating sustained buyer commitment. The pair's position above the point of control from the recent range further reinforces seller exhaustion and potential for expansion higher. As long as price holds above the 170.00 equilibrium, the path of least resistance favors continuation toward measured targets. The bullish bias remains valid provided there is no clean breakdown below 168.00, which would retest the broken channel boundary and potentially delay the upmove. A decisive close above 175.00 would confirm acceleration and target the next structural highs. Technical Target Levels First Target: 177.50 Second Target: 187.00 Third Target: 198.00 Traders should seek entries on pullbacks to the 170.00–172.00 zone, ideally with bullish confirmation on the 15-minute chart such as a fair value gap fill or displacement candle. Stops can be placed below the recent weak low for controlled risk, targeting progressive profits at each level for an optimal risk-to-reward profile. This analysis is based purely on price action and structural behavior. It underscores the significance of zone breakouts in transitioning from consolidation to trend resumption and the need to monitor for order flow confirmation. This is not financial advice. Always use proper risk management and follow your trading plan. Like, comment and follow for more Smart Money and Price Action-based trade ideas.
Jos-ProTrader
بیت کوین: ساختار صعودی دستنخورده؛ فرصت خرید در منطقه کلیدی تعادل!
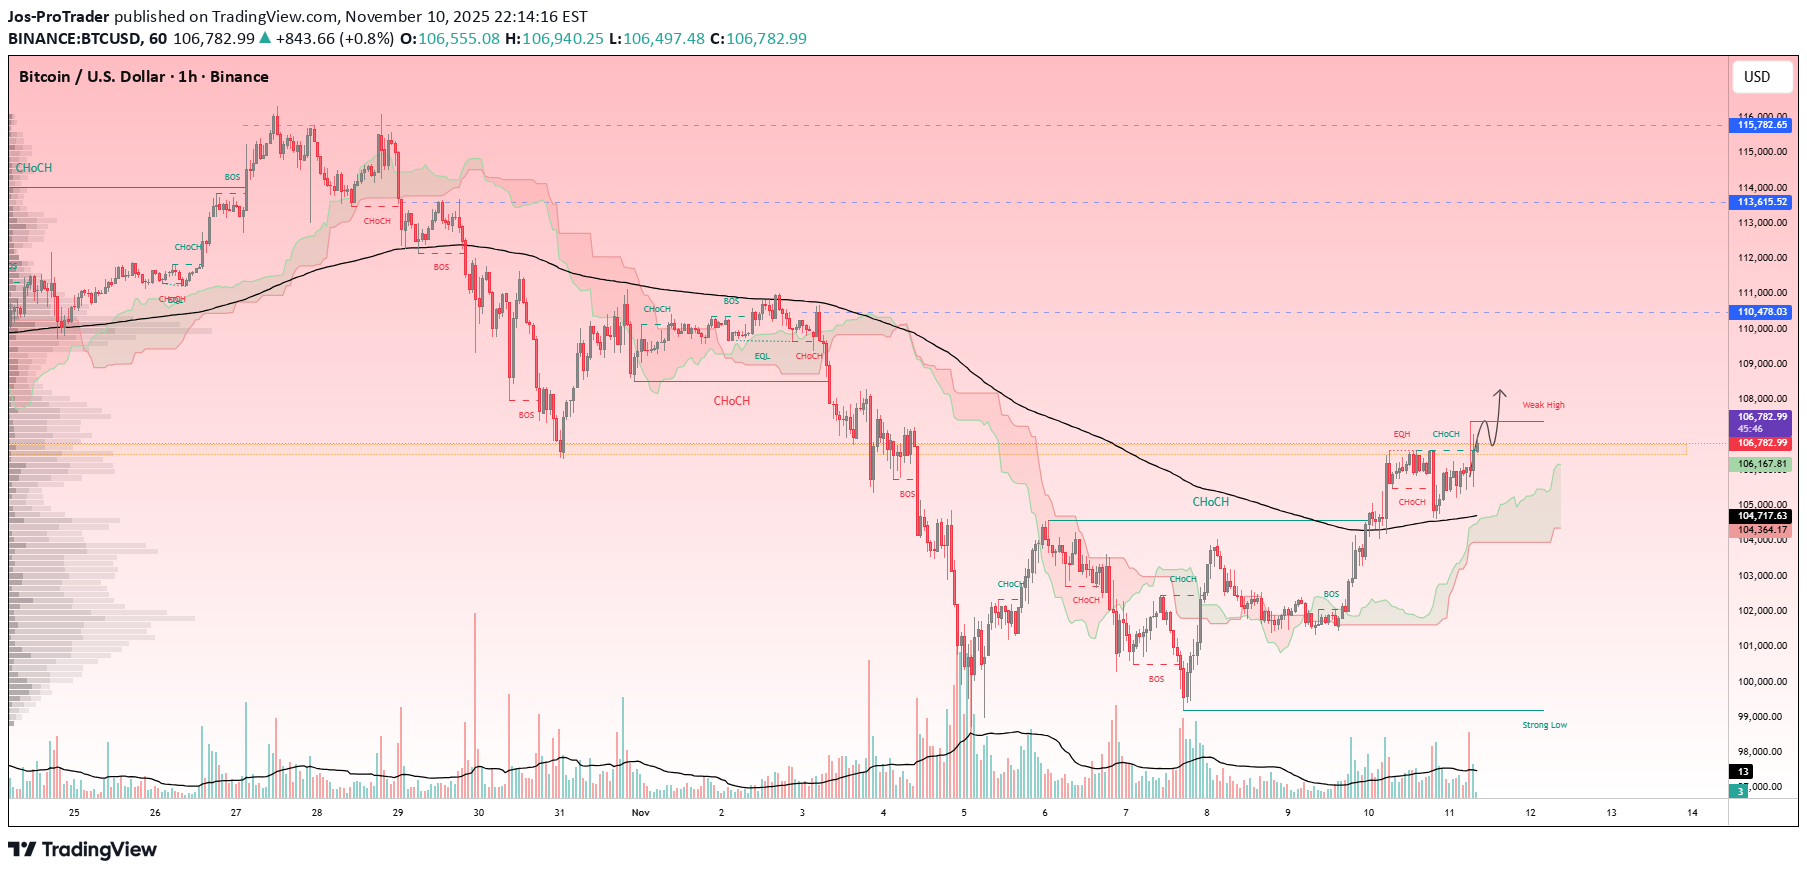
BTCUSD continues to exhibit a robust bullish structure on higher timeframes, with the recent pullback on the 1-hour chart representing a healthy retracement within the broader uptrend that began from the October lows. The pair has maintained a series of higher highs and higher lows on the daily chart, supported by increasing institutional inflows and a favorable macroeconomic environment, including potential rate cuts from the Federal Reserve. On the 1-hour timeframe, the downside move has respected key structural elements without invalidating the overall bullish bias. The break below the prior strong low at 106,167 initially suggested a potential change of character; however, this level has now transitioned into a critical equilibrium zone, where buyers are expected to defend aggressively. Current price action is consolidating above the 104,700–105,000 demand zone, which aligns with the 0.618 Fibonacci retracement from the recent swing low to high and coincides with prior liquidity pools. This area has held as support multiple times, reinforcing its significance. From a market structure perspective, the pullback has formed a series of internal higher lows on lower timeframes, indicating that sellers are losing steam and that order flow is shifting back toward buyers. Volume analysis reveals higher participation on the rebound attempts compared to the downside impulses, further confirming accumulating strength. As long as price holds above the 104,700 demand zone, the path of least resistance points upward, with potential for a retest of the 108,000 equilibrium high. The bullish bias remains valid provided there is no clean breakdown below 104,500, which would shift the structure toward a deeper correction. A decisive close above 106,900 would confirm renewed momentum and target the prior highs. Technical Target Levels First Target: 110,450 Second Target: 113,600 Third Target: 115,800 Traders should look for confluence around the 105,000–105,500 area for long entries, ideally on a successful retest of the demand zone with bullish displacement on the 15-minute chart. Stops can be placed below the recent low for optimal risk management, aiming for a favorable risk-to-reward ratio at the measured targets. This analysis is based purely on price action and structural behavior. It emphasizes the importance of viewing pullbacks as opportunities within established trends and monitoring for confirmation of order flow shifts. This is not financial advice. Always use proper risk management and follow your trading plan. Like, comment and follow for more Smart Money and Price Action-based trade ideas.
Jos-ProTrader
روند صعودی اتریوم ادامه دارد: آیا ETH تا ۳۹۱۶ دلار پیشروی میکند؟
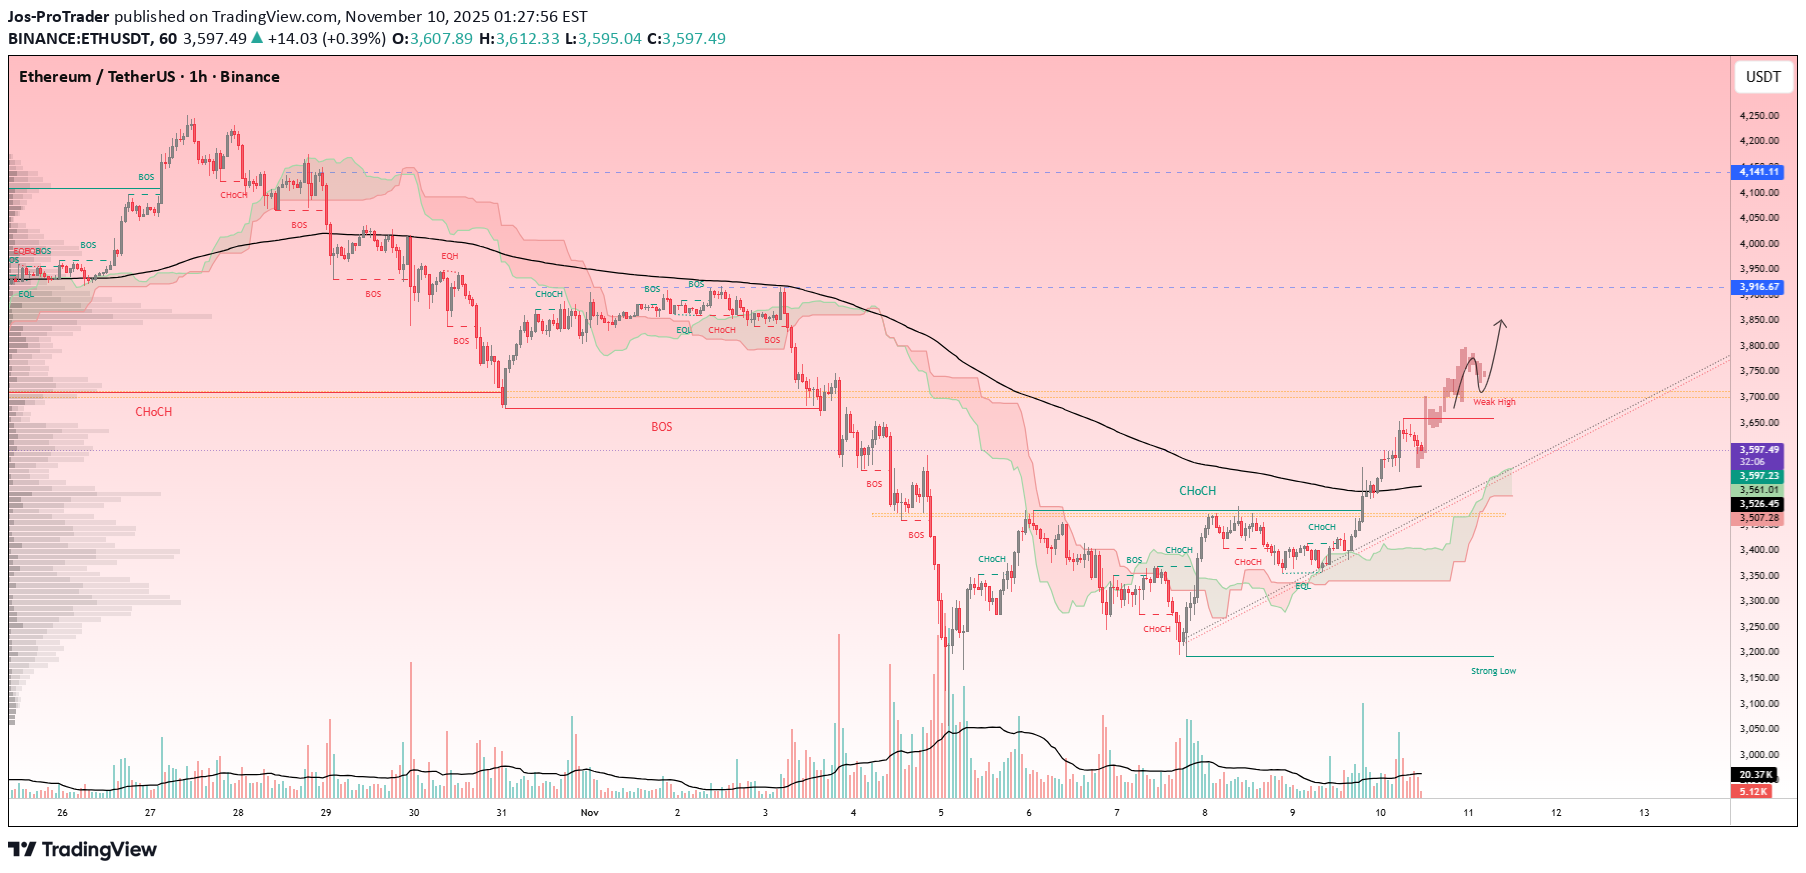
Ethereum is showing strong bullish momentum after reclaiming key structural levels. The price has respected the ascending trendline, confirming buyer strength and higher-lows formation on the 1H timeframe. Currently, ETHUSDT is consolidating near a short-term resistance zone, and a breakout above this area could trigger another impulsive bullish leg toward the next resistance at **$3,916**. As long as price stays above the $3,600–$3,550 demand zone, the bullish bias remains valid. 🎯 Tachnically Target Levels: First Target: $3,774 Second Target: $3,916 Third Target: $4,148 A clean close below the trendline would weaken this bullish setup, so traders should wait for confirmation before entering new positions. 💬 Like, comment & follow for more Smart Money and Price Action-based trade ideas.
Jos-ProTrader
تحلیل طلا (XAUUSD): ریزش قریبالوقوع پس از تشکیل الگوی سقف دوقلو!
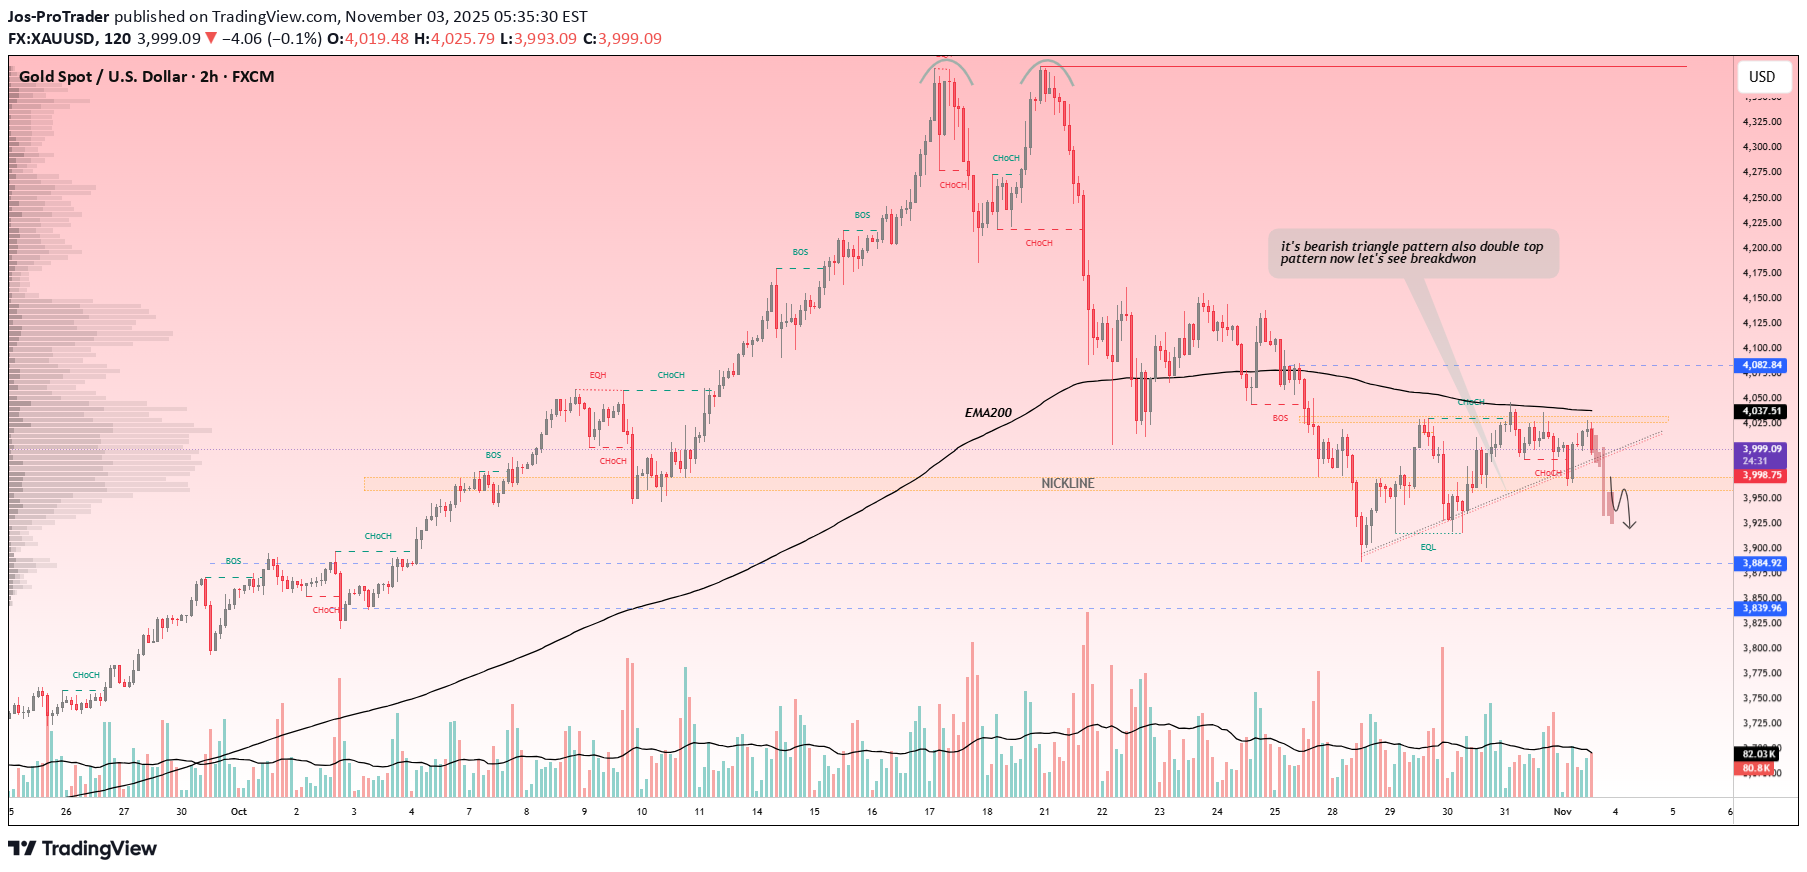
Gold (XAUUSD) has formed a clear double top structure on the 4H timeframe, signaling a potential bearish reversal. The neckline area around $3,990–$3,995 has been tested multiple times and now price is showing signs of breakdown with strong bearish momentum. On the lower timeframe (1H), a bearish triangle pattern has also developed — price has just broken below the structure with a strong bearish candle, confirming the continuation bias to the downside. The neckline zone now acts as resistance, and any retest with rejection could invite further selling pressure. 💡 As long as price remains below the neckline and EMA200, bearish momentum is expected to extend toward lower demand zones. 🎯 Technical Targets / Support Levels: First Target: $3,884 Second Target: $3,850 Third Target: $3,825 ⚠ Invalidation: A sustained close back above $4,025 would negate the bearish setup. 🚨 This is not financial advice. Always apply proper risk management and follow your trading plan. 💬 Like, comment & follow for more Smart Money & Price Action-based trade setups. 💎📉 XAUUSD – Breakdown Confirmed | Bearish Momentum Active Gold has confirmed a clean breakdown below the key support zone, signaling the continuation of bearish momentum. The market structure is now fully aligned to the downside, with sellers showing strong control after rejecting the retracement area. Price has broken below the neckline and is now holding under the zone, which may act as new resistance. As long as XAUUSD remains below this level, the bearish trend is expected to continue. 💡 Keep holding your positions while monitoring price action for potential retests of the breakdown zone — these may offer re-entry opportunities for continuation setups. 🎯 Technical Outlook: Bearish bias remains valid while price stays below 4,180–4,200. Next supports lie toward the 4,117 and 4,056 levels. 🚨 This is not financial advice. Always manage your risk and follow your plan. 💬 Like, comment & follow for more Smart Money and Price Action-based trade updates. 💎📉 XAUUSD Trade Update | SL Hit After Reversal Gold initially showed a proper breakdown setup with strong bearish confirmation candles, aligning perfectly with the technical structure. However, the market unexpectedly reversed with strong bullish momentum, triggering stop losses. This type of reversal is a normal part of trading — even the best setups can face temporary invalidation when liquidity shifts or major players step in. What’s important is discipline and consistent risk management. Every trade, win or loss, is part of the process that sharpens your edge. 💡 Lesson: Always protect capital first. The market will always give another opportunity. 💬 Like, comment & follow for more Smart Money and Price Action-based trade ideas. 💎
Jos-ProTrader
بیت کوین در آستانه انفجار قیمتی؟ الگوی مثلث صعودی و اهداف بزرگ بعدی!
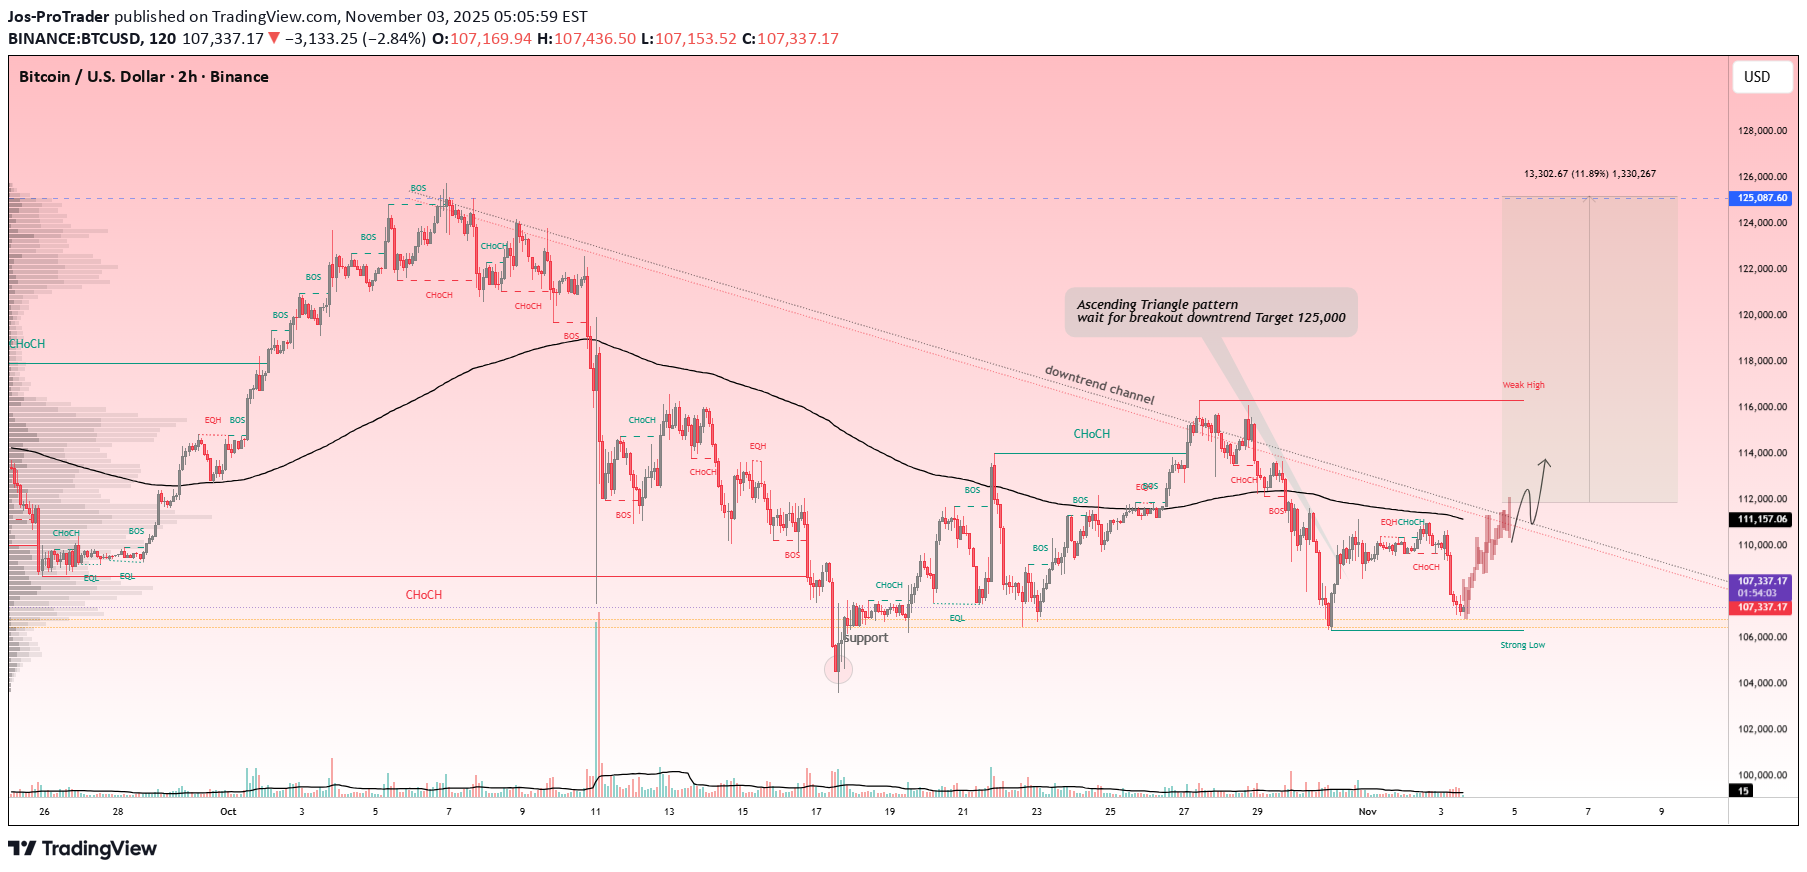
BTCUSD is currently forming a clean ascending triangle pattern, indicating a buildup of bullish momentum and potential breakout opportunity. Price has been forming higher lows while testing the horizontal resistance, showing that buyers are gradually gaining strength. Now, the market is approaching the downtrend line resistance, where a decisive breakout candle and close above the structure could confirm continuation toward higher targets. Volume remains stable, suggesting that accumulation is underway before the next expansion phase. 💡 If BTC successfully breaks above the resistance and holds on a retest, we could see a strong impulsive rally toward the next key resistance zone near 125,000. 🎯 Technical Target Levels / Resistance Zones: First Target: 120,000 Second Target: 122,800 Third Target: 125,000 As long as price holds above the ascending structure and maintains bullish momentum, the trend remains in favor of buyers. A strong bearish close below the triangle base would invalidate this setup. ⚠ Note : This is not financial advice. Always trade with discipline and apply proper risk management. 💬 Like, comment & follow for more professional Smart Money & Price Action-based trade ideas. 🚀
Jos-ProTrader
سقوط قریبالوقوع SUIUSDT؟ آمادهسازی برای ریزش بزرگ در الگوی مثلث نزولی!
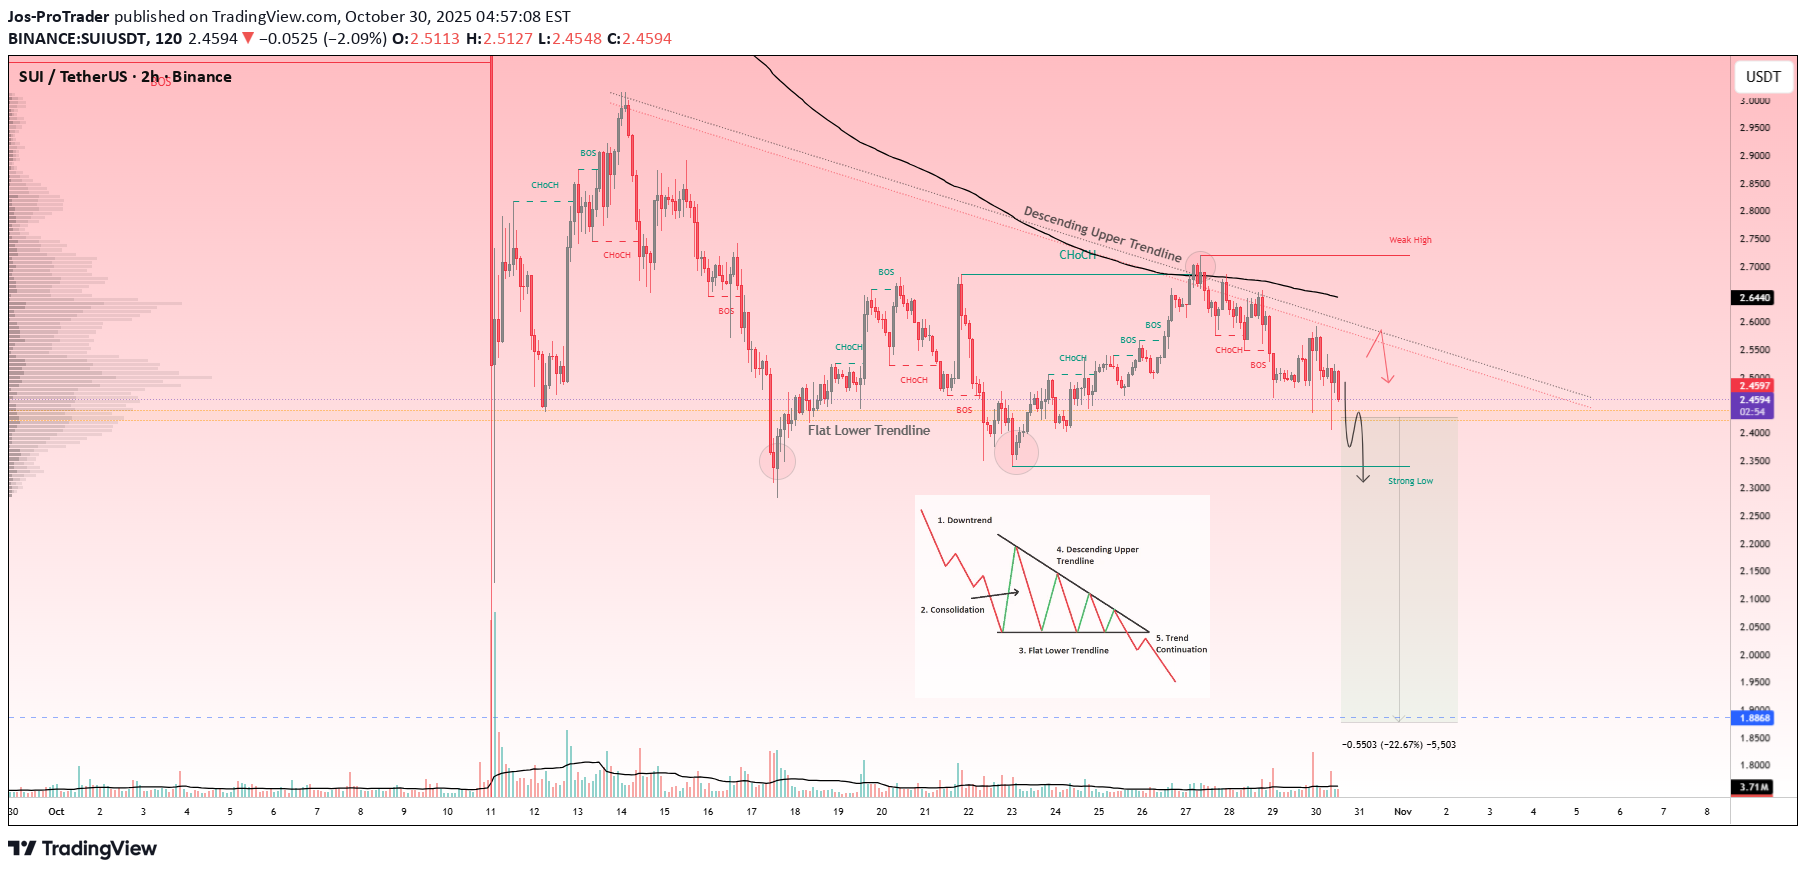
SUIUSDT is forming a clean descending triangle pattern, showing consistent lower highs and strong bearish pressure building near the flat lower trendline. This structure suggests sellers are gradually gaining control as buyers continue to lose momentum. We’re now waiting for a clear breakdown below the flat lower trendline to confirm bearish continuation. A strong bearish candle close below this zone will validate the setup and open the way for further downside movement. The market structure remains weak, and as long as price stays below the descending trendline resistance, the bias favors sellers. 🎯 T echnical Target Level: Target Point: 1.8868 If price breaks below the support level with confirmation, expect a sharp move toward the target zone. A strong bullish recovery above the upper trendline would invalidate this bearish pattern. 🚨 T his is not financial advice. Always trade with proper risk management and follow your trading plan. 💬 Like, comment & follow for more Smart Money and Price Action-based trade ideas . 💎📉 SUIUSDT – Breakdown Confirmed | Trade Active and 50% to Target SUIUSDT has successfully broken down from the descending triangle pattern, confirming bearish continuation as expected. The price action shows strong momentum from sellers, pushing the market lower and validating the bearish setup. Currently, the trade is running near 50% toward the target, showing clear continuation pressure after the breakdown. As long as price remains below the previous support zone, the bearish bias stays intact. The structure continues to form lower highs and lower lows, signaling that sellers are firmly in control. 🎯 Technical Target Level: Final Target: 1.8868 If price sustains below the breakdown zone, further downside toward the target level is expected. A sudden recovery above the broken support area would signal possible structure shift or retracement. 🚨 This is not financial advice. Always manage risk and follow your trading strategy. 💬 Like, comment & follow for more Smart Money and Price Action-based trade updates. 💎📉 SUIUSDT Trade Update | Target Fully Reached SUIUSDT has successfully reached the final target after a clean breakdown from the descending triangle pattern. The bearish momentum followed through exactly as expected, confirming the strength of the technical setup. Price respected the lower trendline breakout and continued to push downward, completing all projected targets with precision. 🎯 Targets Recap: * TP1: ✅ Hit * TP2: ✅ Hit * TP3: ✅ Fully Reached Excellent move overall — a perfect example of how patience and confirmation pay off in technical setups. Congratulations to everyone who followed the trade with proper risk management. 💬 Like, comment & follow for more Smart Money and Price Action-based trade updates. 💎
Disclaimer
Any content and materials included in Sahmeto's website and official communication channels are a compilation of personal opinions and analyses and are not binding. They do not constitute any recommendation for buying, selling, entering or exiting the stock market and cryptocurrency market. Also, all news and analyses included in the website and channels are merely republished information from official and unofficial domestic and foreign sources, and it is obvious that users of the said content are responsible for following up and ensuring the authenticity and accuracy of the materials. Therefore, while disclaiming responsibility, it is declared that the responsibility for any decision-making, action, and potential profit and loss in the capital market and cryptocurrency market lies with the trader.