
STX
Stacks
| تریدر | نوع سیگنال | حد سود/ضرر | زمان انتشار | مشاهده پیام |
|---|---|---|---|---|
 CryptoWithJamesRank: 32143 | خرید | حد سود: تعیین نشده حد ضرر: تعیین نشده | 1/5/2026 |
Price Chart of Stacks
سود 3 Months :
سیگنالهای Stacks
Filter
Sort messages by
Trader Type
Time Frame
CryptoWithJames
STXUSDT UPDATE

#STX UPDATE STX Technical Setup Pattern: Falling Wedge Pattern Current Price: 0.3637$ Target Price: 0.4550$ Target % Gain: 170.70% Technical Analysis: STX is breaking out of a falling wedge pattern on the 1D chart, signaling a strong bullish reversal setup. Price has decisively broken above the descending resistance trendline with strong bullish momentum, confirming the breakout. The measured move from the wedge projects an upside target near 0.4550$, which aligns with previous resistance and offers significant upside potential if price holds above the breakout zone. Time Frame: 1D Risk Management Tip: Always use proper risk management.

FireHoseReel
FireHoseReel | STX Breakout Loading at Key Levels
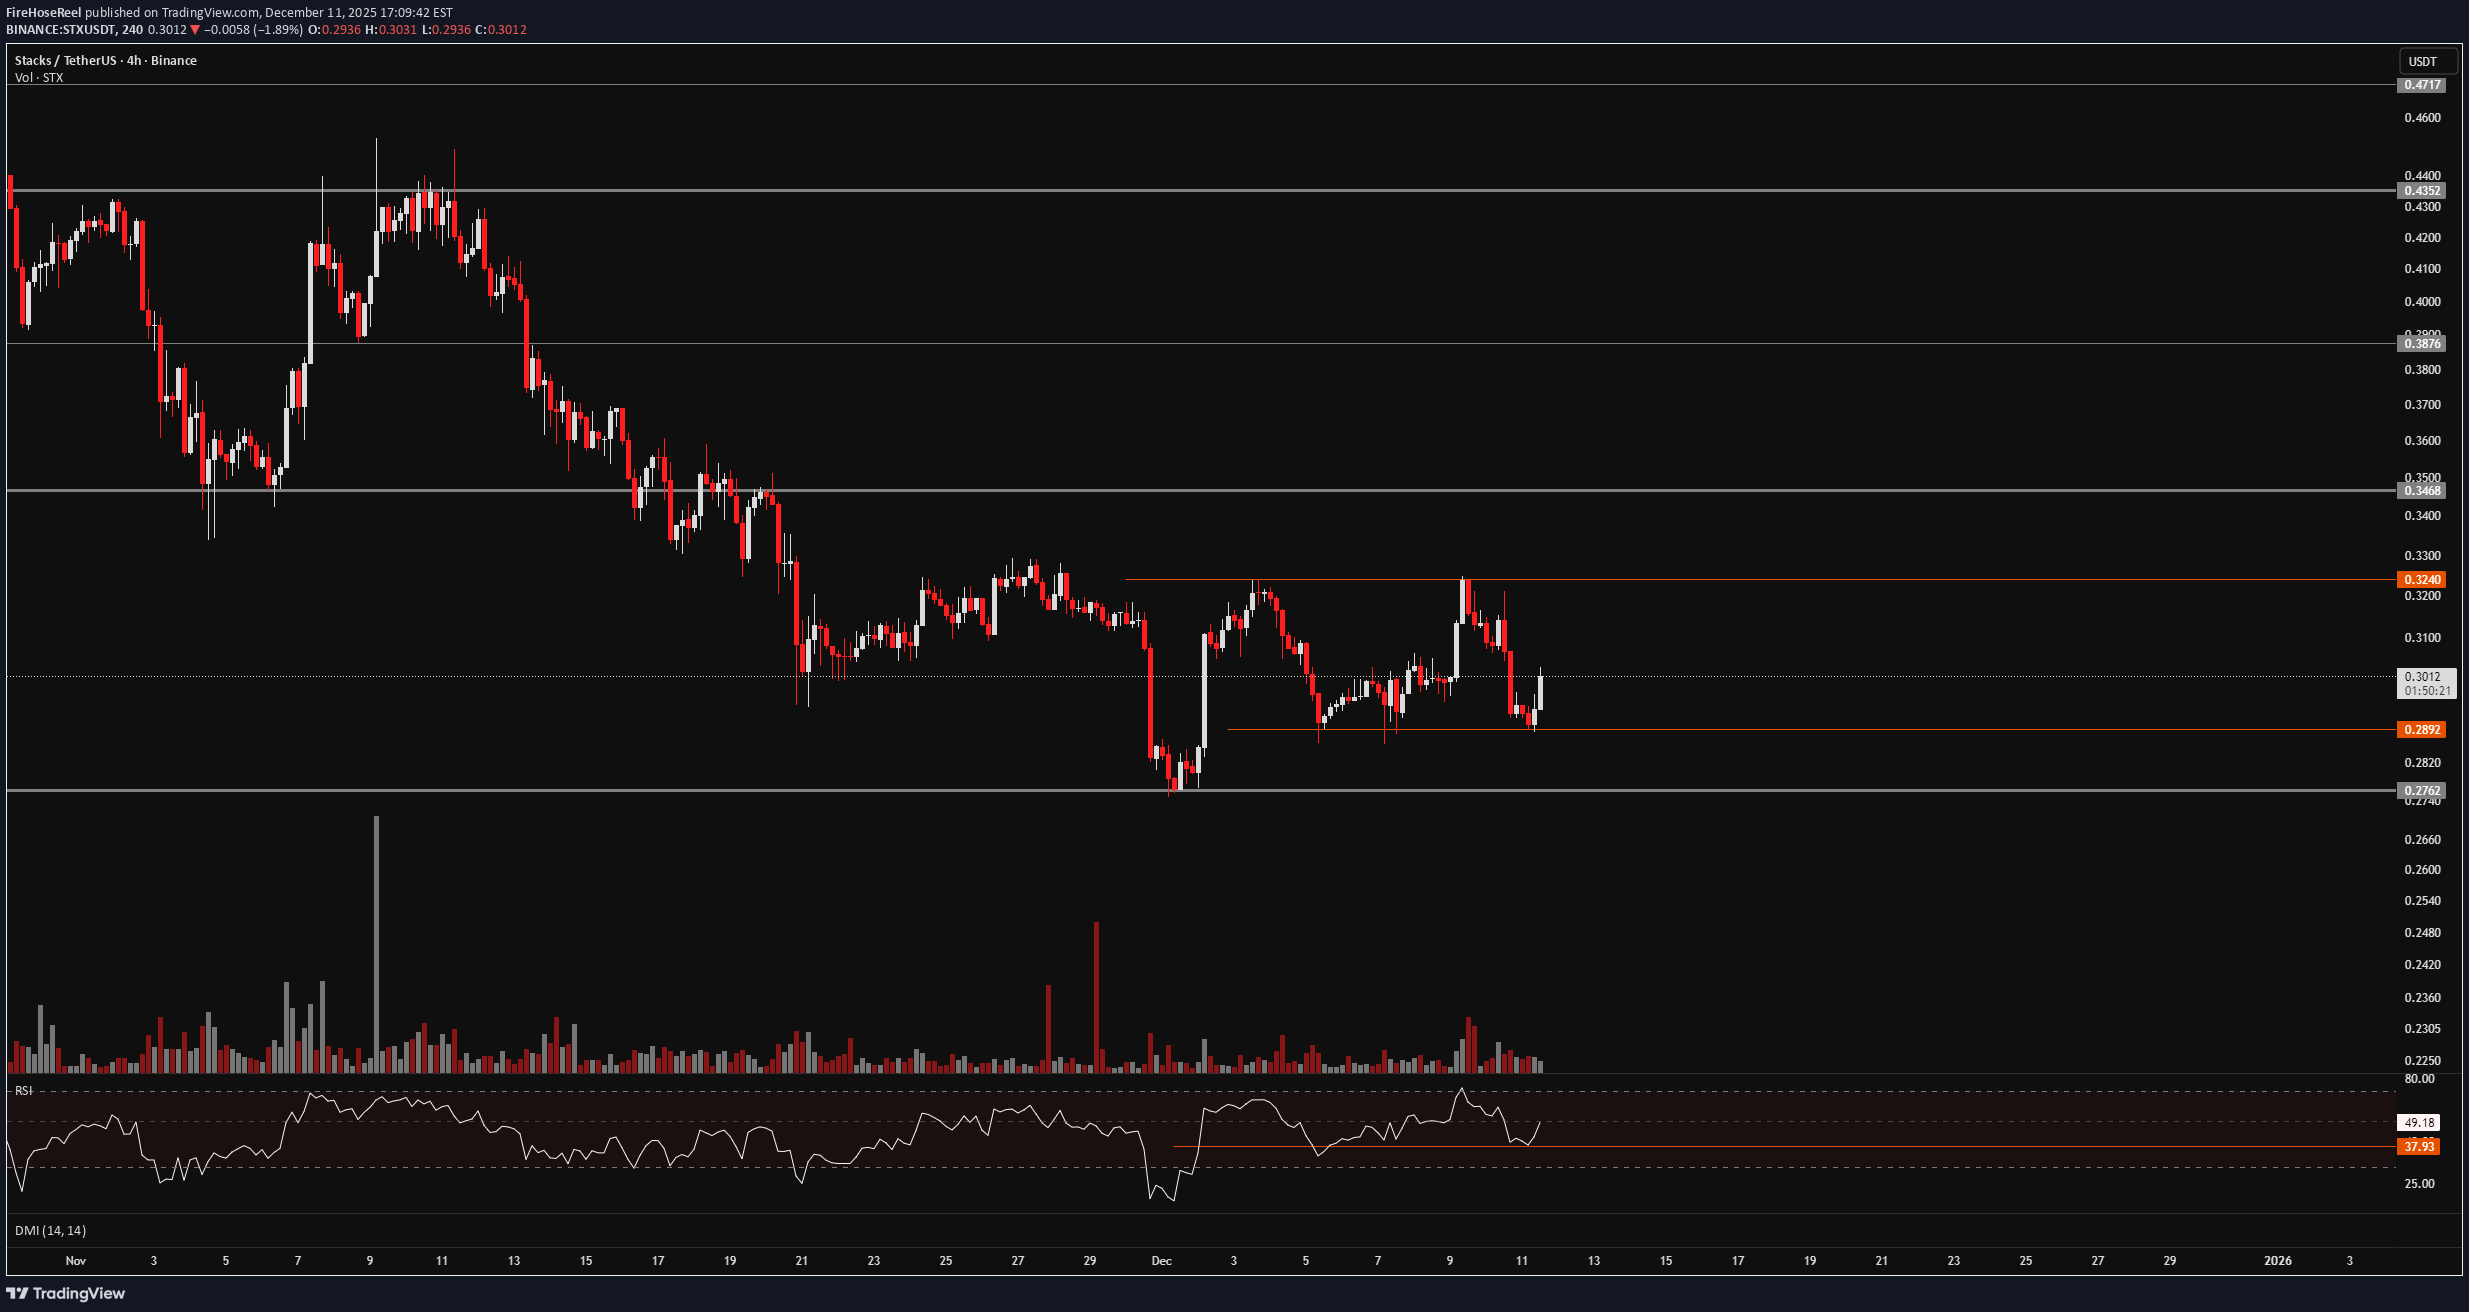
🔥 Welcome To FireHoseReel ! Let’s jump into Stacks (STX) market analysis. 🪙 Stacks (rank #88) powers Bitcoin smart contracts, letting users build DeFi, NFTs, and apps on BTC with security anchored to the Bitcoin chain. 👀 STX 4H Overview STX is in a clear downtrend on the monthly, weekly, and daily charts. On the 4H timeframe, it has formed a small consolidation zone. A breakout in either direction can create a tradable setup from this consolidation. 📊 Volume Analysis Stacks is currently showing significant volume decline, and the last volume spike leaned toward selling pressure. A breakout through the orange pre-breakout zones could trigger a notable increase in volume. ✍️ STX Trading Scenarios 🟢 Long Scenario: A breakout above $0.324 with rising buy volume creates a pre-breakout setup targeting the $0.346 resistance—suitable for a risky long entry. 🔴 Short Scenario: Losing the $0.2899 support with increasing sell volume—especially if RSI dips into oversold—could act as a pre-breakout signal for a deeper move toward $0.2762. 🧠 Protect your capital first. No setup is worth blowing your account. If risk isn’t controlled, profit means nothing. Trade with rules, not emotions.

tradecitypro
تحلیل STX: مقاومت کلیدی کجاست؟ خرسها در کنترل قیمت!
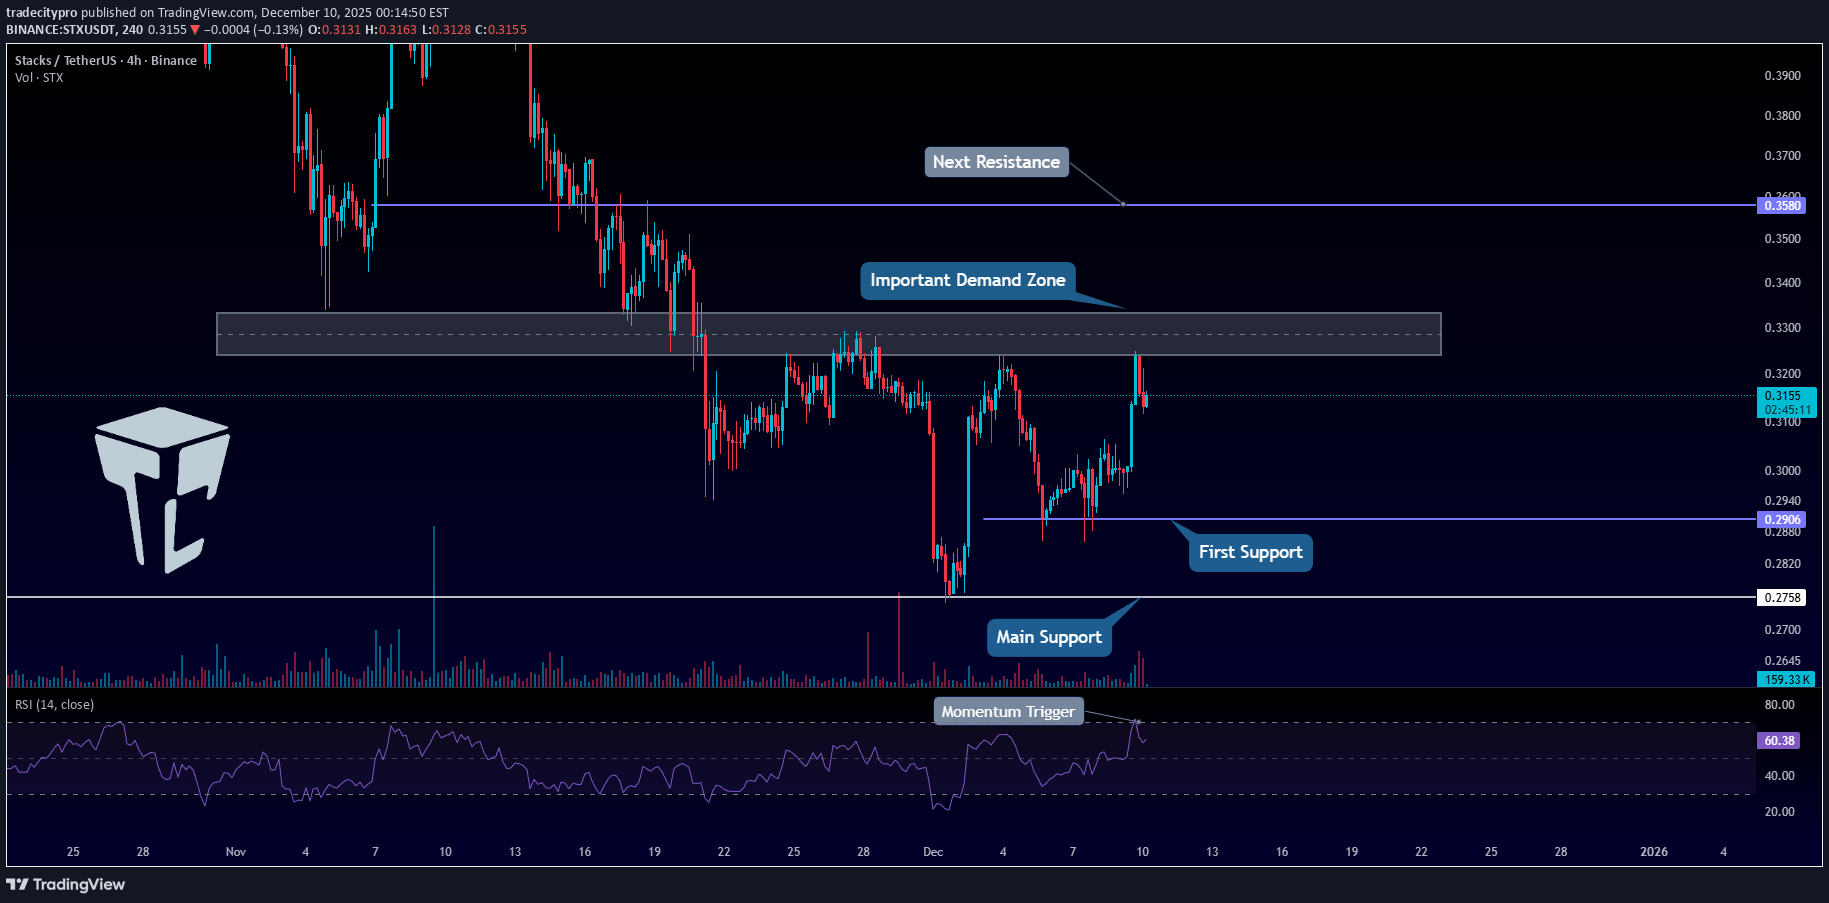
👋 Welcome to TradeCity Pro! In this analysis, I want to review STX, one of the Bitcoin ecosystem projects, currently ranked 87th on CoinMarketCap with a $573 million market cap. ⏳ 4-Hour Timeframe As you can see, on the 4-hour timeframe, STX is dealing with a resistance zone that it has touched several times before, and now it has reached this zone again. ✔️ After reaching this level, the volume of the red candles rejecting from this zone has been increasing, which shows the weakness of buyers and the strength of sellers at this level. 📊 If selling volume continues to increase, there is a possibility of price moving towards the support zones of 0.2906 and 0.2758. 💡 So, we can open a short position either after breaking the structure in lower timeframes or by breaking these zones 0.2906 and 0.2758. 💥 For a long position, breaking the range will be the first long trigger and the first confirmation for the coin turning bullish. 🎲 The next important resistance zones are 0.3580 and 0.4359, and breaking these levels will give us the main confirmations for a bullish trend. 🎯 On the other hand, if RSI enters the overbought zone, we can confirm the entry of bullish momentum into the market, increasing the likelihood of breaking the resistance zone. 📝 Final Thoughts Stay calm, trade wisely, and let's capture the market's best opportunities! This analysis reflects our opinions and is not financial advice. Share your thoughts in the comments, and don’t forget to share this analysis with your friends! ❤️

Kapitalist01
لحظه طلایی معامله: منتظر این حرکت در نمودار ۱۸:۱۴ باشید!
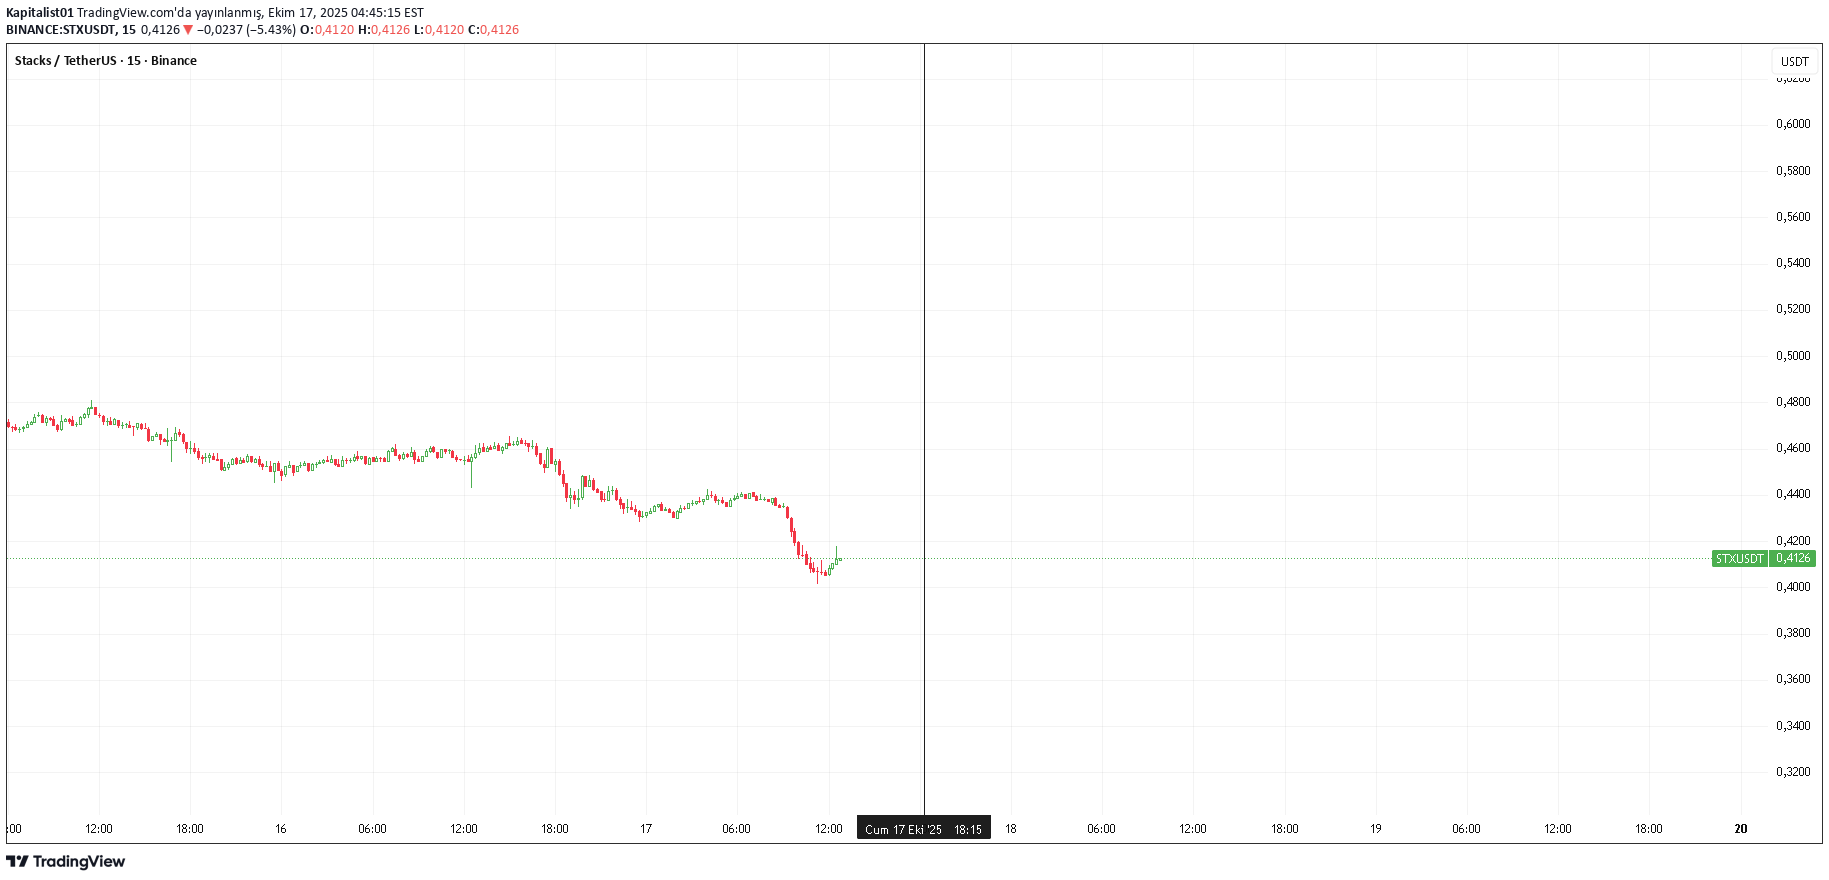
18:14 wait for momentum on minute chart short term transaction When the price reaches the vertical line, it will be in the support or resistance area. The transaction is entered either above the line or when the price returns after the line for confirmation. It is not investment advice

AlvinDeo96
پول هوشمند وارد میشود: تحلیل فنی و سناریوهای معاملاتی قوی برای استکس (STX)

STX has been quietly range bound for nearly four years, but the recent price action demands attention. While most alts printed fresh lows during the October 10th liquidation flush, STX held firm its wick didn’t breach the Selling Climax (SC), and volume surged. This Last Point of Support (LPS) signals strong demand and potential smart money presence (weekly timeframe). Trade Scenarios Option 1: Immediate Entry Entry: Current price Stop Loss: Just below the LPS Targets: TP1: Yearly pivot + major 50% level TP2: If price breaks the range high, a projected range extension gives a minimal target of ~$42 These targets may seem ambitious, but they’re derived directly from the chart structure, no hopium, just data. Option 2: Pullback Entry Entry: Wait for a pullback near the EQ of the large wick Stop Loss: Based on daily TF structure Targets: Same as Option 1

Ener-traders
پیشبینی صعودی STX: آیا کندل سبز بزرگ در راه است؟

STX is on the bullish horizon I expect a bullish candle soon, as it breaks all the mini resistance

MyCryptoParadise
Is STX About to Explode or Collapse From This Demand Zone?
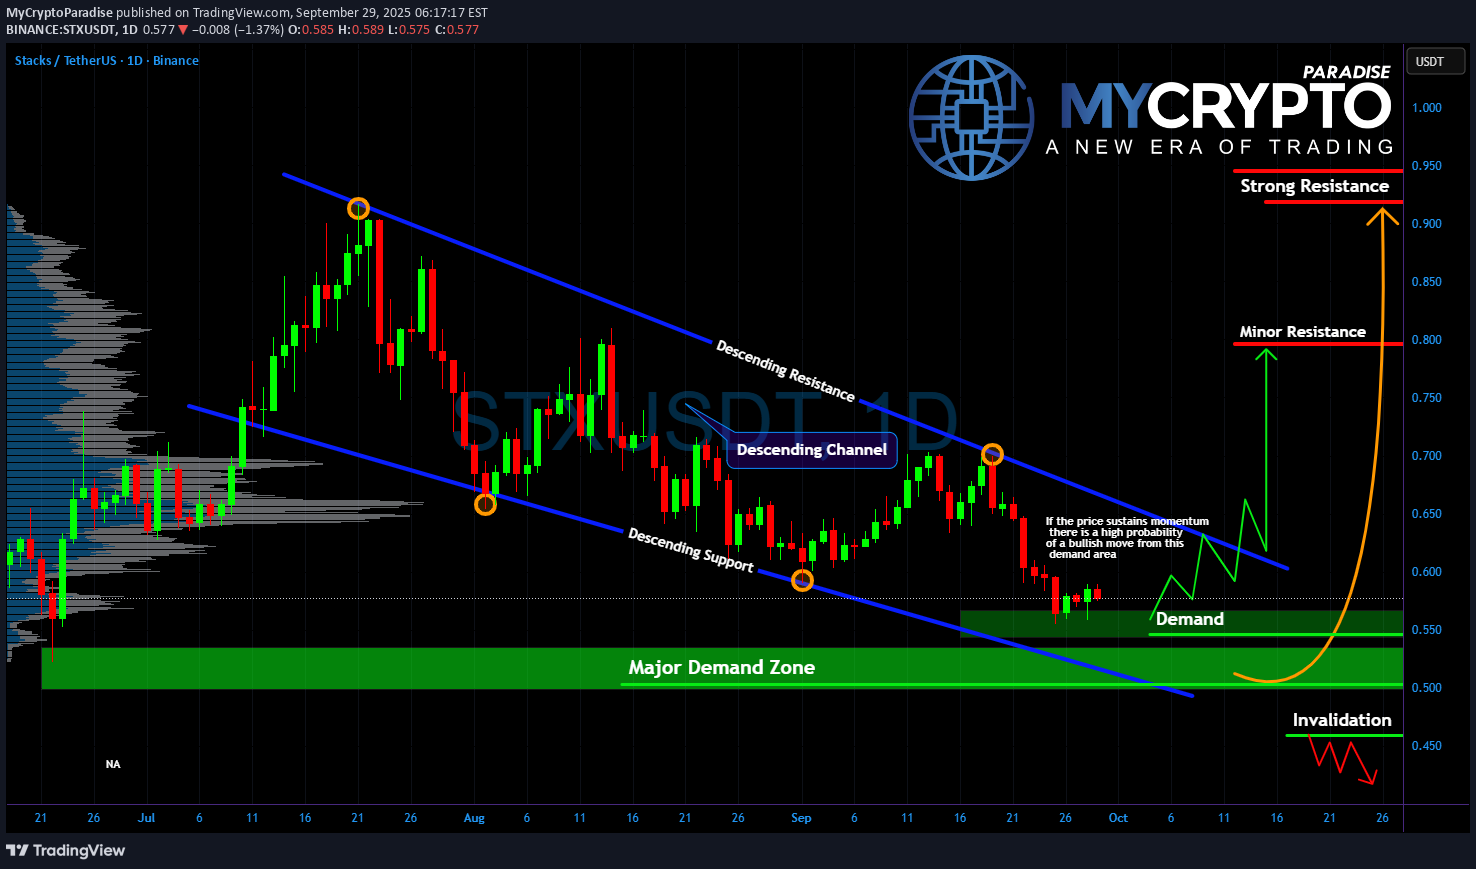
Yello Paradisers, what if I told you that the next big move on STX could decide whether traders print money or get wiped out in days? The chart is painting a dangerous setup, and ignoring it could be costly. 💎#STXUSDT has been stuck in a clear descending channel, repeatedly rejecting from its resistance line and finding temporary relief at its support. Now, price is testing a major demand zone between $0.55–$0.58, a level that could either spark a strong reversal or lead to brutal breakdowns if demand fails. 💎If buyers defend this level with momentum, the probability of a bullish rebound increases significantly. A breakout above the descending resistance could fuel a rally toward the minor resistance at $0.80 and potentially extend all the way to the strong resistance near $0.95. This move would not just trap shorts but also create panic FOMO buying from latecomers. 💎But beware if demand collapses and the zone fails to hold, invalidation comes quickly. A break below $0.50 opens the door for another leg down, flushing weak hands out of the market and creating pain for anyone holding without a plan. Consistency, risk management, and patience are the real weapons in this market. MyCryptoParadise iFeel the success🌴

CryptoNuclear
STX/USDT — Key Support Test, Break or Bounce?
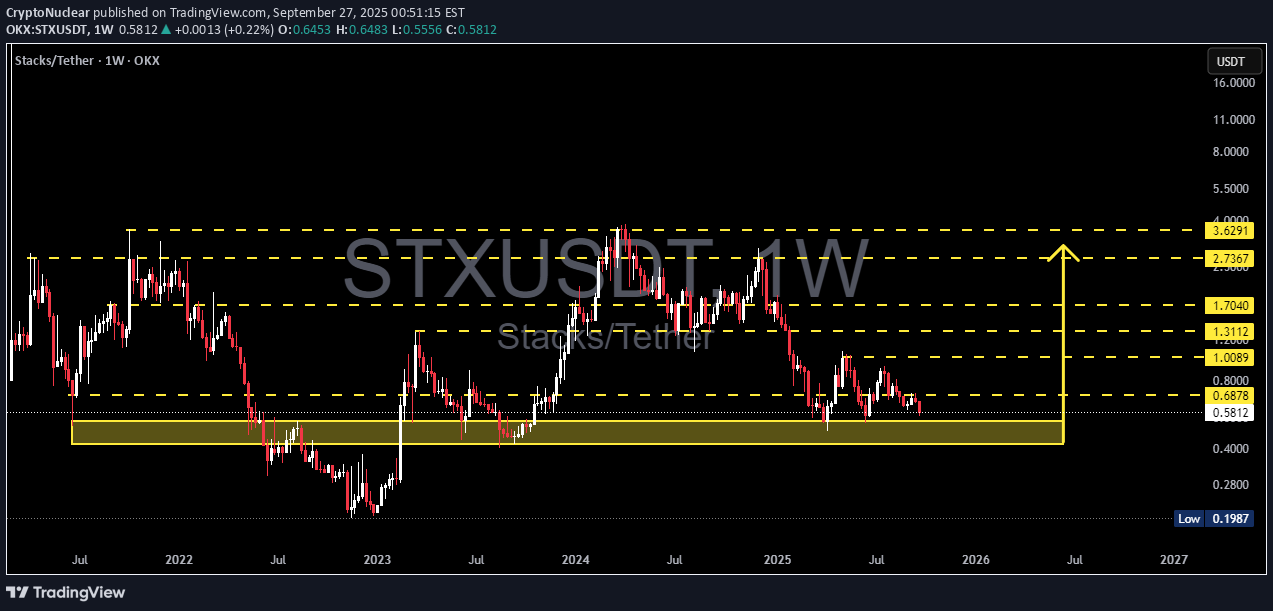
Stacks (STX/USDT) is currently sitting at a critical make-or-break zone that will define its medium- to long-term direction. On the weekly chart, price has returned to the historical demand zone at $0.42 – $0.58 (yellow box). This area has acted as a strong accumulation level multiple times before — notably during the 2022–2023 bottom before the explosive rally above $3. --- 🔎 Structure & Pattern 1. Historical Demand Zone ($0.42–$0.58) This zone is the last stronghold for bulls before the market risks sliding back towards the historical low at $0.1987. As long as price holds and forms a reversal pattern here (bullish engulfing, hammer, etc.), it can trigger another wave of accumulation. 2. Lower Highs Since 2024 After peaking above $3, STX has continued to print lower highs, showing that sellers still dominate. However, a retest of this deep demand zone also sets the stage for a potential large-scale bottoming. 3. Multi-Year Range STX has been moving within a broad $0.20 – $3.60 range since 2021. Price is now at the bottom edge of this range, meaning downside risk is relatively limited compared to the upside potential if a rebound occurs. --- 🚀 Bullish Scenario Early Confirmation: A weekly close back above $0.80 – $1.00. Upside Targets: First resistance: $1.0089 Next levels: $1.3112 → $1.7040 → $2.7367 → $3.6291 From entries in the $0.58–0.45 zone, the reward-to-risk (R:R) potential is >3:1, making this area a high-value accumulation zone. --- ⚠️ Bearish Scenario Breakdown Confirmation: A weekly close below $0.42. Downside Targets: First: $0.28 (minor support) Next: $0.1987 (historical low) A failure here would signal renewed long-term bearish pressure and a potential return to the cycle’s bottom range. --- 🎯 Conclusion STX is currently at a golden accumulation zone that historically has provided strong upside reactions. Aggressive traders may look for entries at $0.58–0.45 with stops below $0.42. Conservative traders should wait for a weekly close above $0.80–1.00 for confirmation of bullish momentum. This is a decisive zone: hold = high rebound potential, break = risk of retesting $0.20. --- #STX #STXUSDT #Stacks #Crypto #TechnicalAnalysis #CryptoTrading #Altcoins #PriceAction #SupportResistance #Accumulation

Crypto_alphabit
STX (SPOT)
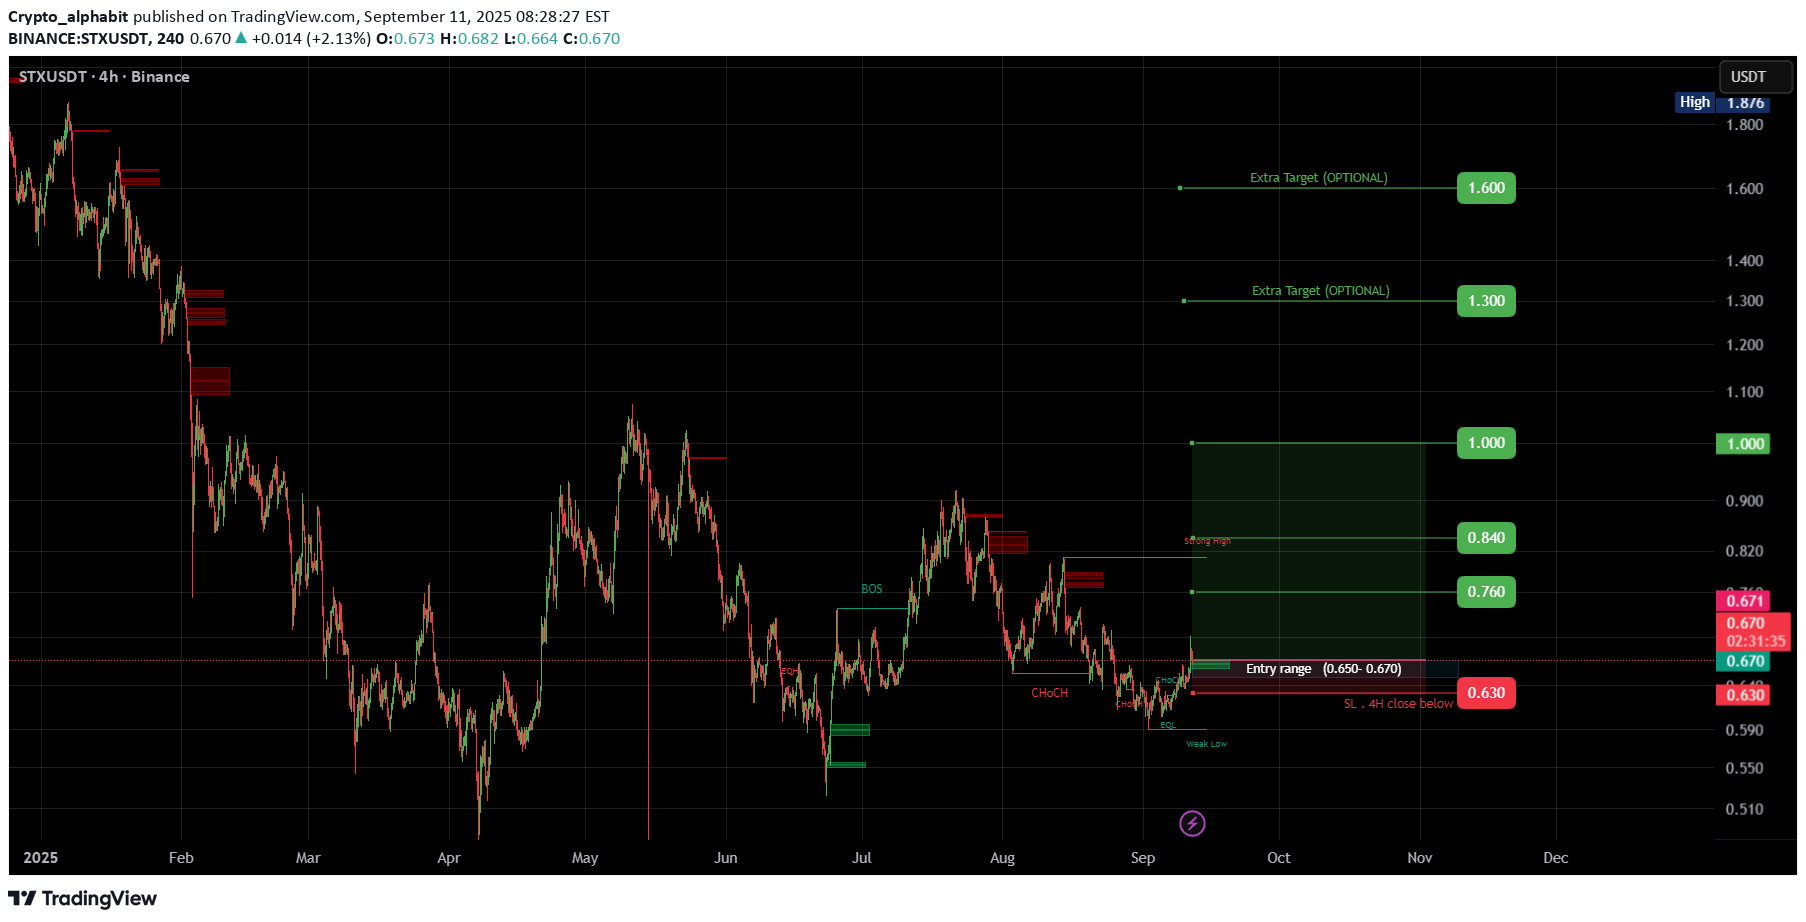
STXUSDT #STX / USDT Entry range (0.650- 0.670) SL 4H close below 0.630 T1 0.760 T2 0.840 T3 1.000 2 Extra Targets is optional 1.300 and 1.600 _______________________________________________________ Golden Advices. ******************** * collect the coin slowly in the entry range. * Please calculate your losses before the entry. * Do not enter any trade you find it not suitable for you. * No FOMO - No Rush , it is a long journey.

Mike-BTD
STACKS is approaching a breakout moment
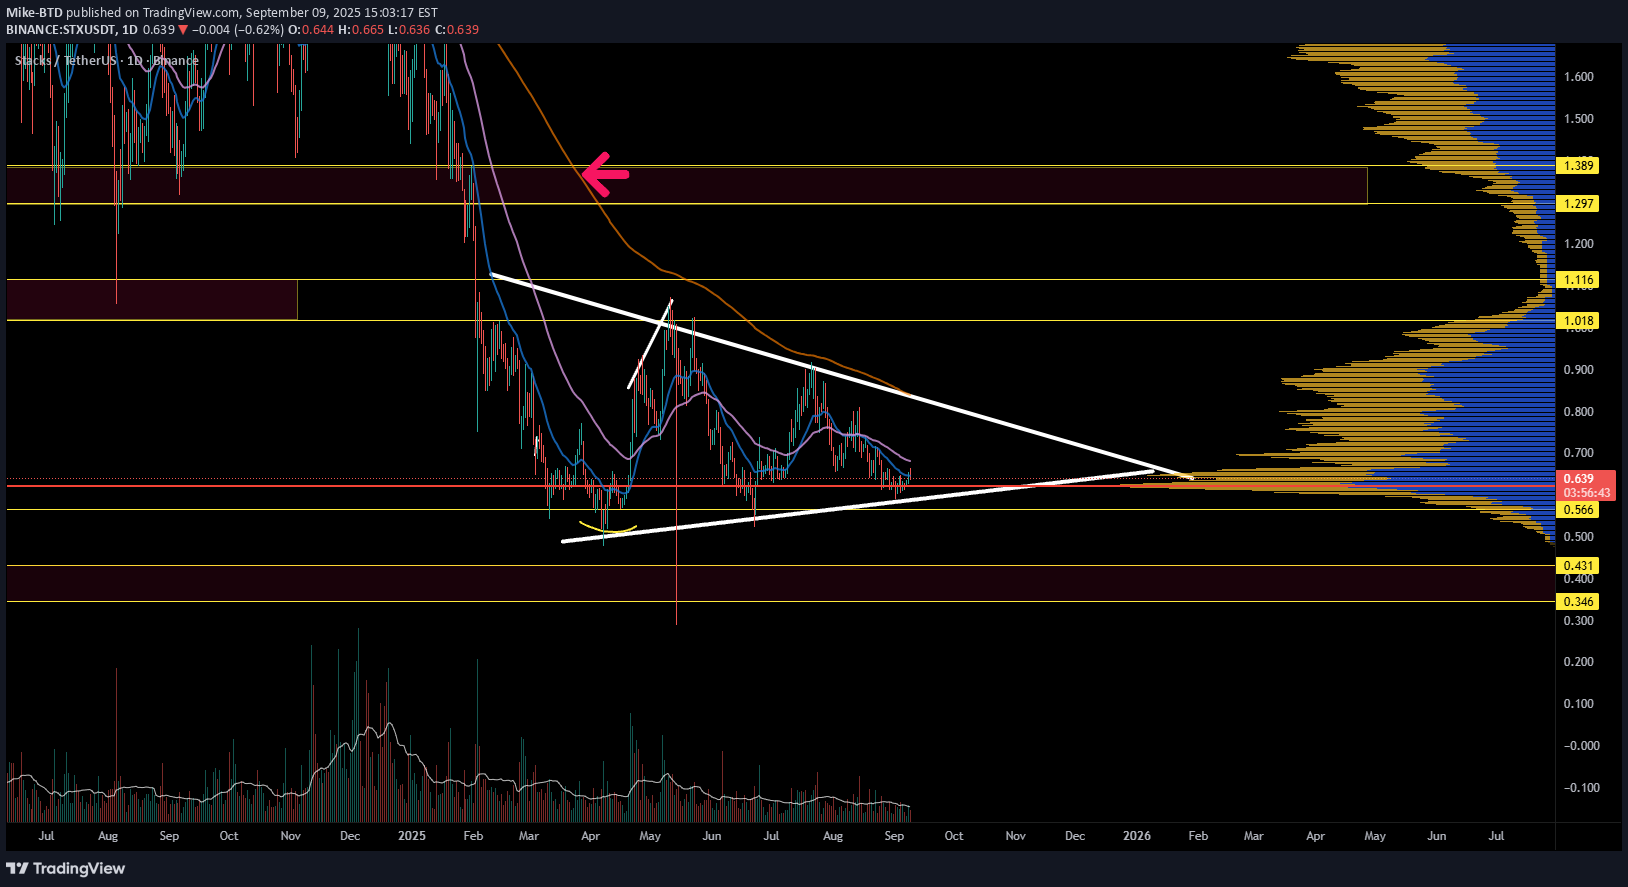
STX is consolidating nicely within a triangular formation as volume decreases; eventually, the price is expected to squeeze. The question is, in which direction? The fact is, such a structure has a high chance of continuation, but a swing failure could cause the price to shift up. DCA moment. NFA
Disclaimer
Any content and materials included in Sahmeto's website and official communication channels are a compilation of personal opinions and analyses and are not binding. They do not constitute any recommendation for buying, selling, entering or exiting the stock market and cryptocurrency market. Also, all news and analyses included in the website and channels are merely republished information from official and unofficial domestic and foreign sources, and it is obvious that users of the said content are responsible for following up and ensuring the authenticity and accuracy of the materials. Therefore, while disclaiming responsibility, it is declared that the responsibility for any decision-making, action, and potential profit and loss in the capital market and cryptocurrency market lies with the trader.