
SSV
ssv.network
| تریدر | نوع سیگنال | حد سود/ضرر | زمان انتشار | مشاهده پیام |
|---|---|---|---|---|
 CryptoWithJamesRank: 34307 | خرید | حد سود: تعیین نشده حد ضرر: تعیین نشده | 12/3/2025 | |
 Alpha-GoldFXRank: 34995 | خرید | حد سود: تعیین نشده حد ضرر: تعیین نشده | 12/3/2025 |
Price Chart of ssv.network
سود 3 Months :
سیگنالهای ssv.network
Filter
Sort messages by
Trader Type
Time Frame
CryptoWithJames
تحلیل تکنیکال SSV: سیگنال انفجار ۶۰ درصدی از الگوی گوه نزولی!
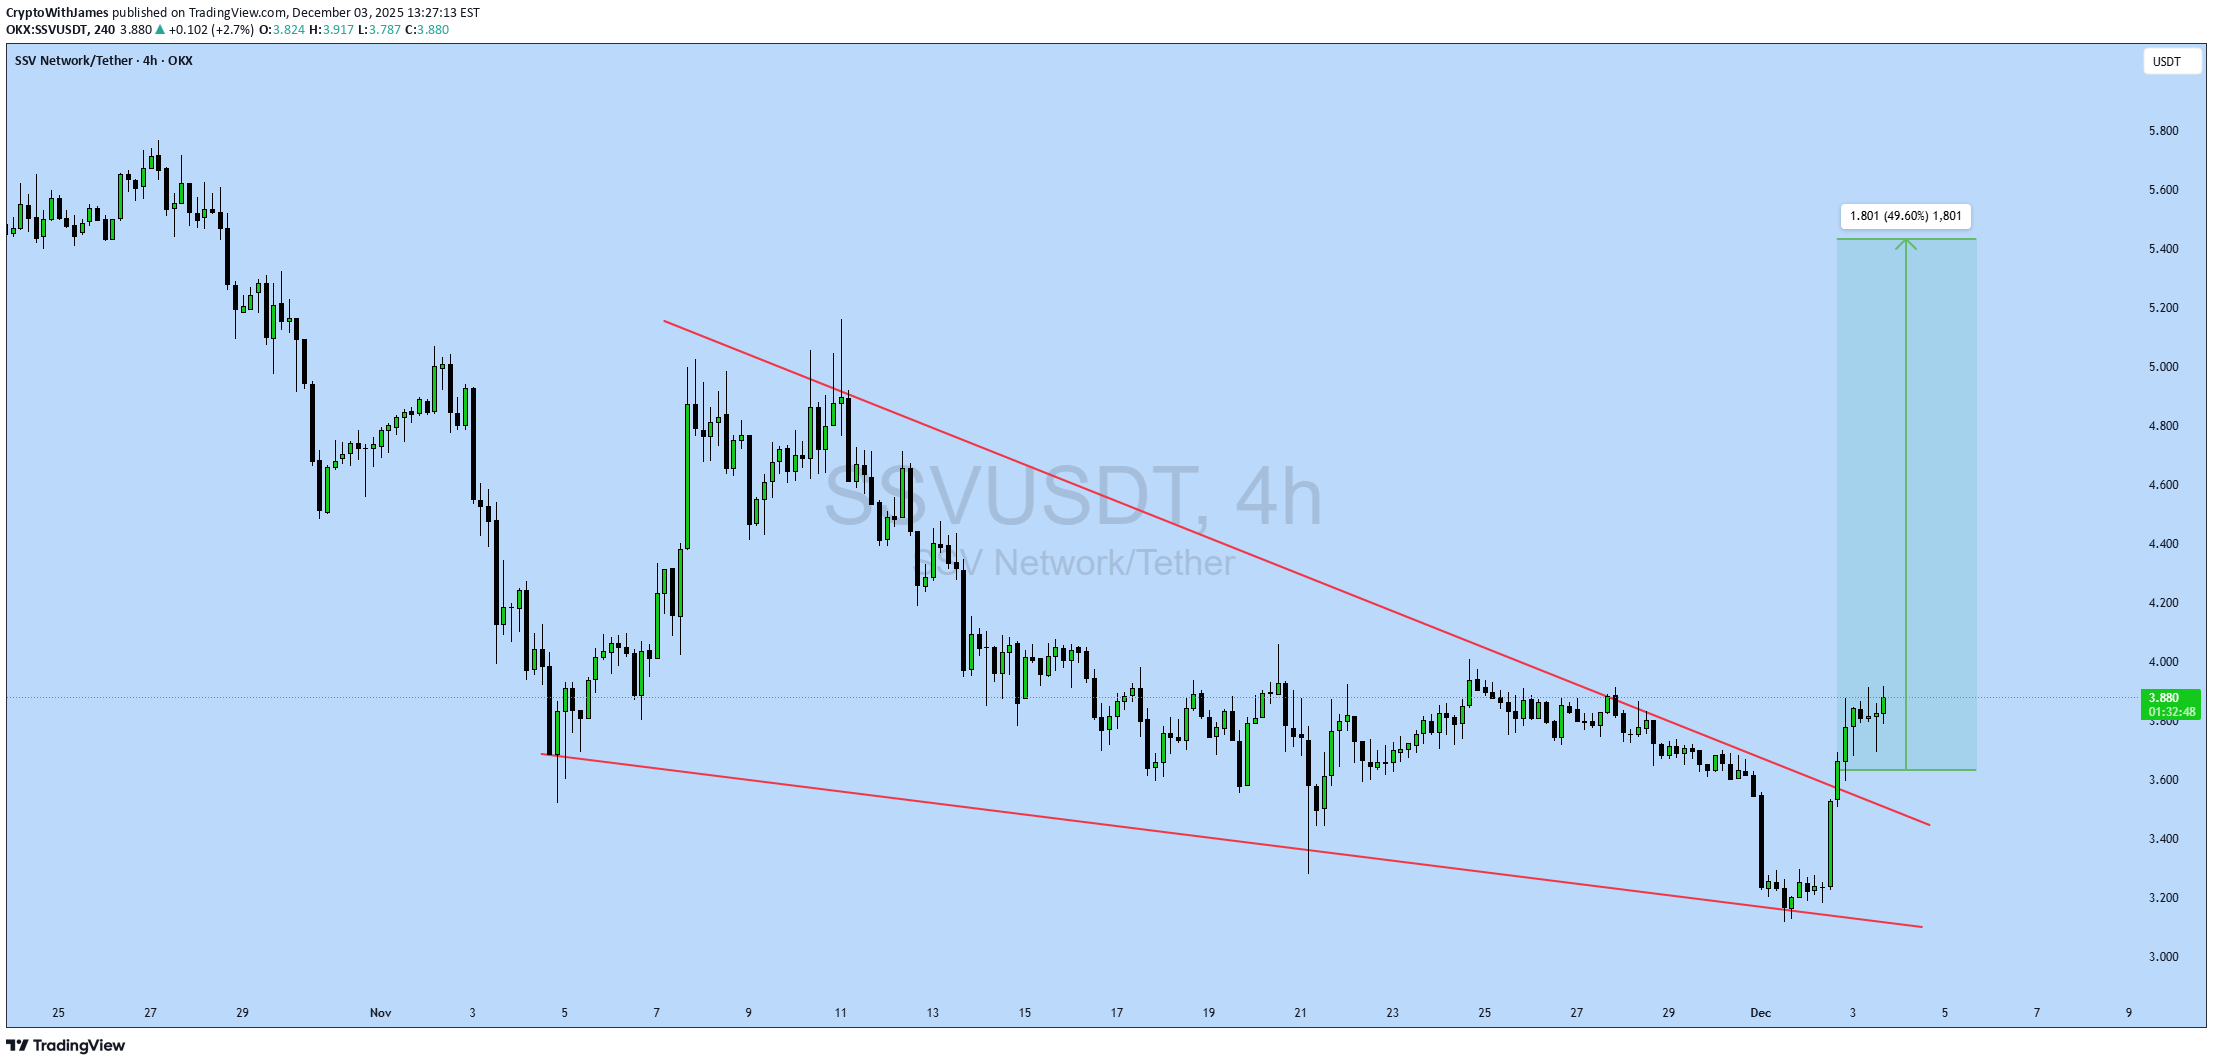
#SSV UPDATE SSV Technical Setup Pattern: Falling Wedge Pattern Current Price: Target Price: Target % Gain: 60.00% Technical Analysis: SSV is breaking out of a falling wedge pattern on the 1D chart, signaling a potential bullish reversal after a prolonged corrective phase. Price action is beginning to push above the descending resistance trendline, suggesting increasing buyer strength and a possible momentum shift. If the breakout is sustained, continuation toward higher resistance zones becomes likely as volume supports the move. Time Frame: 1D Risk Management Tip: Always use proper risk management.
Alpha-GoldFX
هشدار صعودی: الگوی گوه نزولی SSVUSDT نویدبخش جهش ۹۰ درصدی!
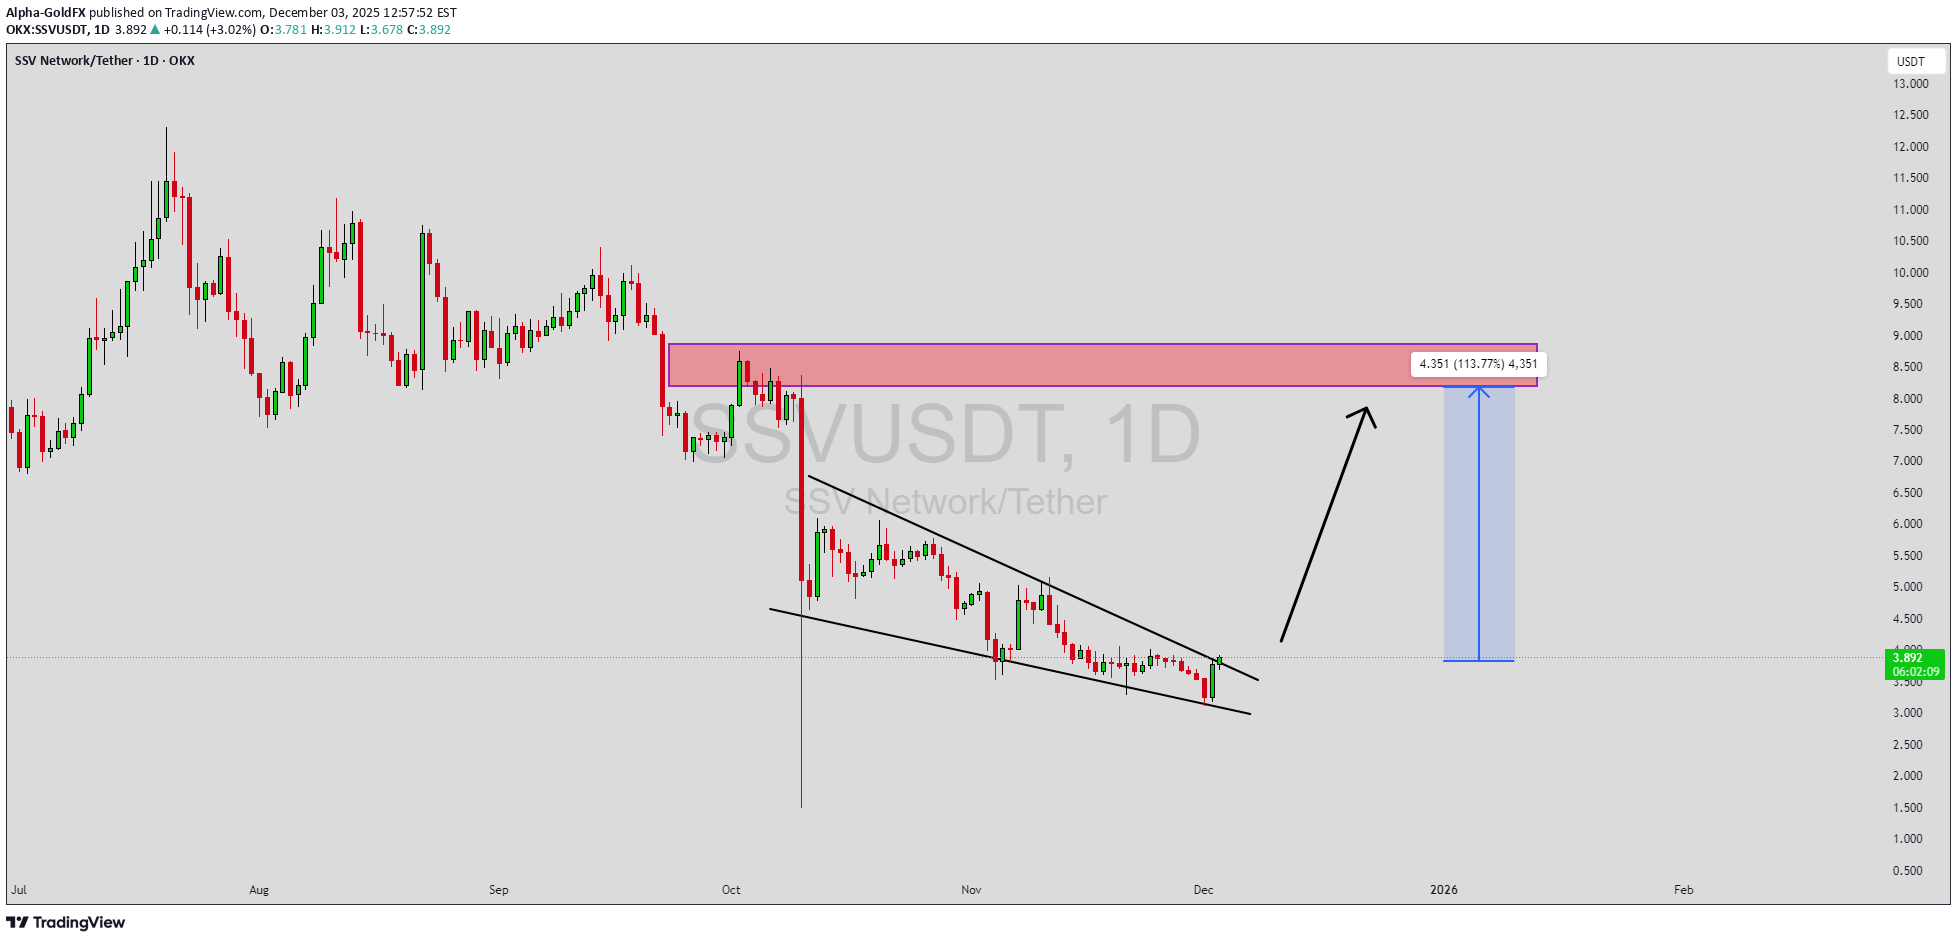
SSVUSDT is forming a clear falling wedge pattern, a classic bullish reversal signal that often indicates an upcoming breakout. The price has been consolidating within a narrowing range, suggesting that selling pressure is weakening while buyers are beginning to regain control. With consistent volume confirming accumulation at lower levels, the setup hints at a potential bullish breakout soon. The projected move could lead to an impressive gain of around 90% to 100% once the price breaks above the wedge resistance. This falling wedge pattern is typically seen at the end of downtrends or corrective phases, and it represents a potential shift in market sentiment from bearish to bullish. Traders closely watching SSVUSDT are noting the strengthening momentum as it nears a breakout zone. The good trading volume adds confidence to this pattern, showing that market participants are positioning early in anticipation of a reversal. Investors’ growing interest in SSVUSDT reflects rising confidence in the project’s long-term fundamentals and current technical strength. If the breakout confirms with sustained volume, this could mark the start of a fresh bullish leg. Traders might find this a valuable setup for medium-term gains, especially as the wedge pattern completes and buying momentum accelerates. ✅ Show your support by hitting the like button and ✅ Leaving a comment below! (What is your opinion about this Coin?) Your feedback and engagement keep me inspired to share more insightful market analysis with you!

Bithereum_io
احتمال انفجار قیمت SSV از گوه نزولی: اهداف صعودی خیرهکننده!
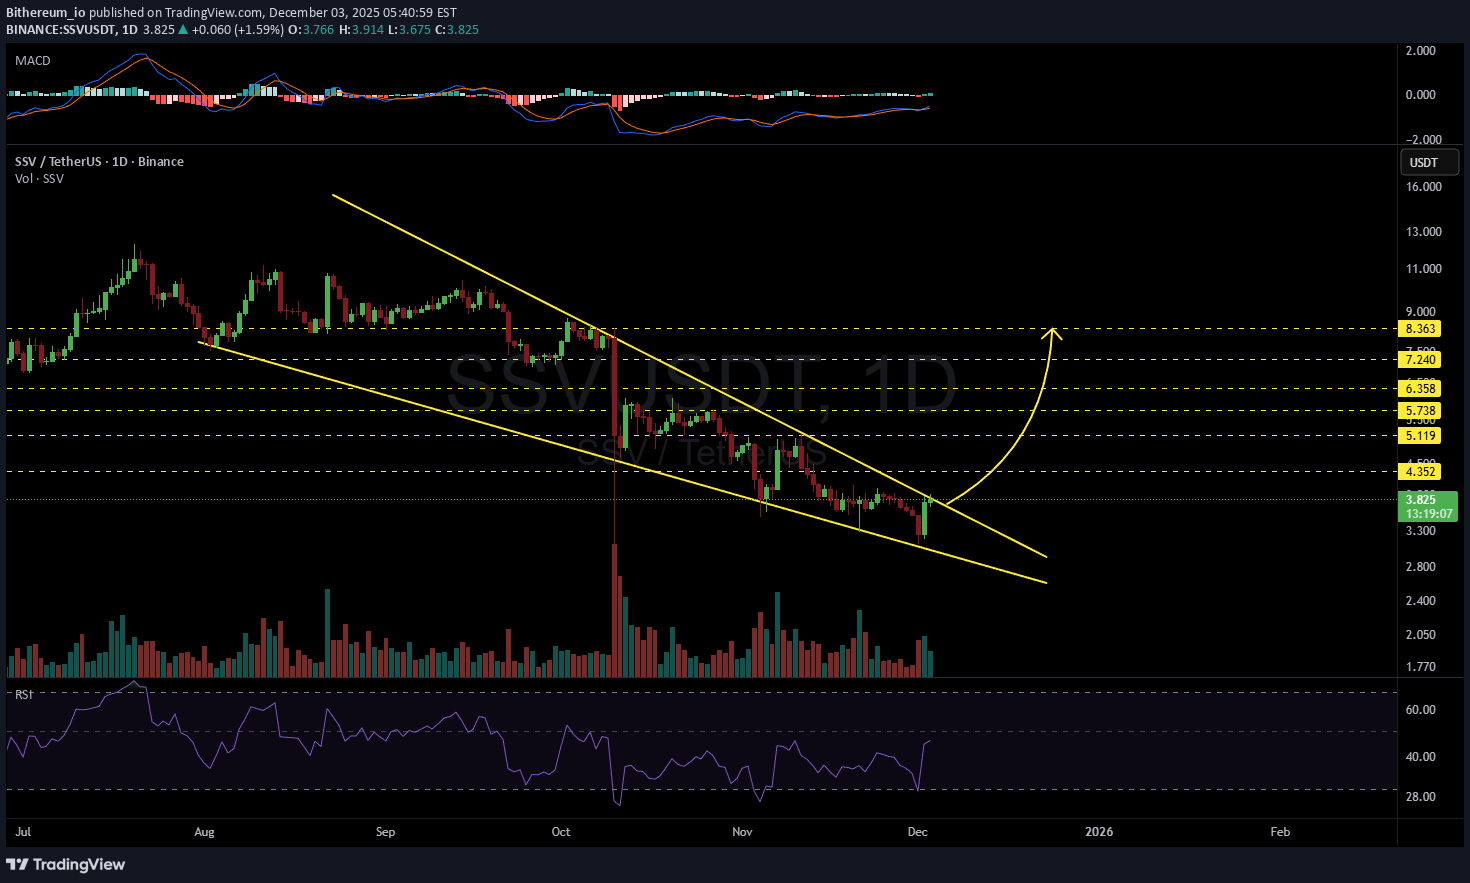
#SSV is moving inside a falling wedge on the daily chart. The price has bounced off the wedge support and is now on the verge of breaking out above the pattern. If that happens, the potential targets are: 🎯 $4.352 🎯 $5.119 🎯 $5.738 🎯 $6.358 🎯 $7.240 🎯 $8.363 ⚠️ Always remember to use a tight stop-loss and maintain proper risk management.

Kapitalist01
تحلیل تکنیکال ارز دیجیتال: استراتژی معاملاتی کوتاه مدت (03:13)
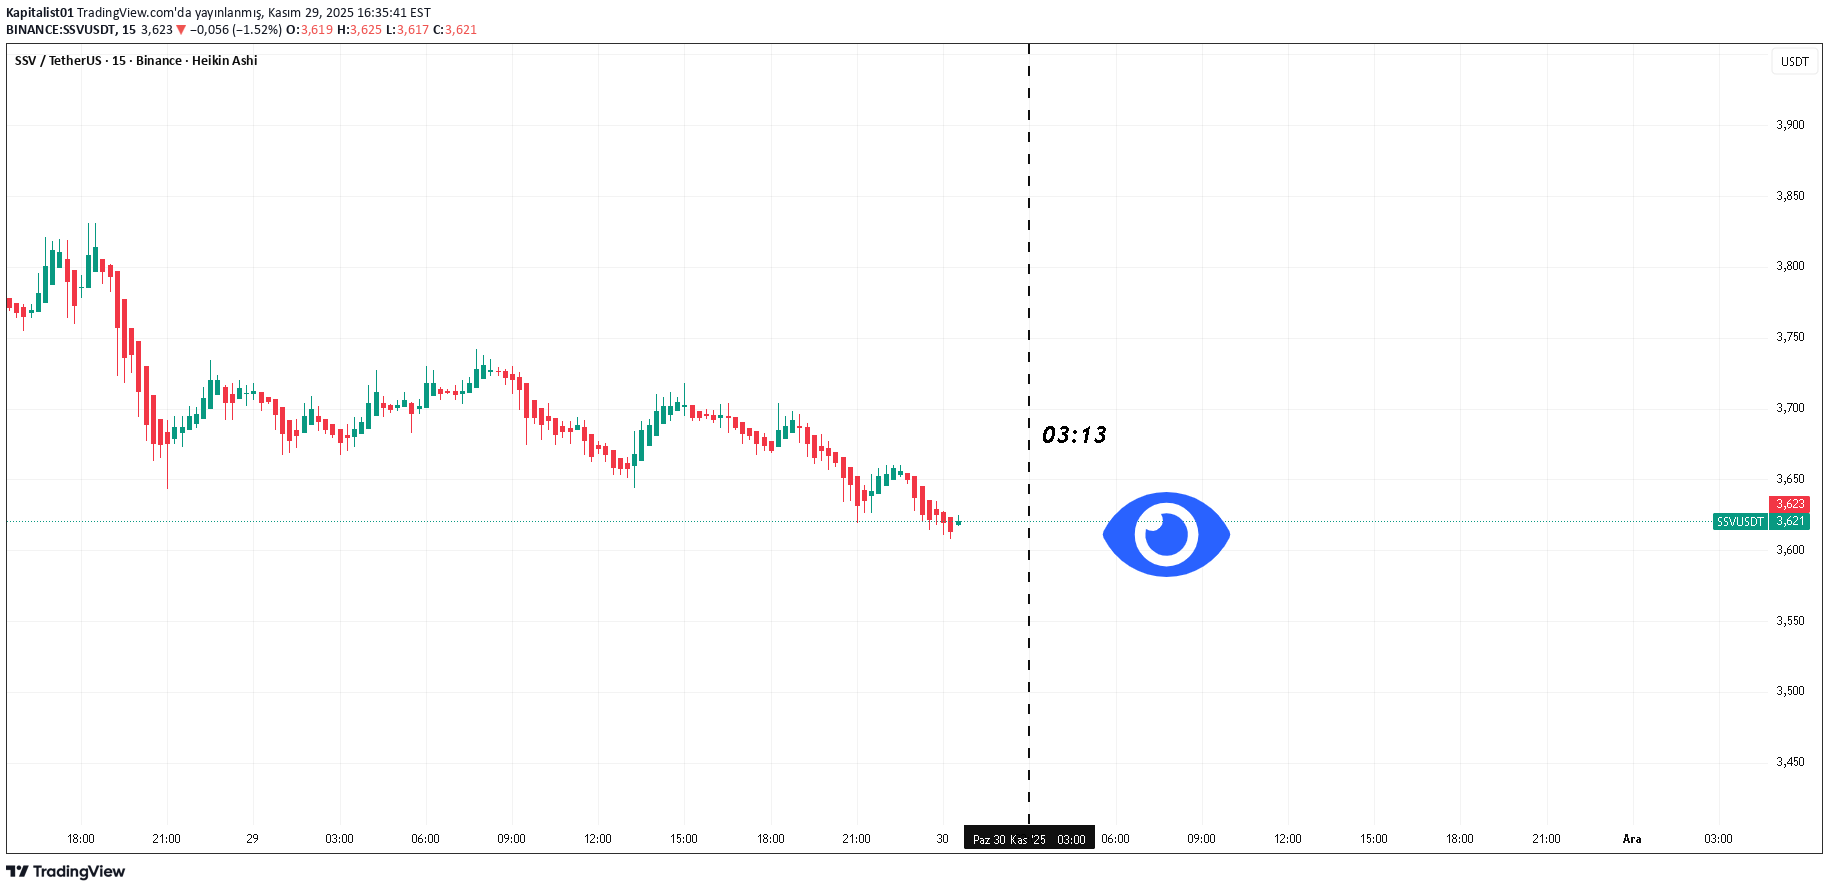
Note to self It is not investment advice. ssvusdt The zigzag was examined on the hour, a candle was selected and the region was determined. Last exit from the area found note to self. for short term monitoring purposes

behdark
SSV Looks Bullish (12H)
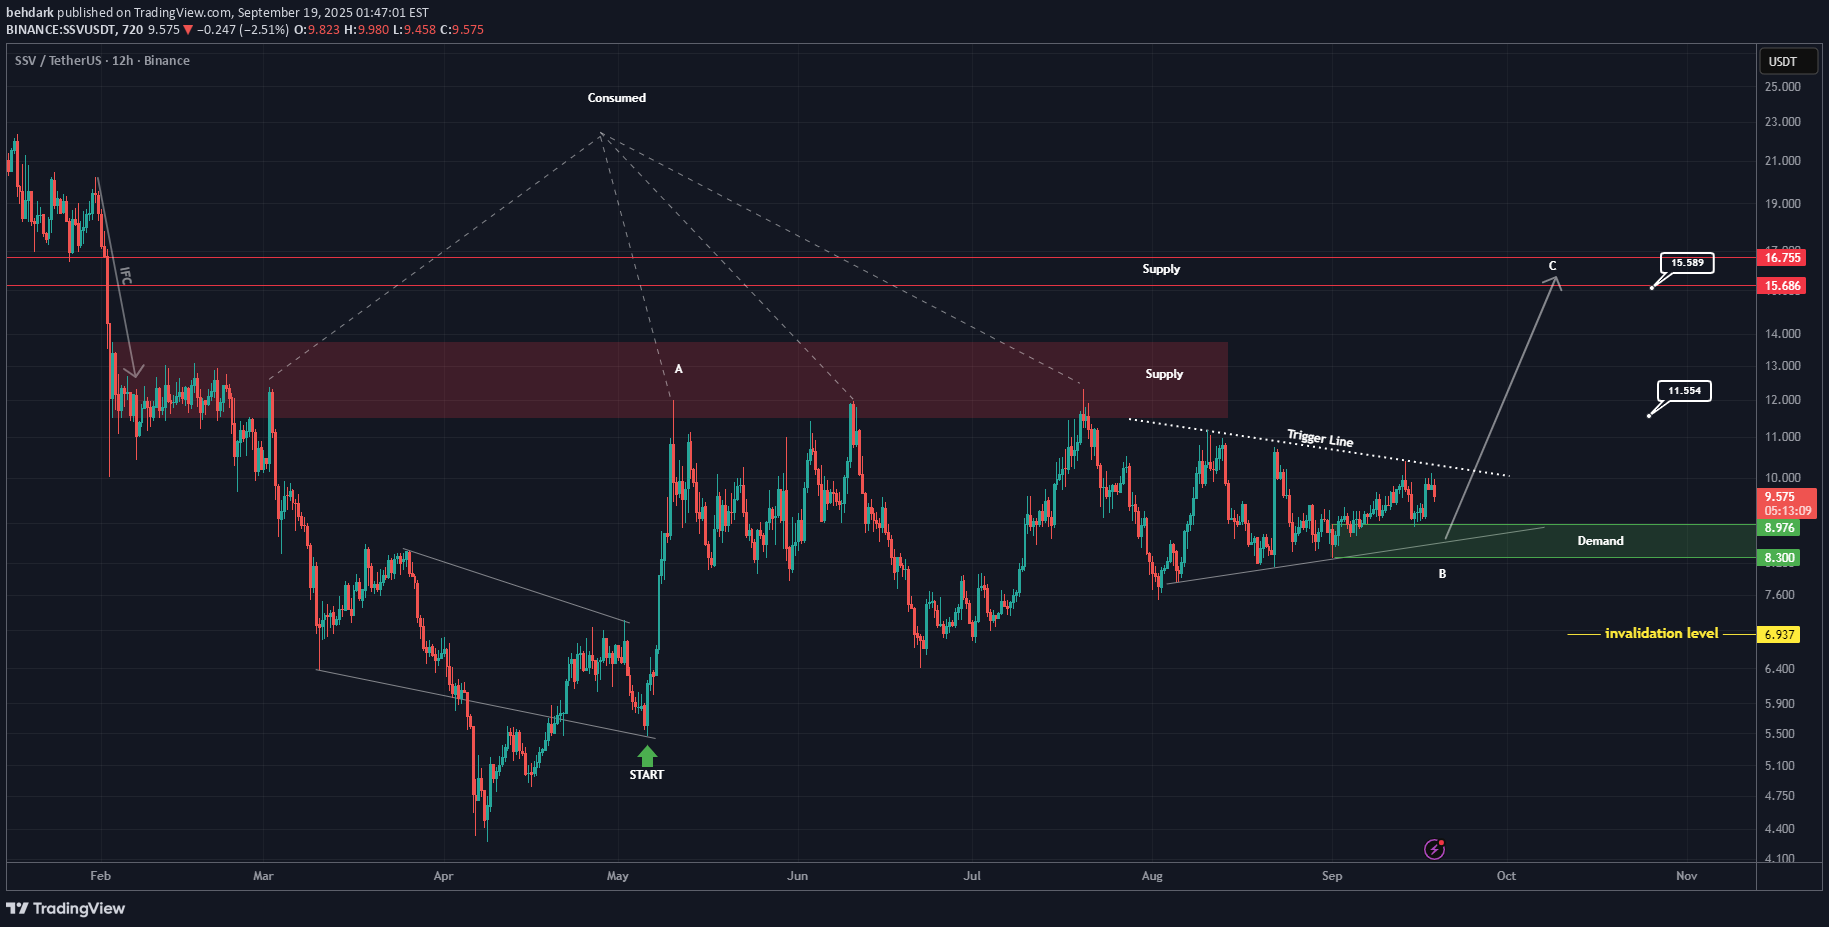
A supply zone has been highlighted on the chart. This supply has been consumed many times, yet no lower low has been formed. Also, from the point where we marked it on the chart, a bullish move started. After this bullish move, the price is currently forming a range. It seems that the initial move is wave A of the new pattern, and the ranging move is wave B. As long as the green zone holds, the price can move toward the targets. Once the trigger line is broken, we will have further confirmations. A daily candle closing below the invalidation level will invalidate this analysis. For risk management, please don't forget stop loss and capital management When we reach the first target, save some profit and then change the stop to entry Comment if you have any questions Thank You

abrarbala
Good for a long
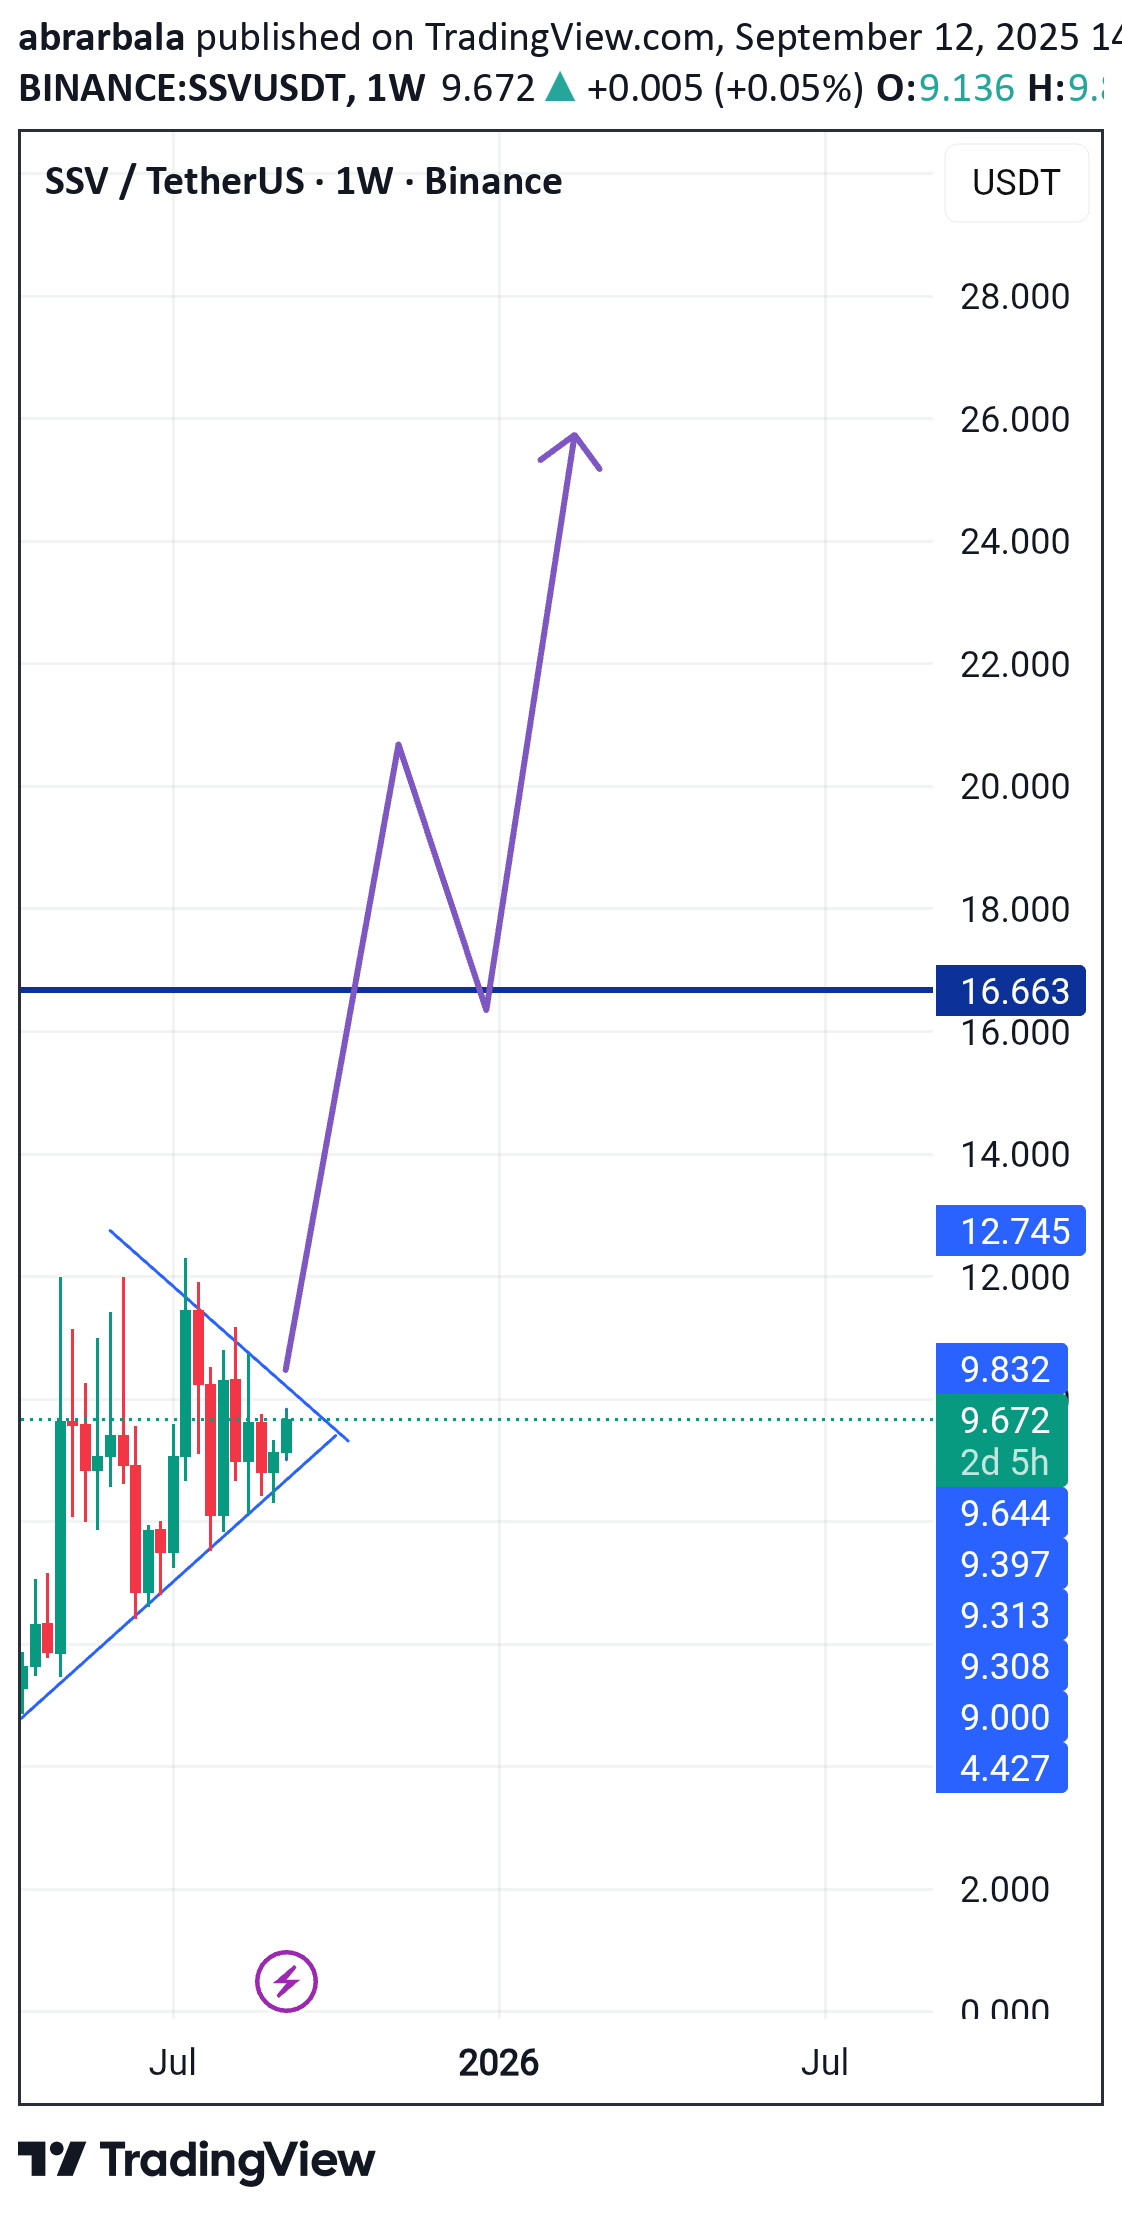
Its good for a spot buy.. It will give you a good return in a long term.. #Dyor #Nfa

RajaSaien
Technical Analysis (SSV/USDT – 4H)
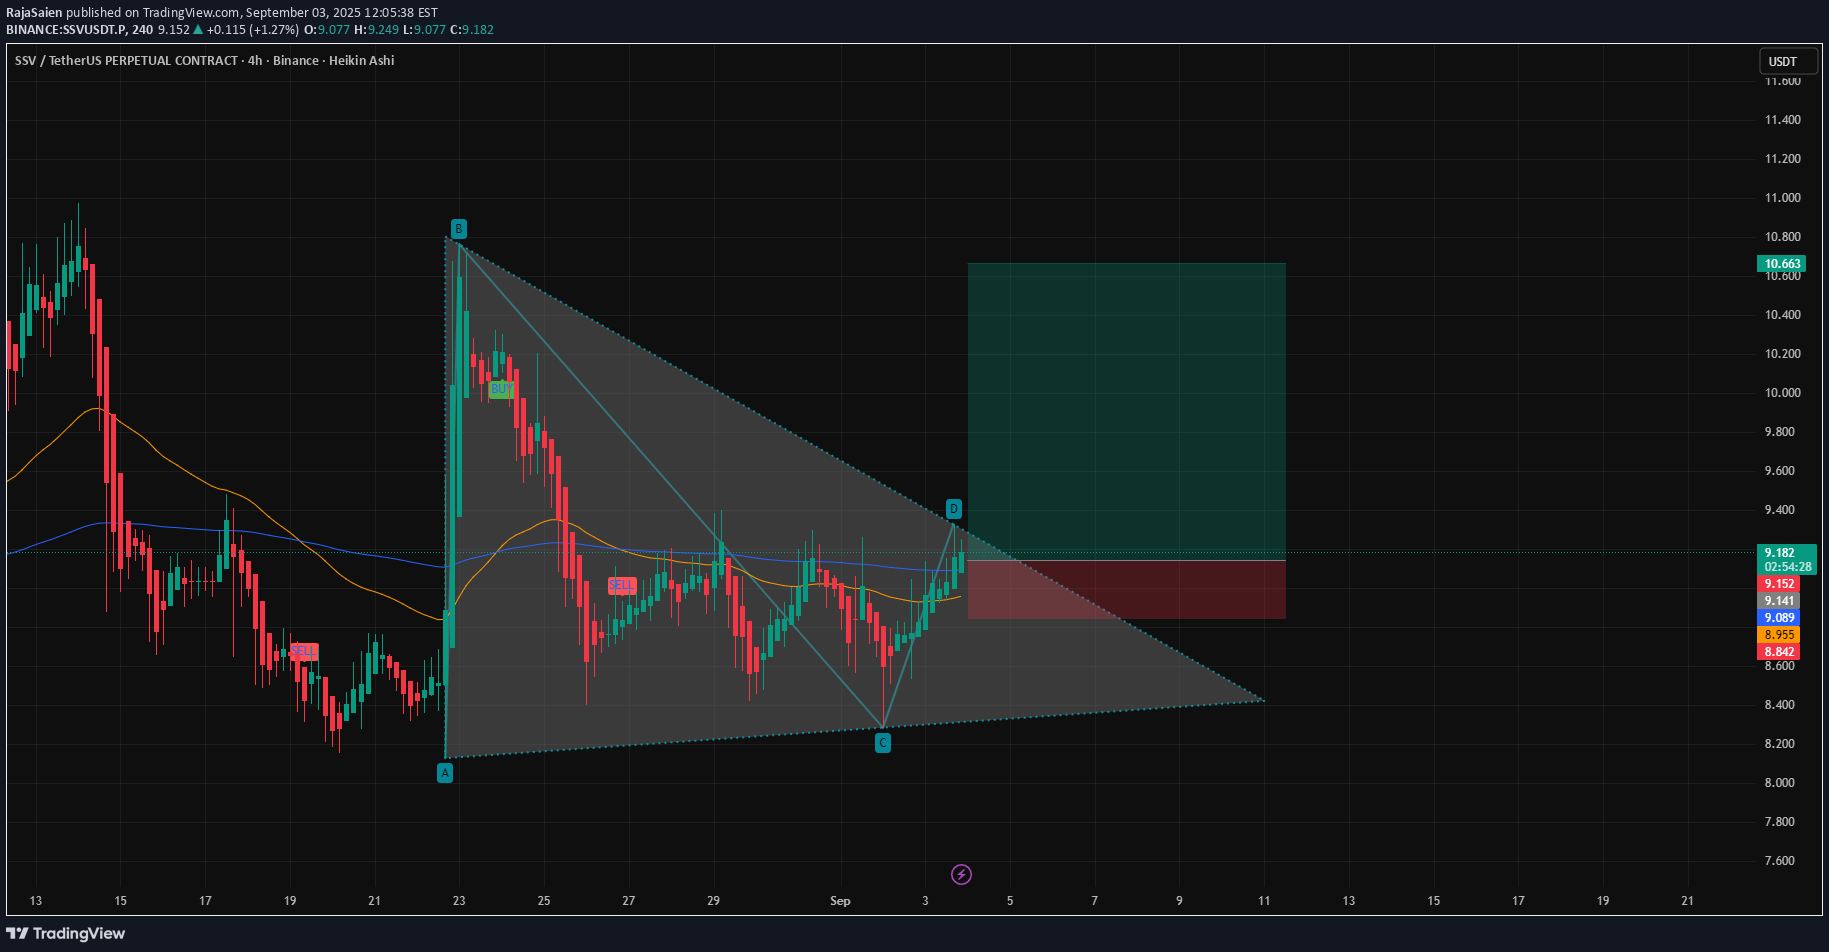
1. Pattern The chart is showing a descending triangle / falling wedge structure (A–B–C–D). Price has moved up strongly from point C → D, now testing the upper trendline resistance. If breakout happens above 9.20–9.30, bullish momentum can accelerate. 2. Key Levels Immediate Resistance: 9.20 – 9.30 (trendline + supply zone). Next Targets: TP1 → 9.60 TP2 → 10.20 TP3 → 11.00 (extended breakout target). Support Levels: 9.00 (short-term EMA + round number). 8.95 (200 EMA). 8.60 (lower wedge support). 3. Indicators EMA Structure: Price is trading just above 50 EMA (orange) and 200 EMA (blue) → early bullish signal. If 50 EMA crosses 200 EMA, trend confirmation will strengthen. Momentum: Recent bullish candles show strength; watch for volume confirmation. 4. Scenarios Bullish (High Probability): Break and close above 9.30 → opens the way to 9.60 → 10.20 → 11.00. Bearish (Low Probability): If rejection occurs, price may retest 9.00 → 8.95 support, possibly even 8.60. 📌 Trading Plan Entry (Aggressive): Current zone (9.15–9.20), anticipating breakout. Entry (Conservative): Wait for 4H candle close above 9.30. Stop Loss: Below 8.85 (safe zone under support). Targets: 🎯 TP1: 9.60 🎯 TP2: 10.20 🎯 TP3: 11.00 ✅ Summary: SSV/USDT is at a decisive point near resistance. A breakout above 9.30 will likely confirm a bullish move toward 10+. Until then, caution advised with a stop below 8.85 to manage risk.

The_Alchemist_Trader_
SSV continues to trade within a high timeframe equilibrium
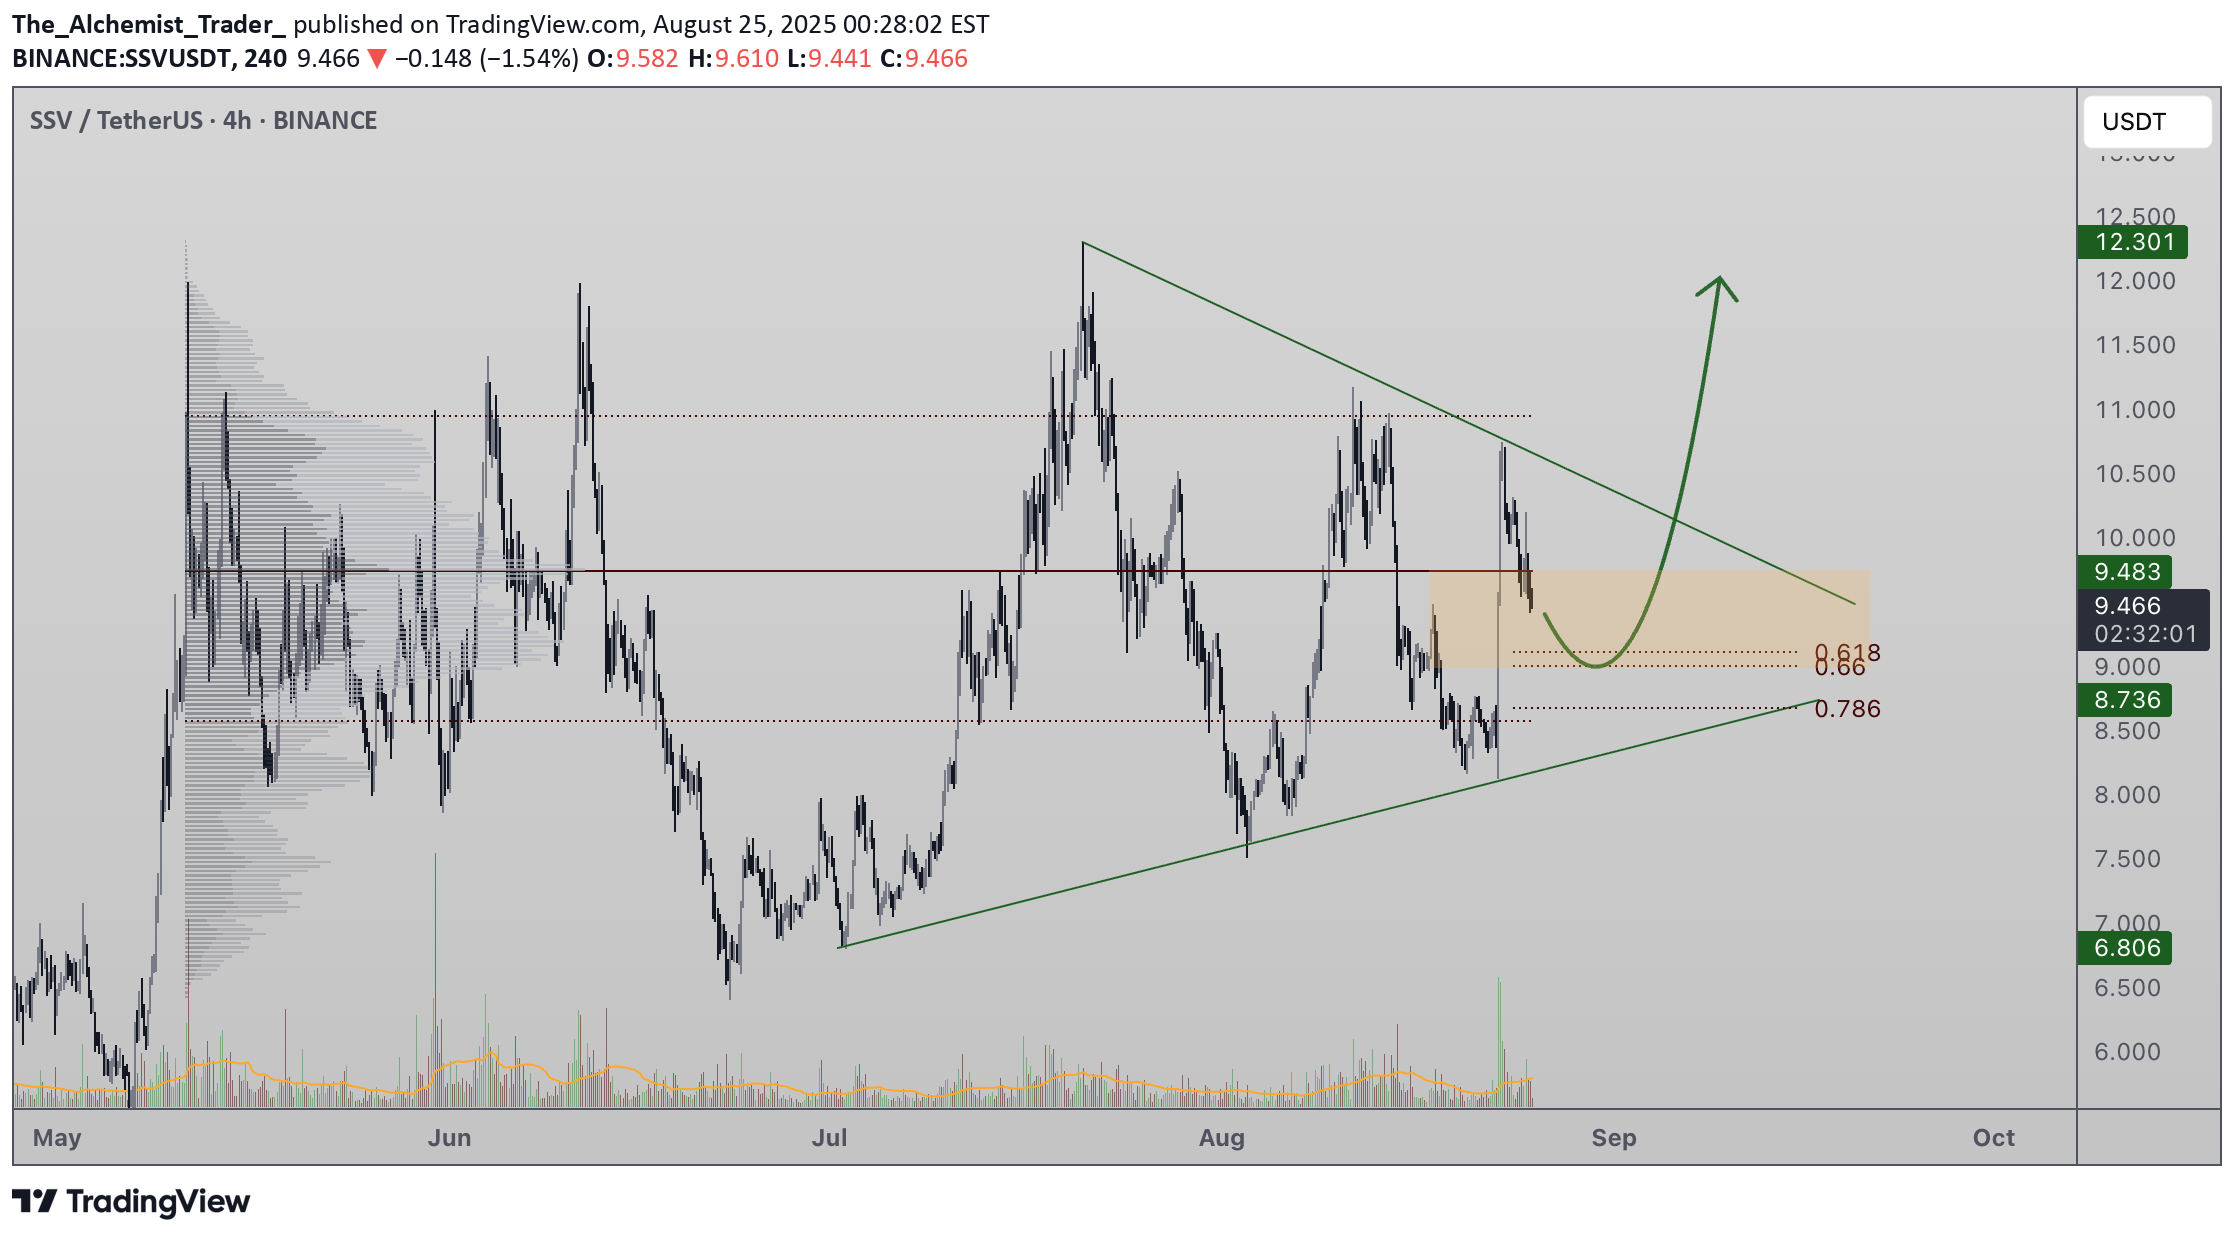
SSV continues to trade within a high timeframe equilibrium, with dynamic support and resistance levels gradually converging near the point of control. This compression has formed an apex zone where price action is coiling, setting the stage for a decisive breakout. Despite the tightening range, the broader structure maintains a bullish bias, with consecutive higher highs and higher lows still intact. Key Technical Points: - Equilibrium Structure: Dynamic support and resistance levels are converging at the point of control, creating an apex zone. - 0.618 Fibonacci Support: Price must hold above this retracement level to maintain the higher-low projection. - Volume Influx: Strong volume activity is occurring at the apex, suggesting accumulation before expansion. SSV’s current consolidation highlights a balanced battle between buyers and sellers, but the high timeframe structure leans in favor of the bulls. The repeated formation of higher lows and higher highs indicates that demand continues to step in at key levels, while supply is being gradually absorbed at resistance. This equilibrium around the point of control is compressing into an apex — a classic signal that volatility expansion is imminent. The 0.618 Fibonacci retracement has emerged as a crucial pivot for maintaining the bullish trajectory. If price remains above this support on pullbacks, the integrity of the uptrend will hold, allowing for another rotation higher. Even in the case of a deeper retracement, as long as the dynamic support and high-low projection are respected, the structural bullish case remains intact. From a volume perspective, strong influxes are already present around the apex, hinting at active accumulation. However, for continuation to the upside and a potential retest of the all-time highs, a decisive breakout must be backed by sustained bullish volume. Without that, the risk of prolonged consolidation remains, but the larger structure still favors eventual continuation higher. Overall, the price action and market structure are aligned, with technical confluences supporting the case for bullish continuation. The apex compression should soon resolve, and given the prevailing higher timeframe trend, probabilities lean toward an upward breakout. What to Expect in the Coming Price Action: SSV is preparing for a breakout from its current apex formation. As long as the 0.618 Fibonacci support and dynamic structure are respected, the bias remains bullish. A volume-backed breakout to the upside would likely target a retest of the all-time highs, while a pullback into dynamic support should be viewed as a potential accumulation opportunity before continuation higher.

Crypto_alphabit
SSV (SPOT)
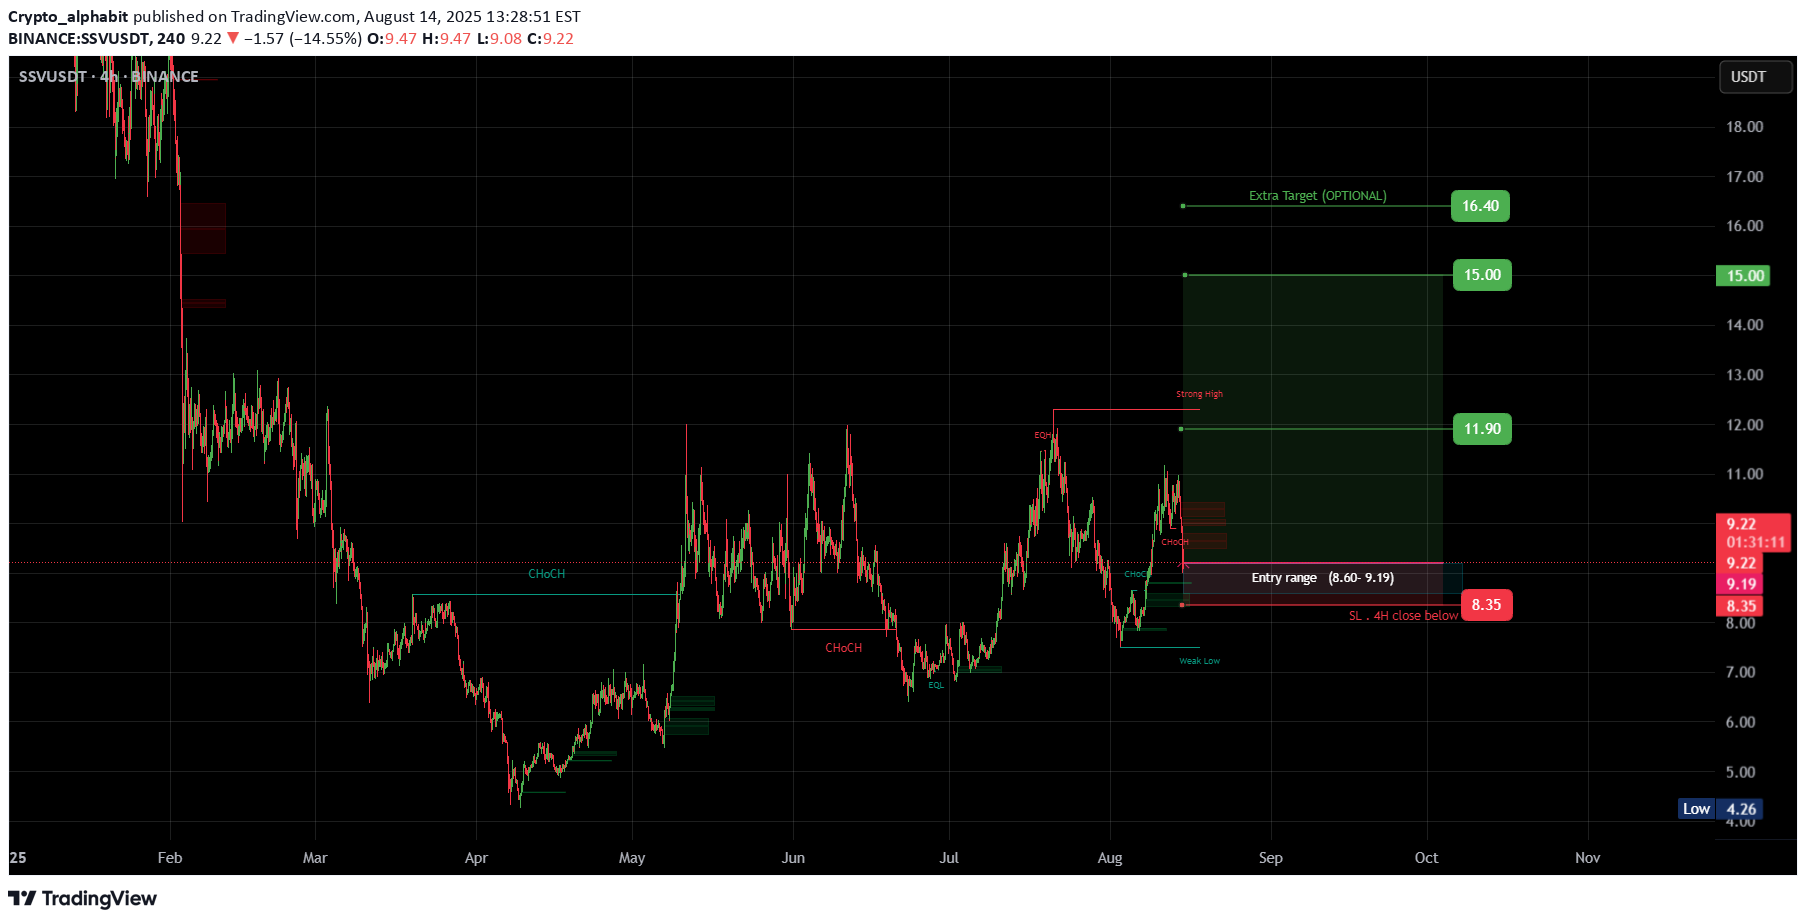
SSVUSDT #SSV/ USDT Entry range (8.60- 9.19) SL 4H close below8.35 T1 11.90 T2 15.00 _______________________________________________________ Golden Advices. ******************** * collect the coin slowly in the entry range. * Please calculate your losses before the entry. * Do not enter any trade you find it not suitable for you. * No FOMO - No Rush , it is a long journey.

Jawad_Crypto
SSVUSDT

Breakout the trendline and have a chance to go high and higher its your responsibility to buy or sell.
Disclaimer
Any content and materials included in Sahmeto's website and official communication channels are a compilation of personal opinions and analyses and are not binding. They do not constitute any recommendation for buying, selling, entering or exiting the stock market and cryptocurrency market. Also, all news and analyses included in the website and channels are merely republished information from official and unofficial domestic and foreign sources, and it is obvious that users of the said content are responsible for following up and ensuring the authenticity and accuracy of the materials. Therefore, while disclaiming responsibility, it is declared that the responsibility for any decision-making, action, and potential profit and loss in the capital market and cryptocurrency market lies with the trader.