
SPX
SPX6900
| تریدر | نوع سیگنال | حد سود/ضرر | زمان انتشار | مشاهده پیام |
|---|---|---|---|---|
No results found. | ||||
Price Chart of SPX6900
سود 3 Months :
سیگنالهای SPX6900
Filter
Sort messages by
Trader Type
Time Frame

Saitamasignal
SPX potential breakout
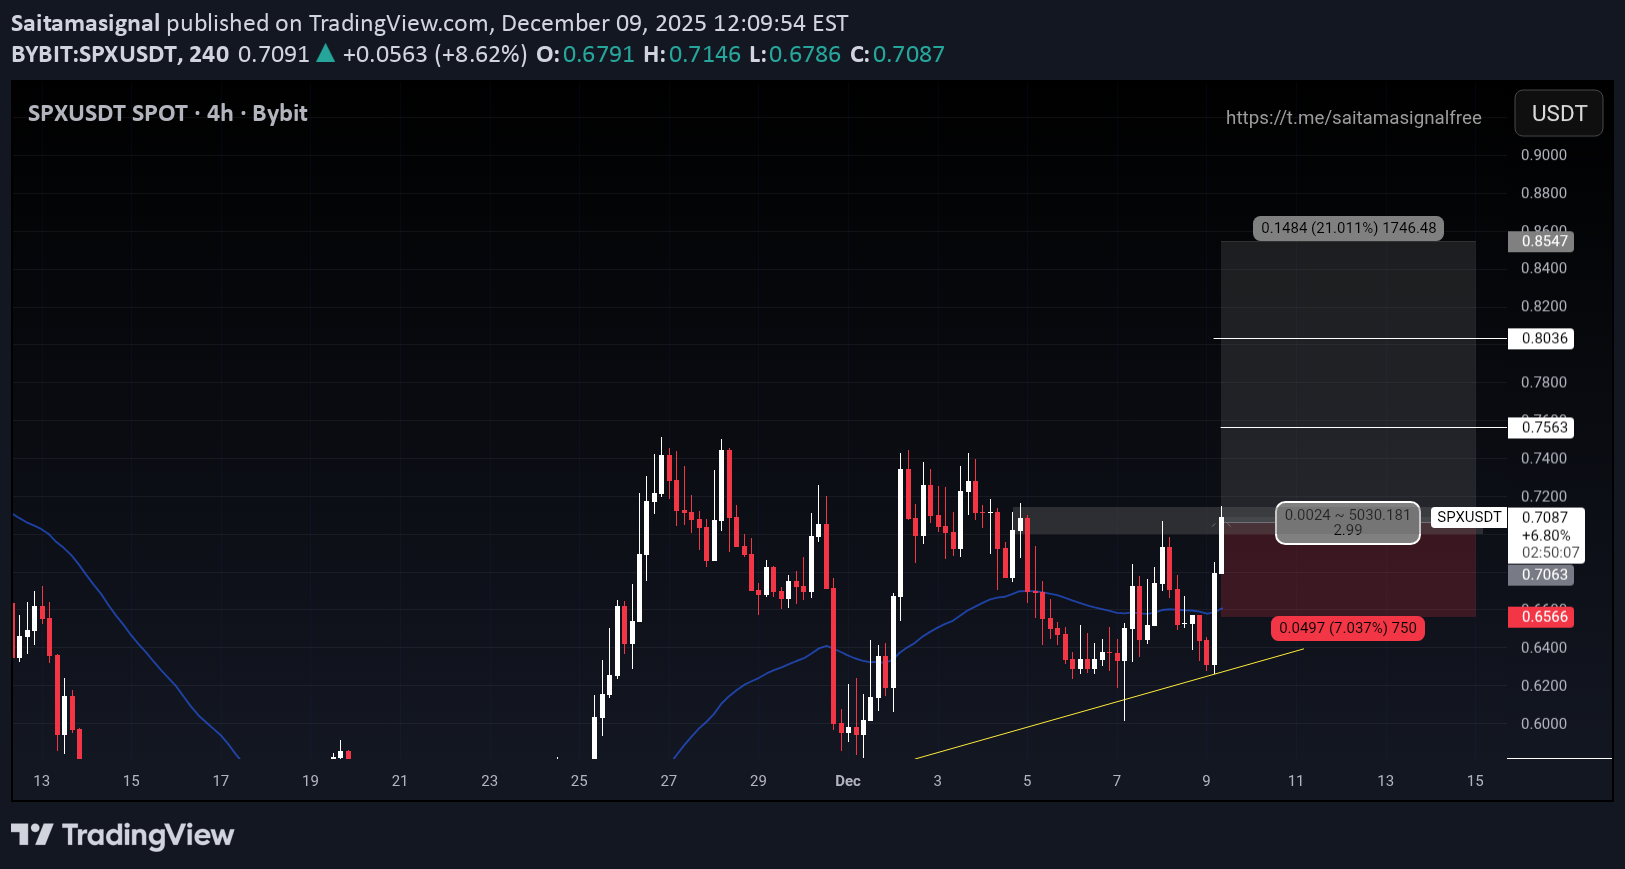
COIN NAME : SPXUSDT ( isolated ) Buy long zone : 1) 0.7063 Take profit : 1) 0.7563 2) 0.8036 3) 0.8547 Stop loss : 0.6566 Max leverage: 7x Amount : 2.0% Disclaimer: This is not financial advice. Always do your own research and use strict risk management. The crypto market is highly volatile.

BandForBands
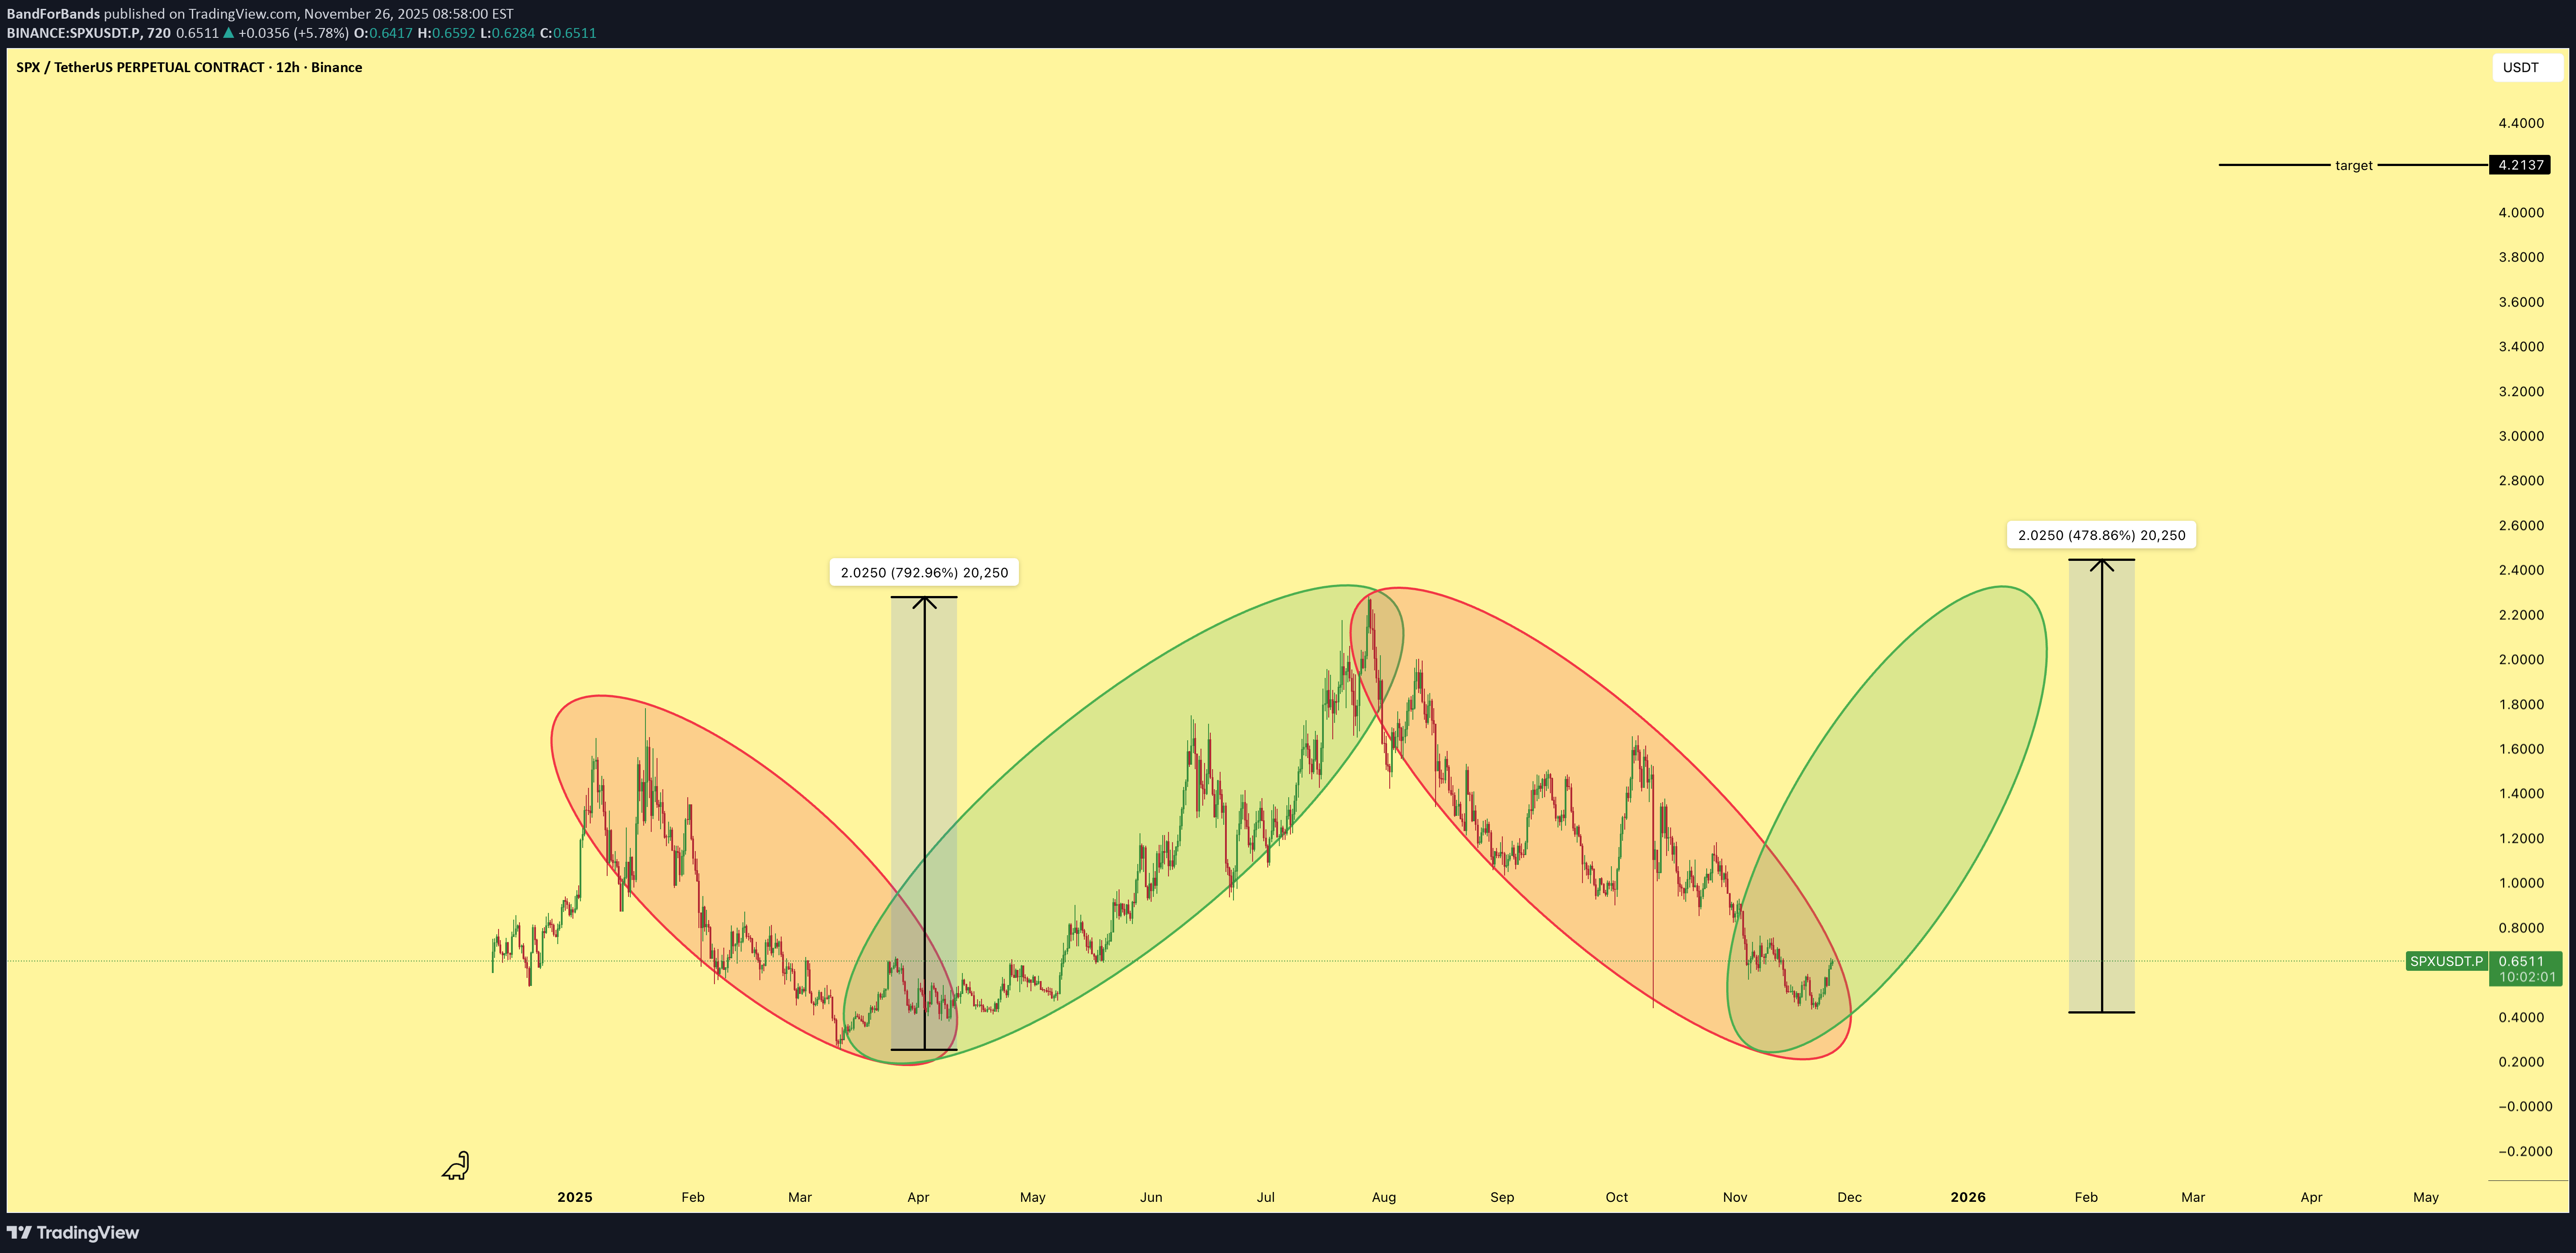
هدف نهایی SPX کجاست؟ رمزگشایی از هدف ۴.۲ دلاری برای شاخص S&P 500
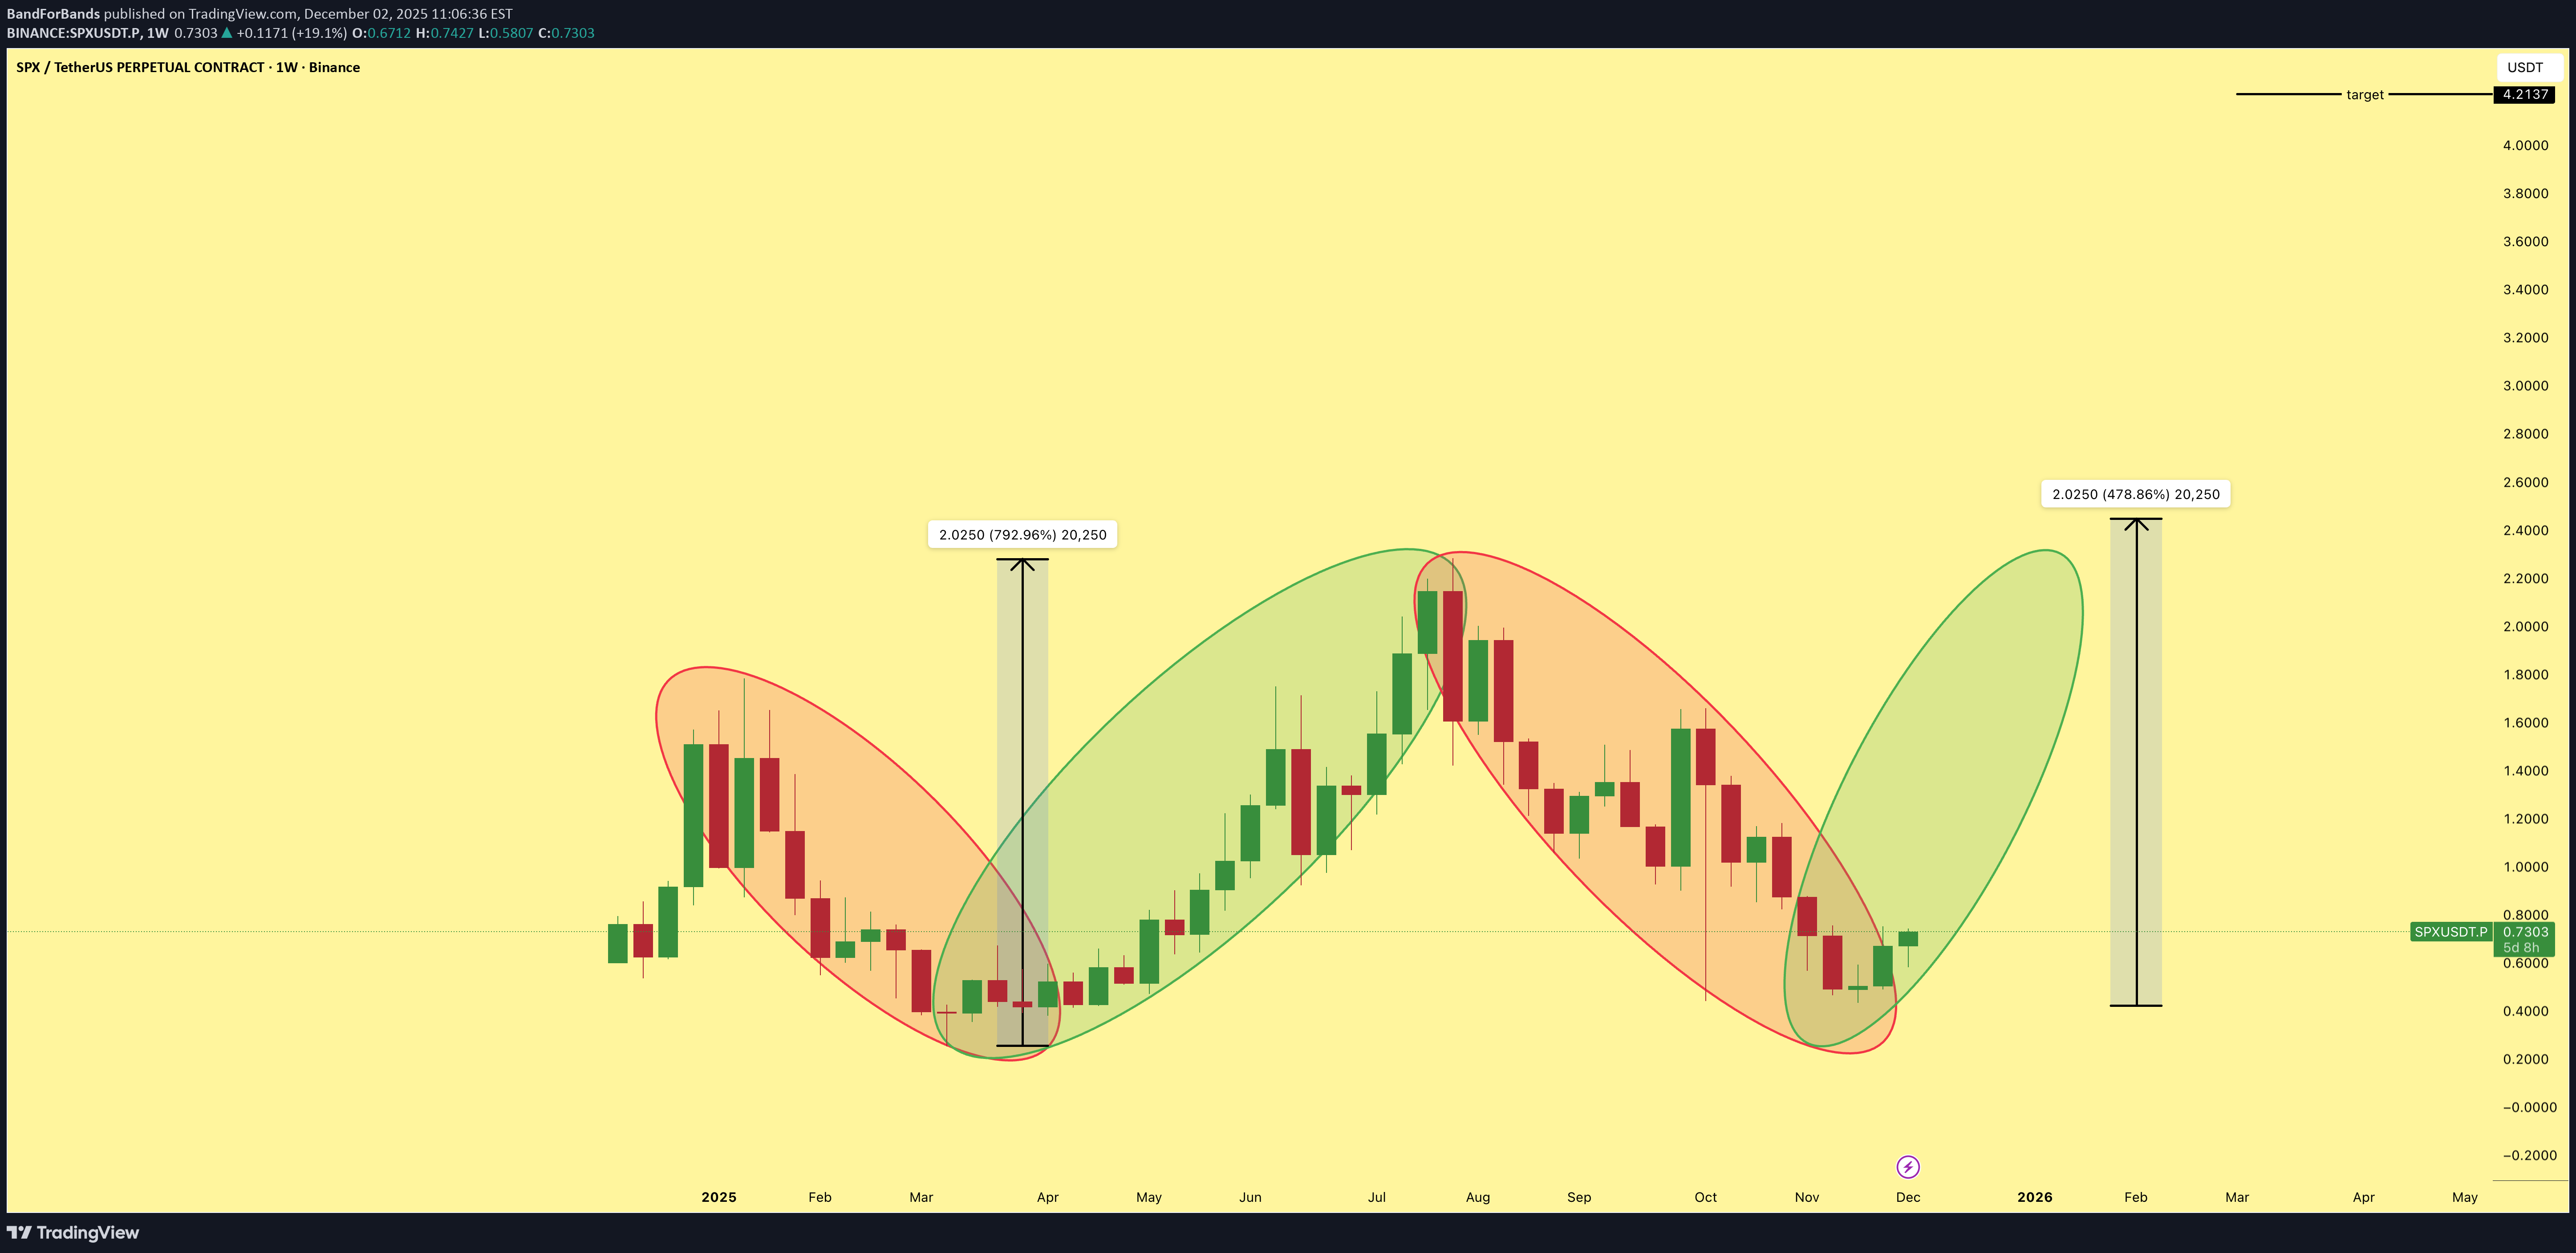
$4.2 is the target for $SPX. We collectively entered at the bottom and we are holding to $4.2 because we believe in something. The structure is clean, momentum is building, and the trend is on our side.

sladkamala123
SPX: آیا سقوط تمام شده؟ تحلیل کلیدی حمایت و مقاومت مهم
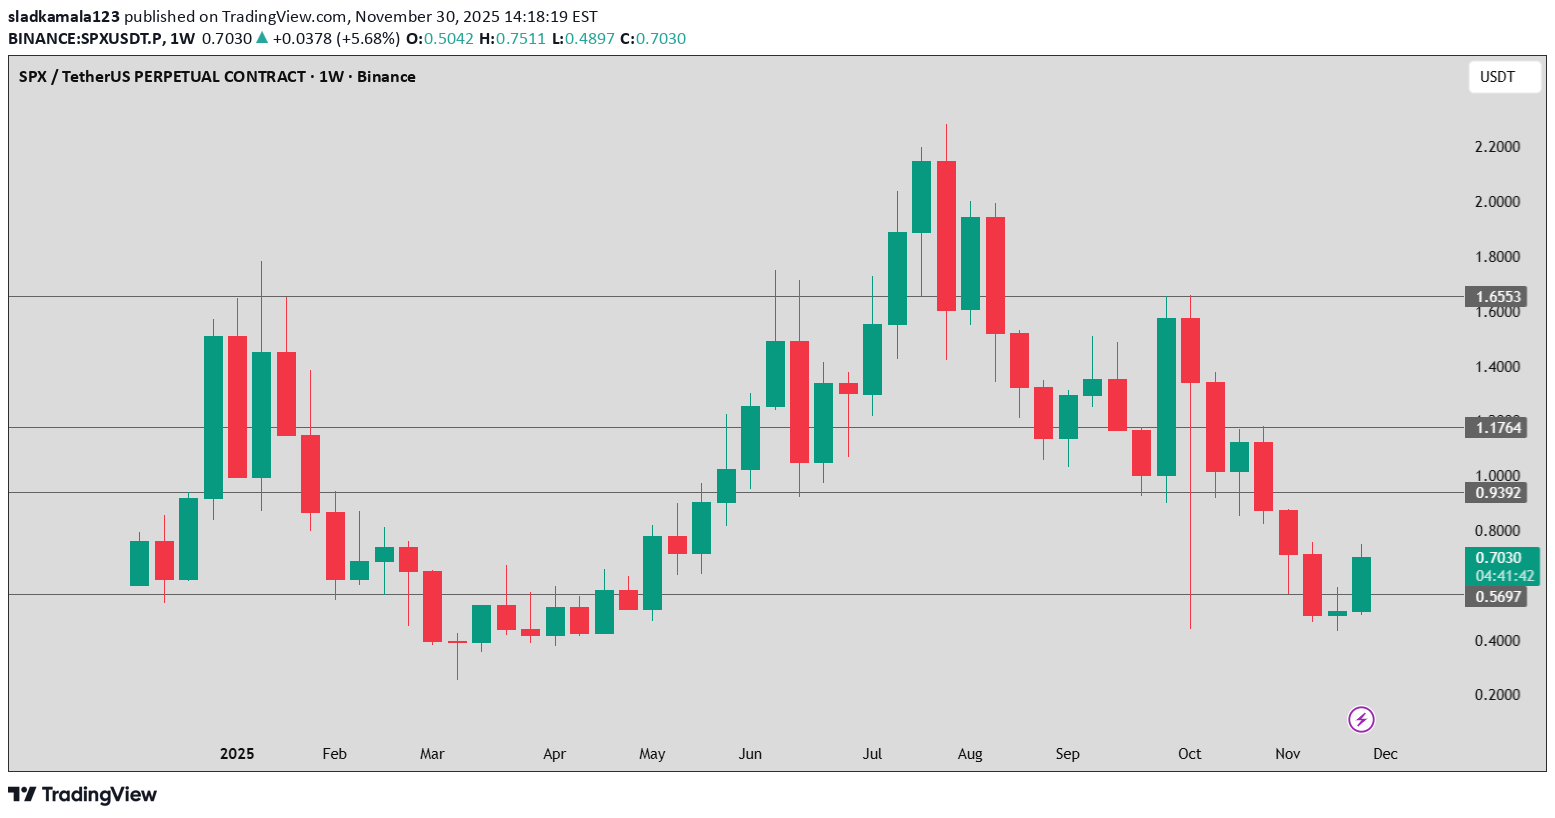
SPX is in a broad downtrend after a full bull cycle. The recent green candle indicates a temporary bounce, not a confirmed reversal. Key resistance: 1.00 USDT Key support: 0.5697 USDT A break above 1.00 would be the first real bullish confirmation.

iMoneyTeam
تحلیل تکنیکال SPX: منتظر سقوط بیشتر با اهداف مشخص (استراتژی فروش)
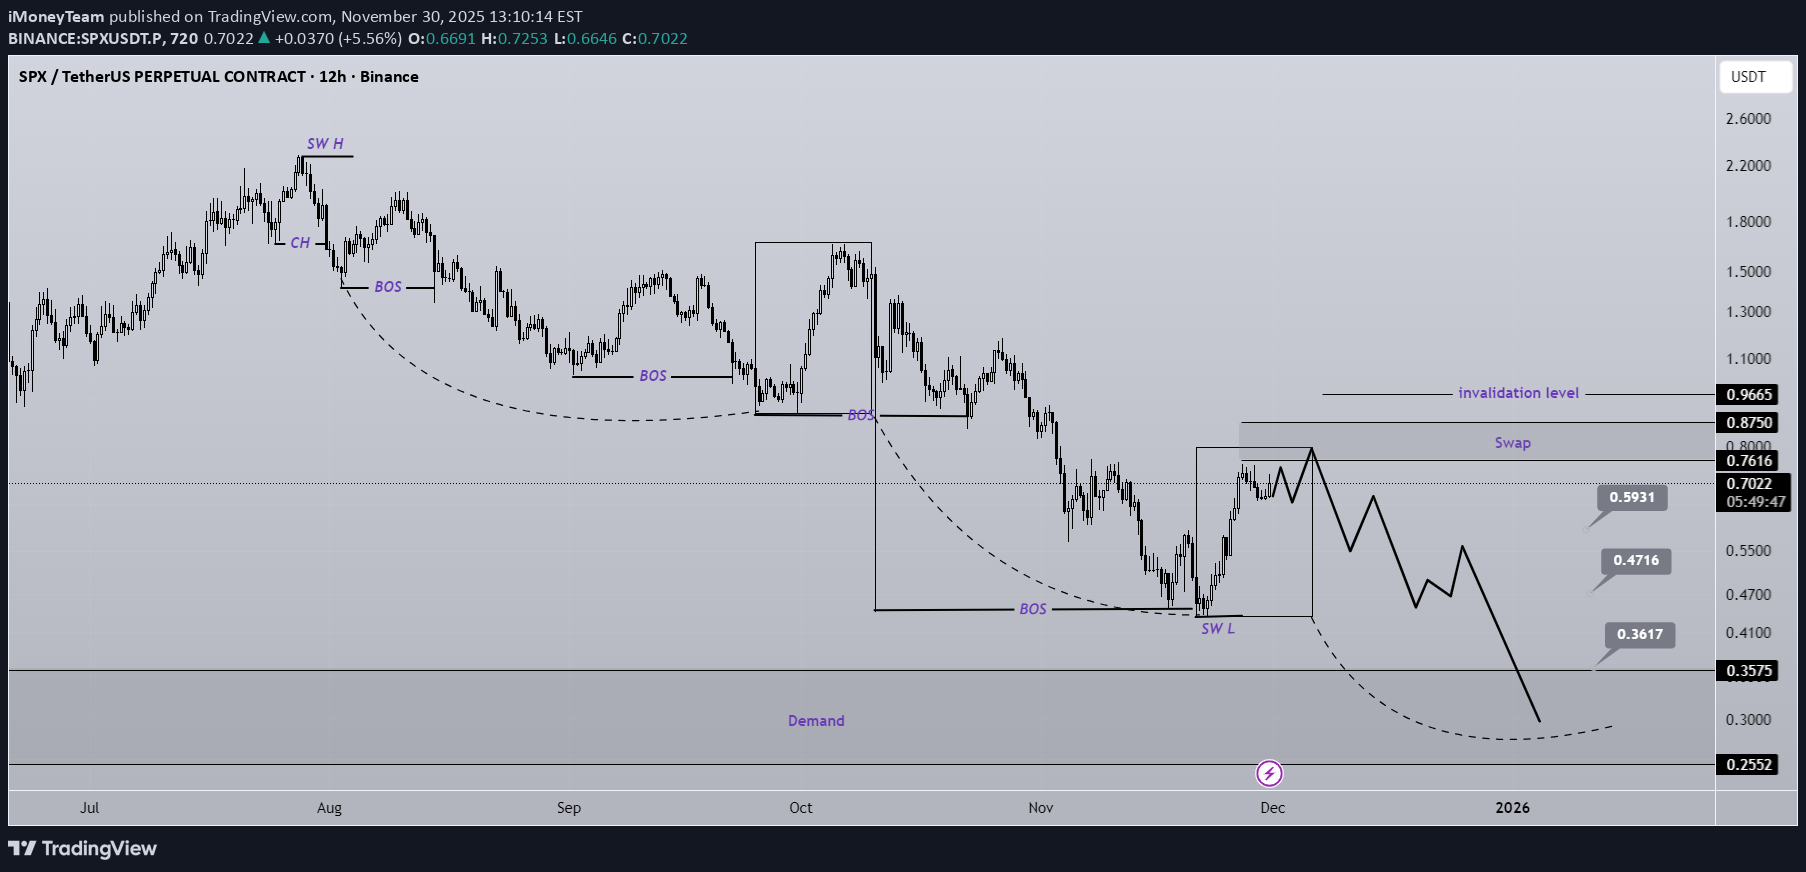
As shown on the chart, the SPX structure is bearish because we have bearish CH (Change of Character) and BOS (Break of Structure). Based on the fractals indicated with dashed lines and the drawn rectangles, we should expect one more bearish leg in this timeframe. We are looking for sell/short positions around the swap zone. The targets have been marked on the chart. A daily candle closing above the invalidation level will invalidate this analysis. Do not enter the position without capital management and stop setting Comment if you have any questions thank you

WaveRiders2
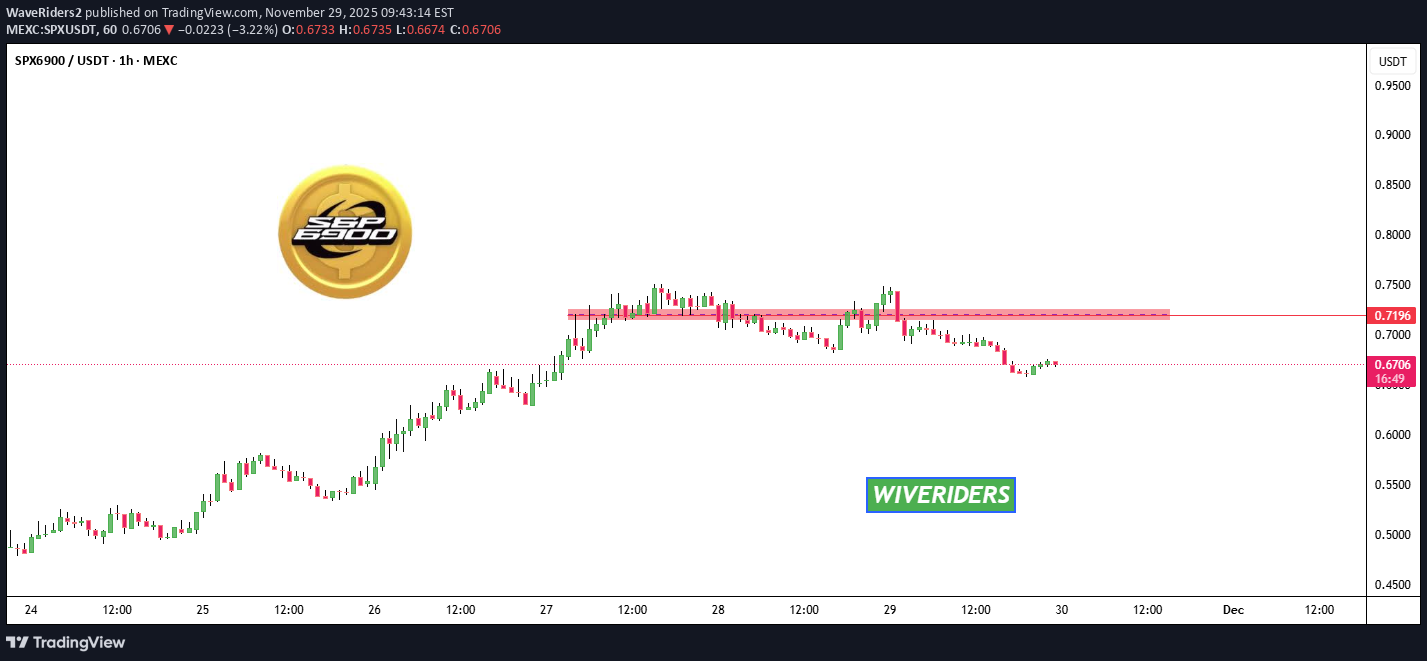
مقاومت جدید SPX: سقف قرمز بازار کجاست و چه زمانی خریداران قدرت میگیرند؟

TuffyBro
پیشنهاد معامله فروش SPX: آیا این ارز دیجیتال غیرمنتظره قوی است؟
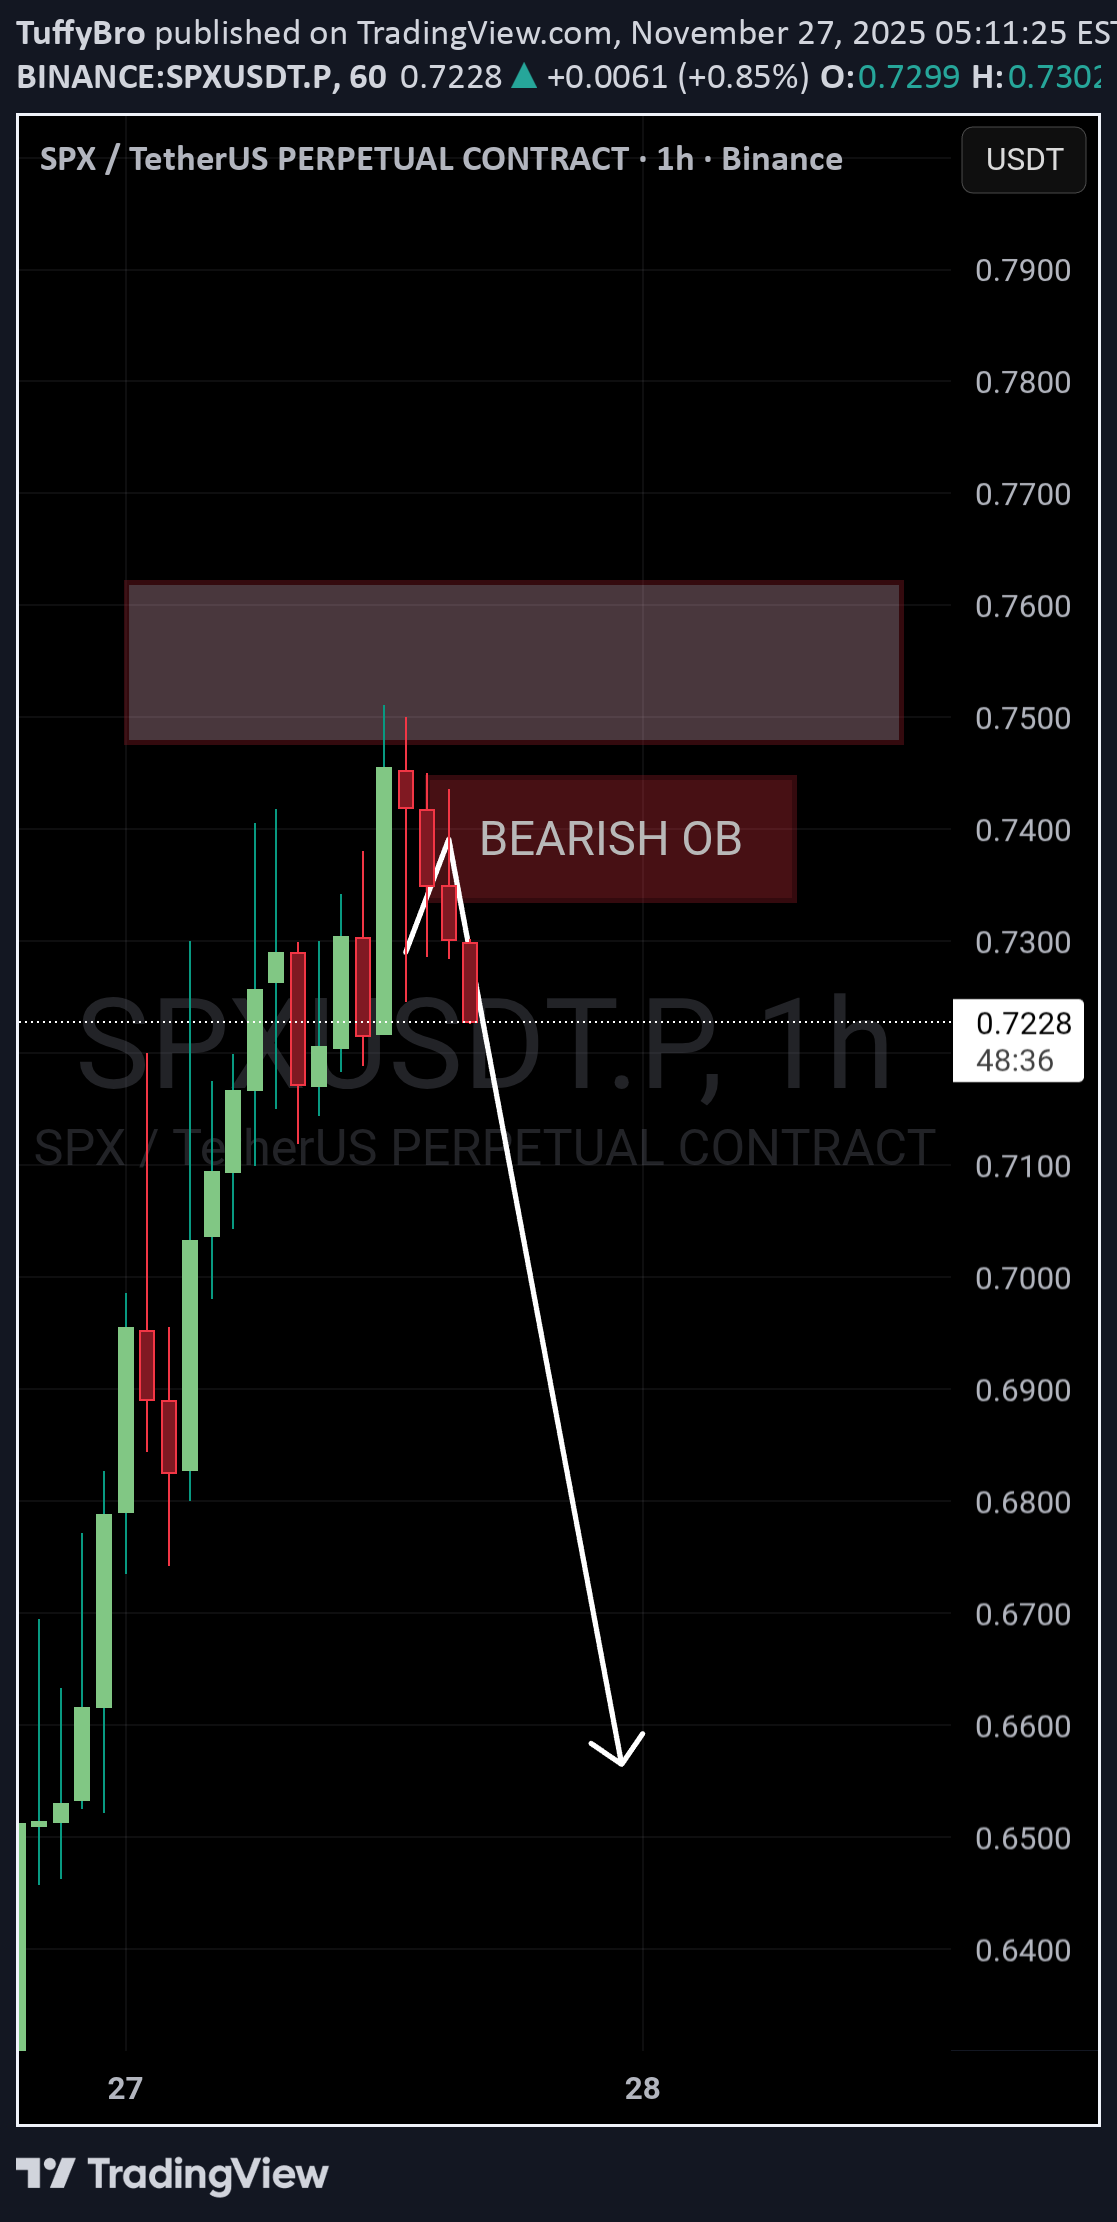
↳Shorting SPX6900 here, not sure why this shitcoin is so strong Note: not a lot of liquidity/volume on Hyperliquid, Binance futures better, if you trade other exchanges check liquidity.1.5r done to get proper signal join my premium
WaveRiders2
BandForBands
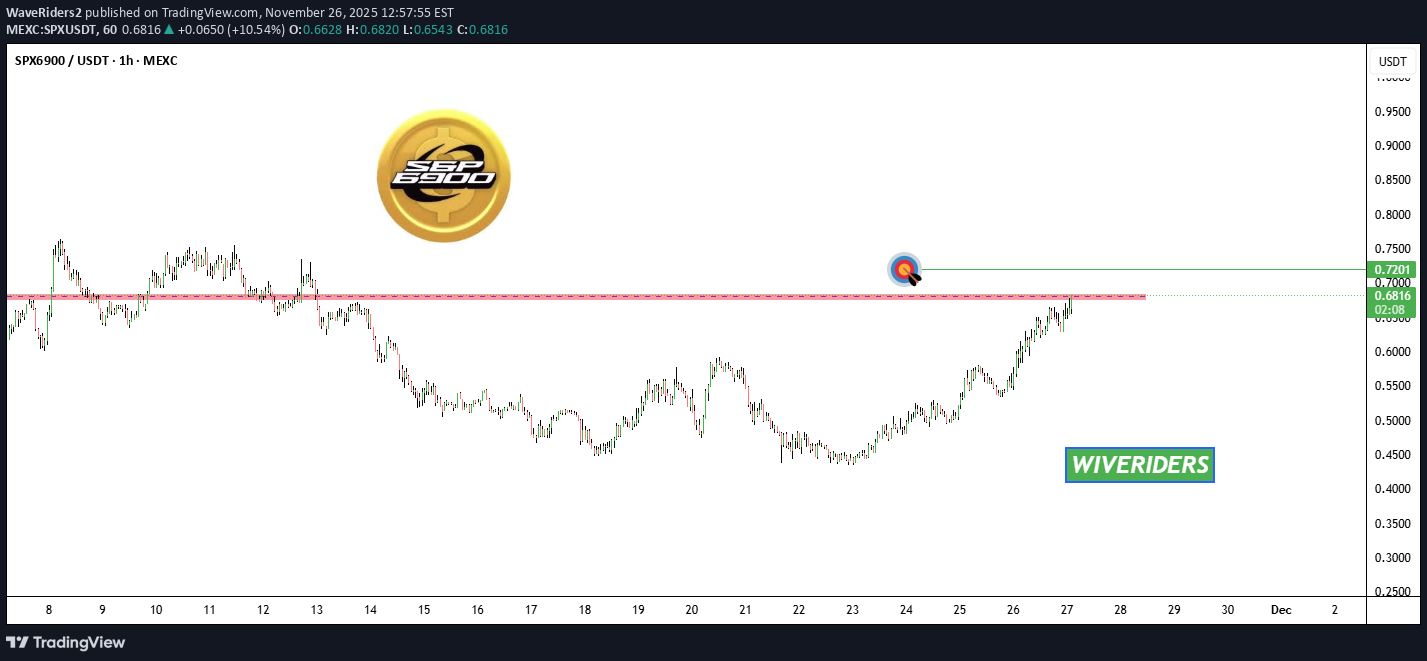
تحلیل SPX: آیا کف بازار زده شد؟ حرکت بزرگ صعودی بعدی آغاز میشود!
You can clearly see what is happening with $SPX. It has bottomed. We had downtrend, uptrend, downtrend, and now it is time for the next uptrend. The structure points straight toward a move to $4 plus. Momentum is shifting and the rotation is lining up.
c_views
الگوی دوقلو در SPX: آیا سقوط نهایی آغاز میشود؟
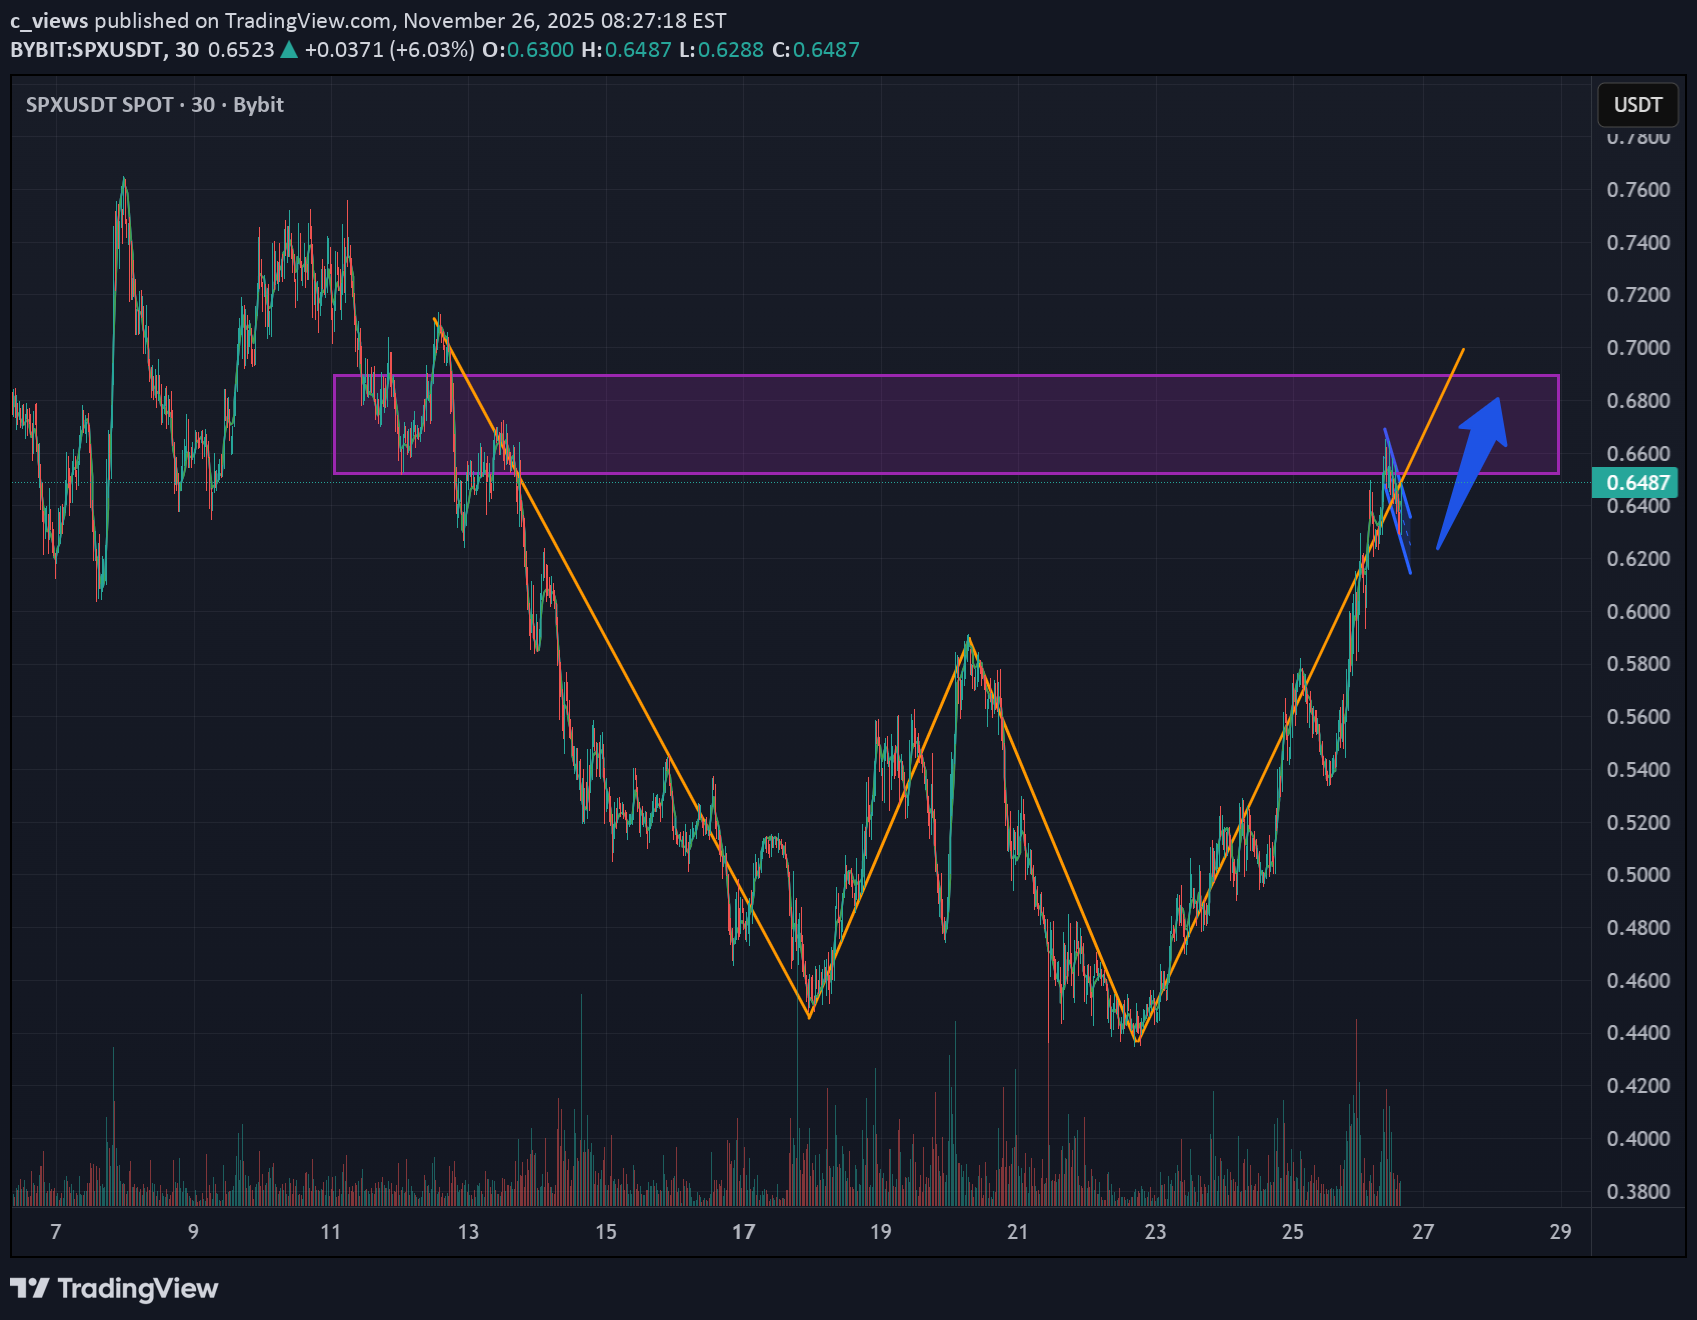
The SPX has formed a global W pattern, or double bottom , and is currently in the final phase of the formation, which is likely to reach the liquidation zone highlighted in purple. Current price: $0.6333 If the price breaks the level where the previous peak bottomed, the ascending structure is more likely to be broken, and the movement may continue downward. Full breakdown on website
WaveRiders2
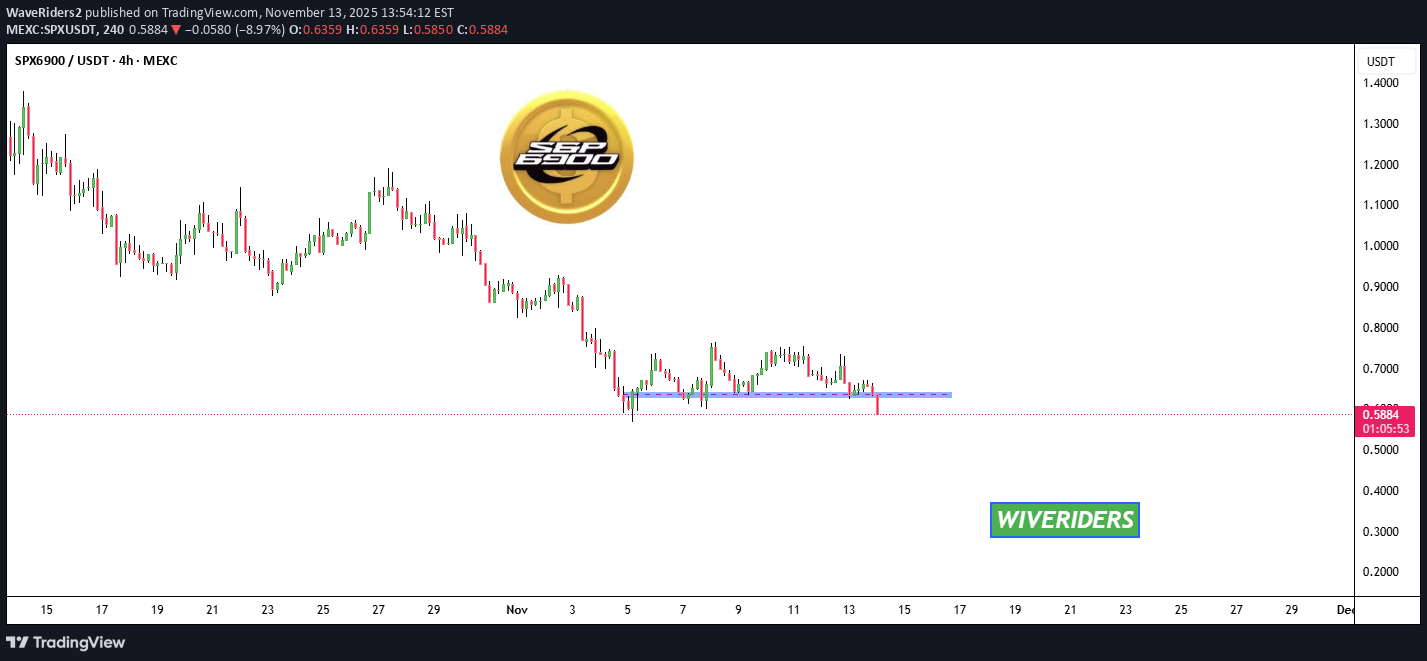
هشدار تحلیل تکنیکال: سقوط SPX زیر سطح حیاتی آبی – آیا بازار نزولی میشود؟
Disclaimer
Any content and materials included in Sahmeto's website and official communication channels are a compilation of personal opinions and analyses and are not binding. They do not constitute any recommendation for buying, selling, entering or exiting the stock market and cryptocurrency market. Also, all news and analyses included in the website and channels are merely republished information from official and unofficial domestic and foreign sources, and it is obvious that users of the said content are responsible for following up and ensuring the authenticity and accuracy of the materials. Therefore, while disclaiming responsibility, it is declared that the responsibility for any decision-making, action, and potential profit and loss in the capital market and cryptocurrency market lies with the trader.