
SAND
The Sandbox
| تریدر | نوع سیگنال | حد سود/ضرر | زمان انتشار | مشاهده پیام |
|---|---|---|---|---|
خرید | حد سود: تعیین نشده حد ضرر: تعیین نشده | 12/15/2025 |

Price Chart of The Sandbox
سود 3 Months :
سیگنالهای The Sandbox
Filter
Sort messages by
Trader Type
Time Frame
Sandbox (SAND): Eyes on Middle Line of Bollinger Bands
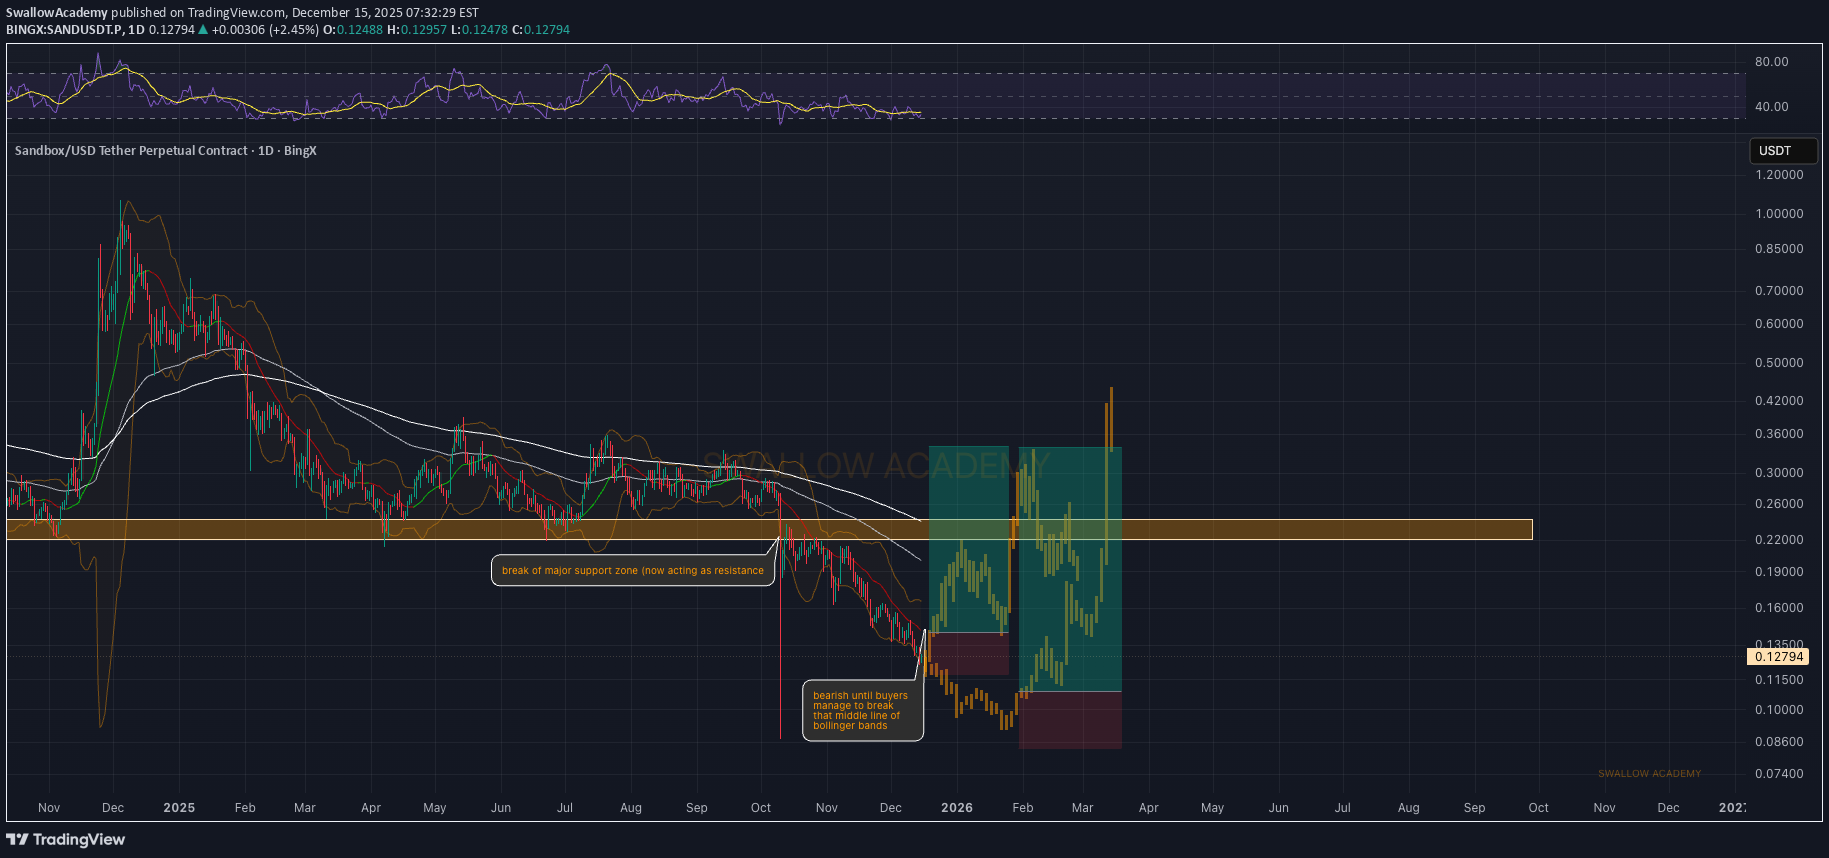
SAND is still under pressure and the price is riding the lower side of the Bollinger Bands, which tells us the short-term trend is still bearish. There’s no real relief bounce yet and sellers are clearly keeping control for now. From here it’s simple: either we get a bounce from this lower BB area, or the price keeps sliding lower. If we do see a bounce, the key thing to watch will be a clean break back above the middle Bollinger line. That’s the level buyers need to reclaim to shift momentum and make a proper long idea valid. Until that happens, it’s still a wait for confirmation of the spot. Swallow Academy
تحلیل SAND: آیا زمان ورود به خرید یا ریزش بیشتر فرا رسیده است؟
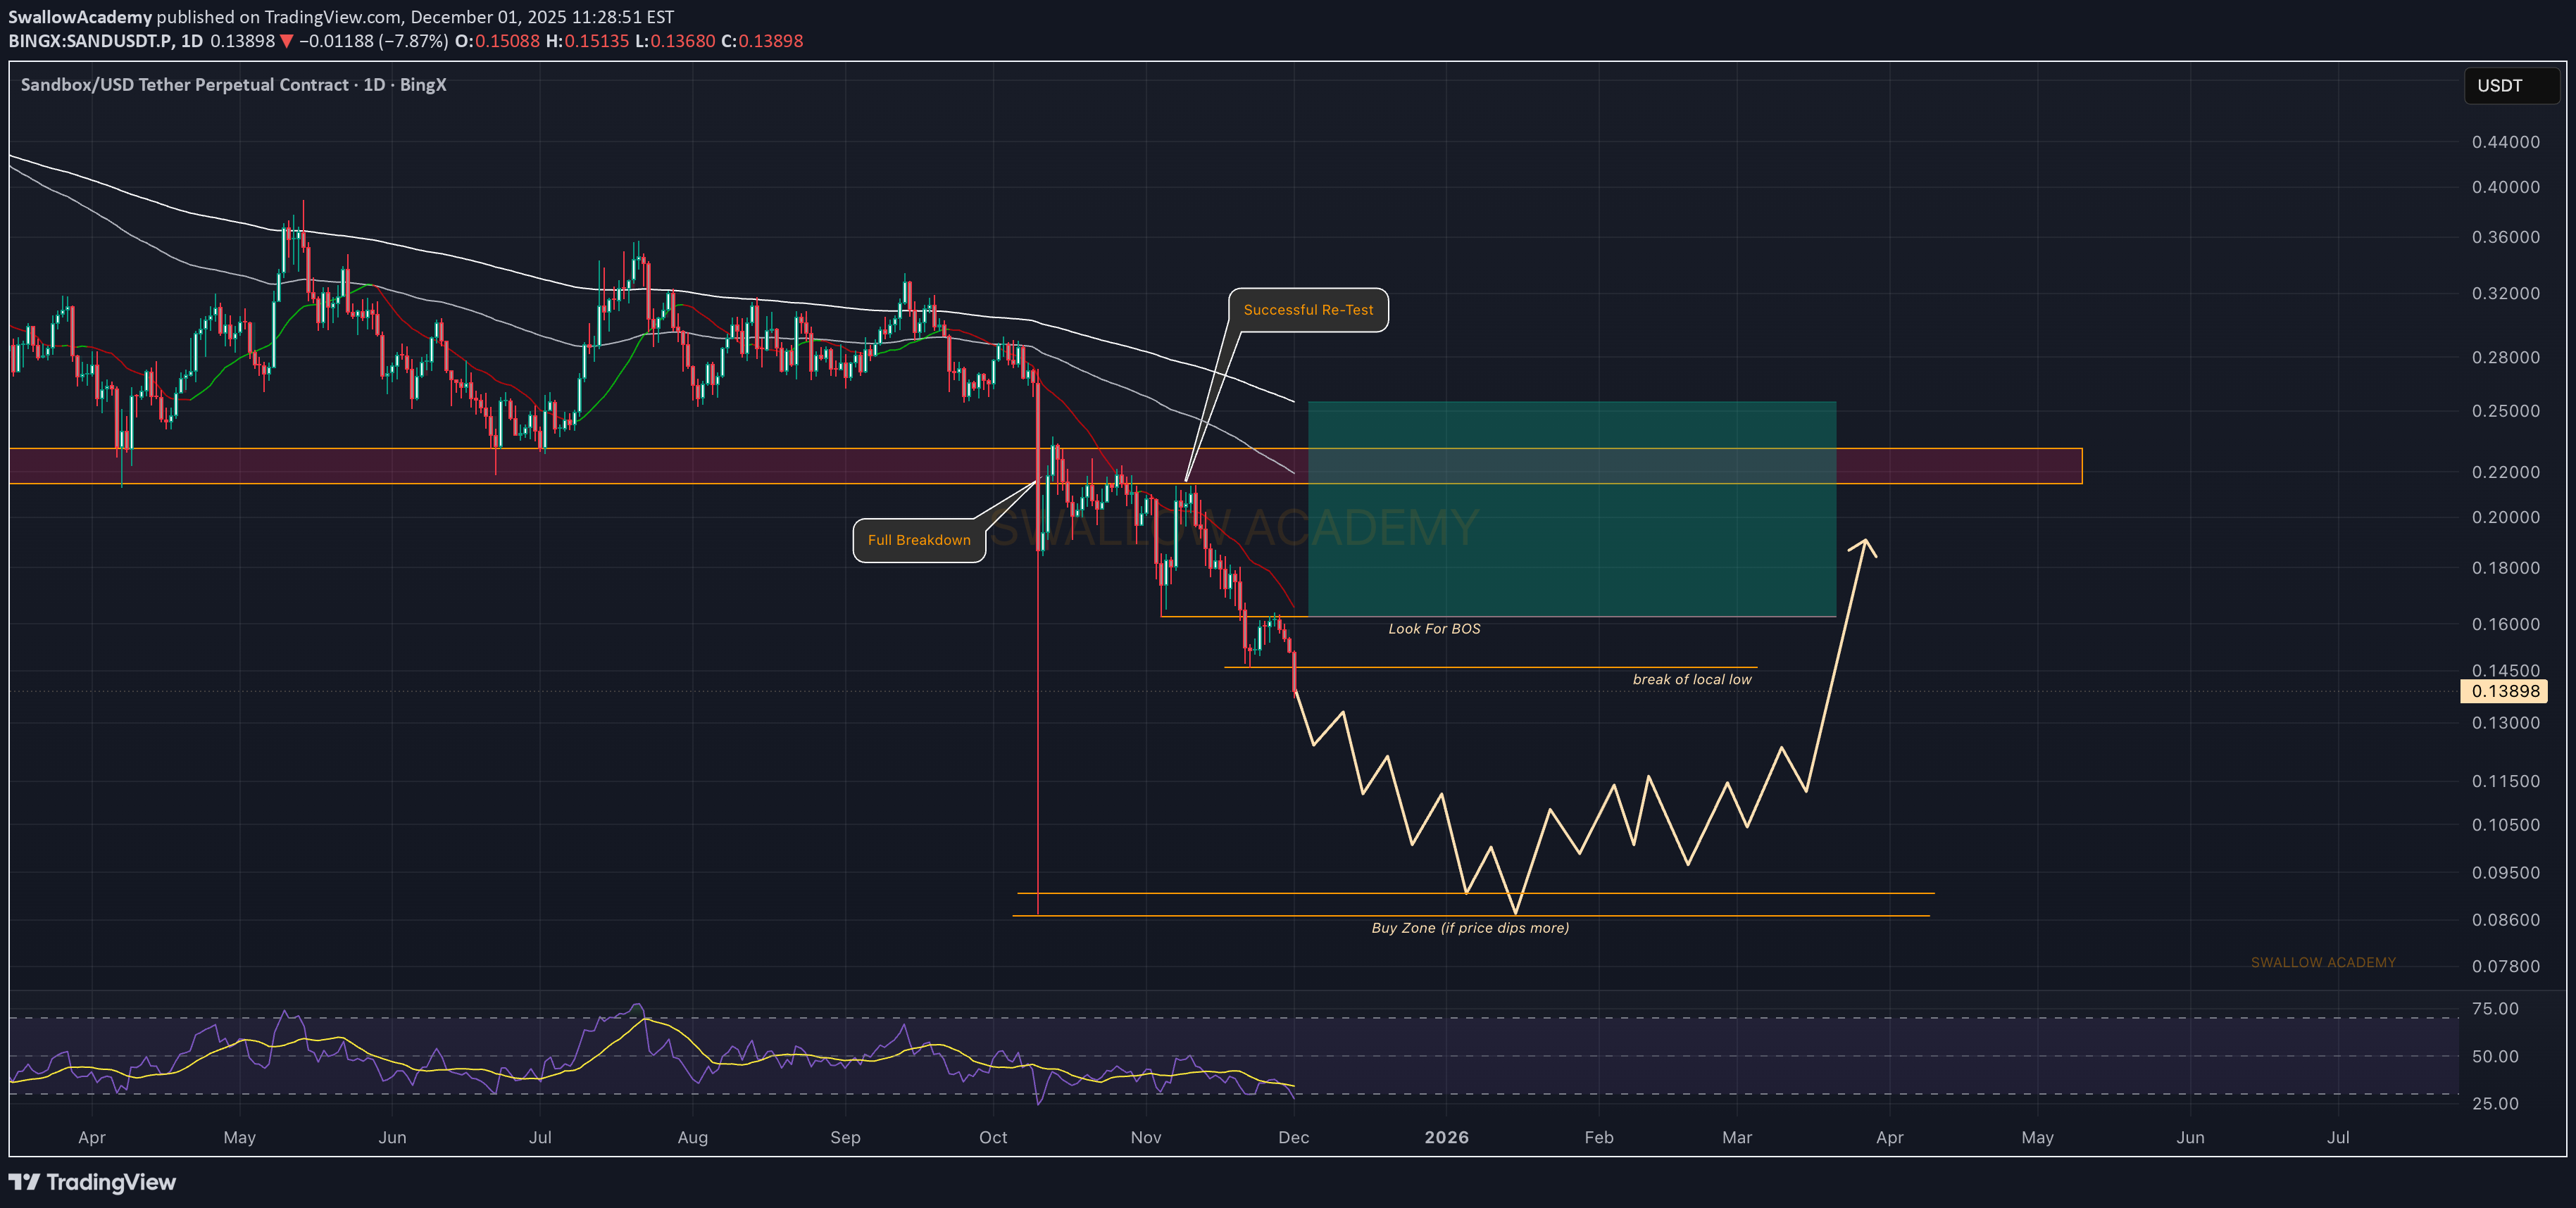
SAND broke down fully from its previous structure and is now sitting below all key levels. For now the chart still leans bearish, and as long as sellers keep control we might see one more push lower into the deeper buy zone. That’s where the better risk-to-reward setup would form. If buyers manage to flip momentum earlier and give us a clean shift or reversal pattern above the current local low, we can look for a short-term bounce toward the upper resistance. Until then — patience. Let the chart show who’s in control. Swallow Academy

خرید کمریسک SAND: سیگنال طلایی شکست الگوی گُوِه نزولی در تایم فریم 12 ساعته
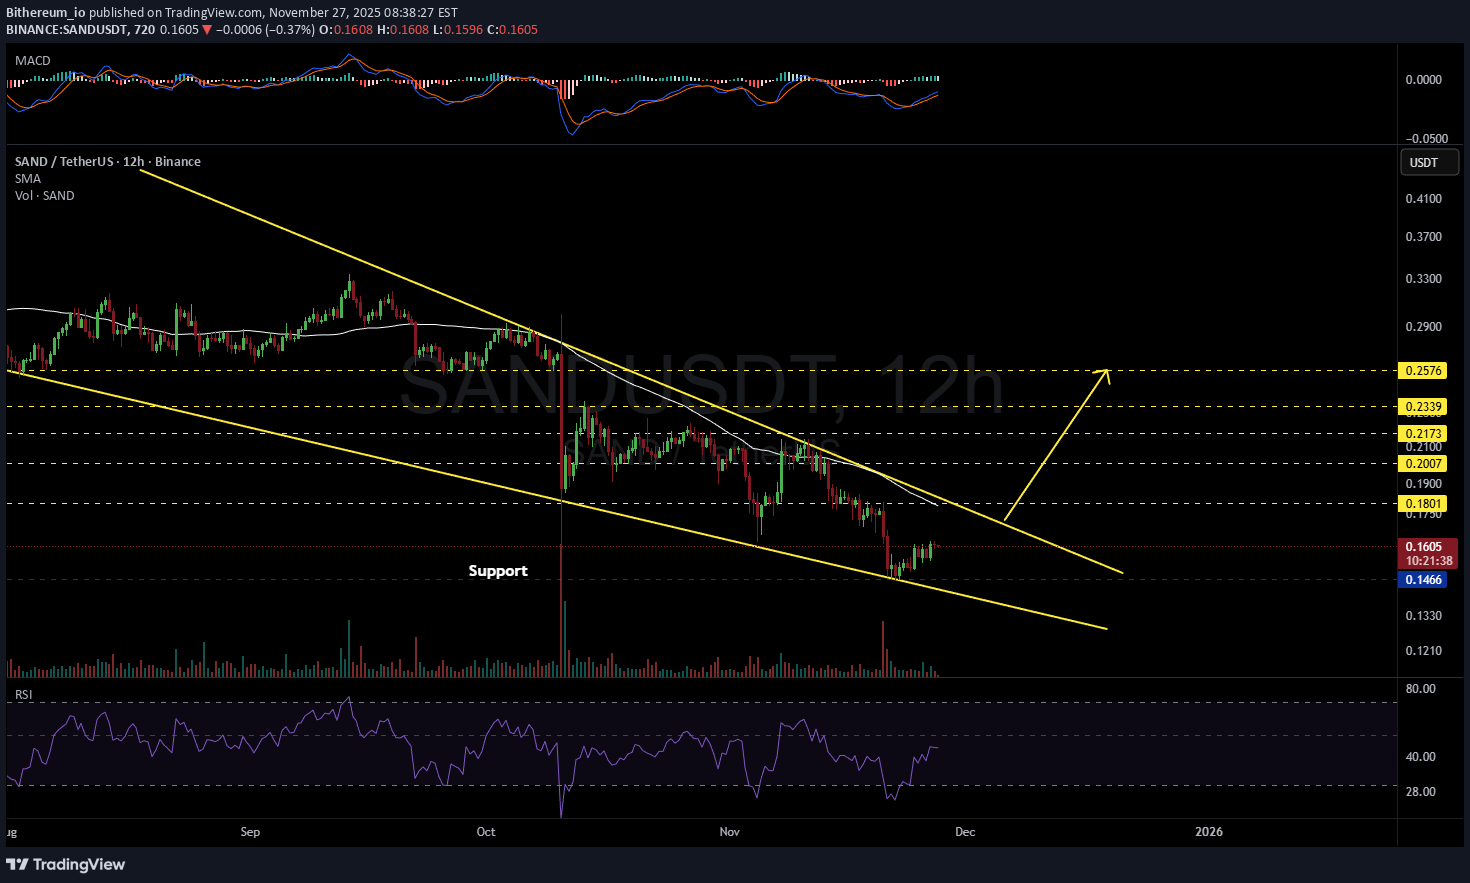
#SAND is moving inside a falling wedge pattern on the 12H timeframe. You can buy a small bag here and at the support level of $0.1466. If price breaks above the wedge resistance and the 12H SMA50, the potential targets are: 🎯 $0.1801 🎯 $0.2007 🎯 $0.2173 🎯 $0.2339 🎯 $0.2576 ⚠️ Always remember to use a tight stop-loss and maintain proper risk management.

تحلیل تکنیکال SAND: استراتژی مثلث متقارن برای سودآوری فوری!
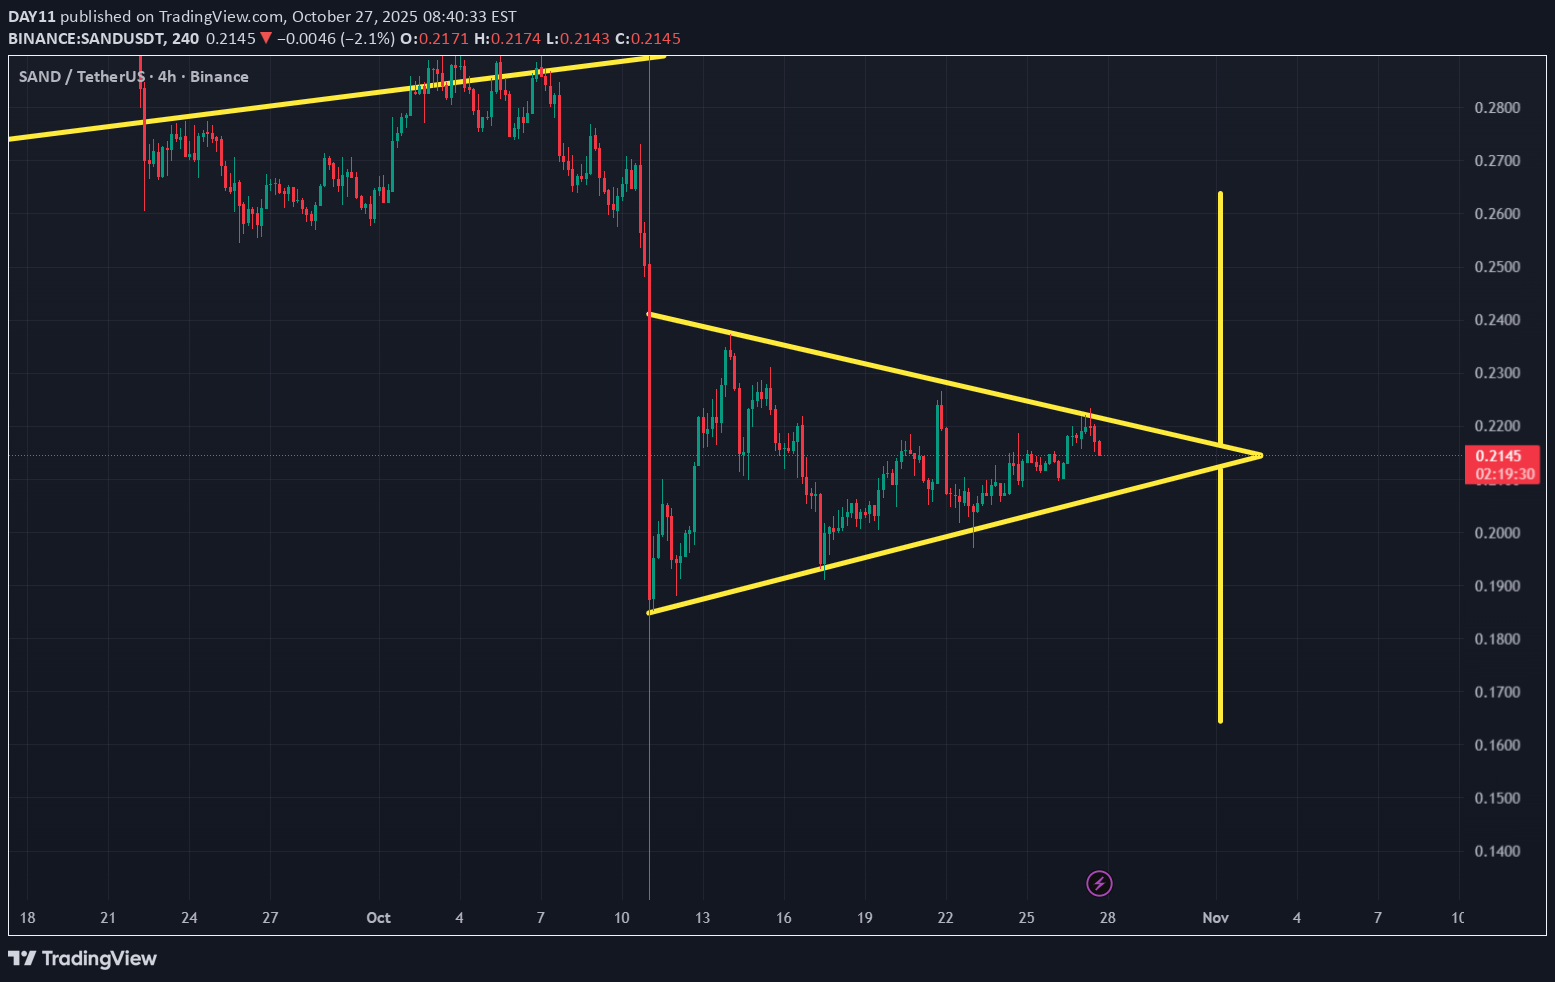
SAND Trade Set Up - 1.Wait for a Breakout and Confirmation: Do not make any trading decisions until the price closes decisively outside of the triangle. Increased Volume: A valid breakout or breakdown is usually accompanied by an increase in trading volume, confirming the price movement. Price Target: The potential price target for the move can be estimated by measuring the height of the triangle. Stop-Loss: Put a stop-loss Long- Belove the line (support) or Short-Above the line (Resistance) depend on break out . Do Your Own Research before taking any action. Updates will soon....until don't forget to follow

سیگنال انفجاری SANDUSDT: کجا بخریم و تا کجا سود کنیم؟
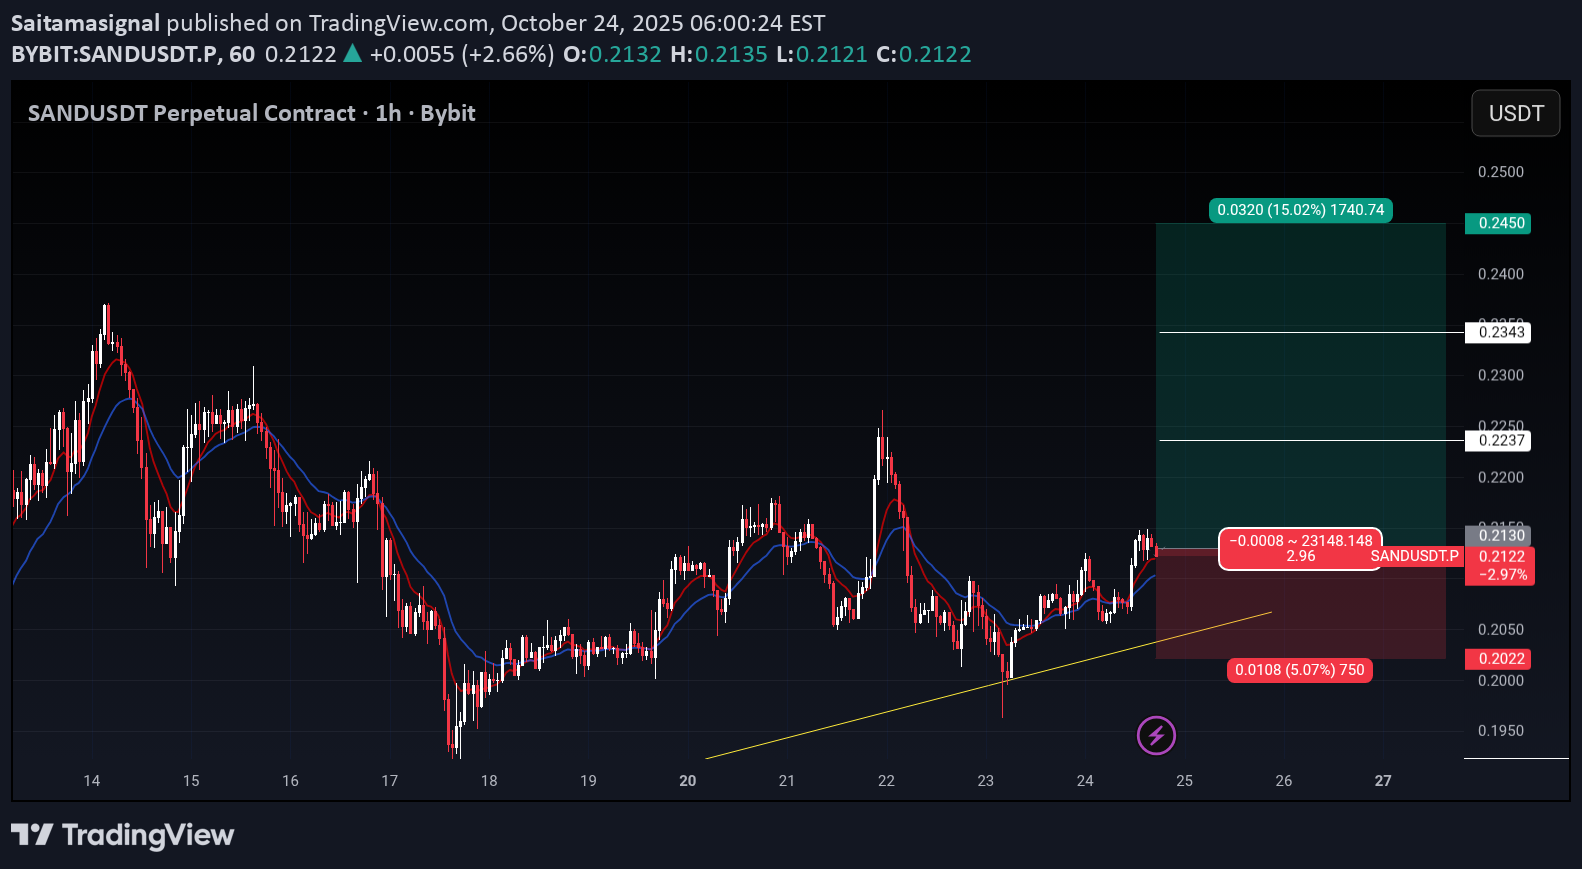
COIN NAME : SANDUSDT ( isolated ) Buy long zone : 0.2130 Take profit : 1) 0.2237 2) 0.2343 3) 0.2450 Stop loss : 0.2022 Max leverage: 6x Amount : 2.0% Always use ure brain

آمادهسازی انفجار قیمت سند (SAND)؟ تحلیل کامل موج صعودی و اهداف هیجانانگیز!
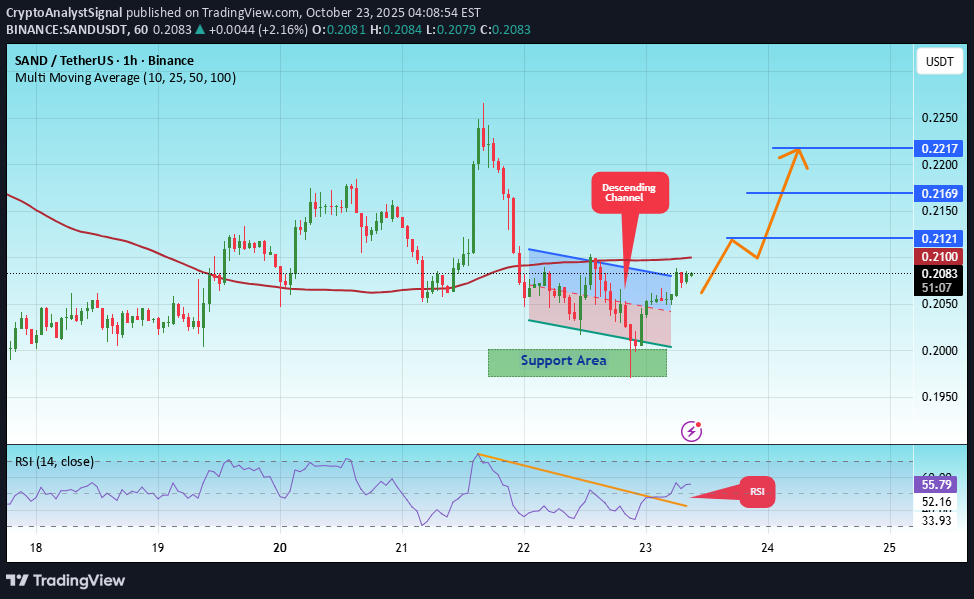
#SAND The price is moving within a descending channel on the 1-hour frame, adhering well to it, and is heading for a strong breakout and retest. We have a bearish trend on the RSI indicator that is about to be broken and retested, which supports the upward breakout. There is a major support area in green at 0.1980, representing a strong support point. We are heading for consolidation above the 100 moving average. Entry price: 0.2080 First target: 0.2121 Second target: 0.2170 Third target: 0.2217 Don't forget a simple matter: capital management. When you reach the first target, save some money and then change your stop-loss order to an entry order. For inquiries, please leave a comment. Thank you.#SAND First target: 0.2121 Reached Second target: 0.2170 Reached Third target: 0.2217 Reached

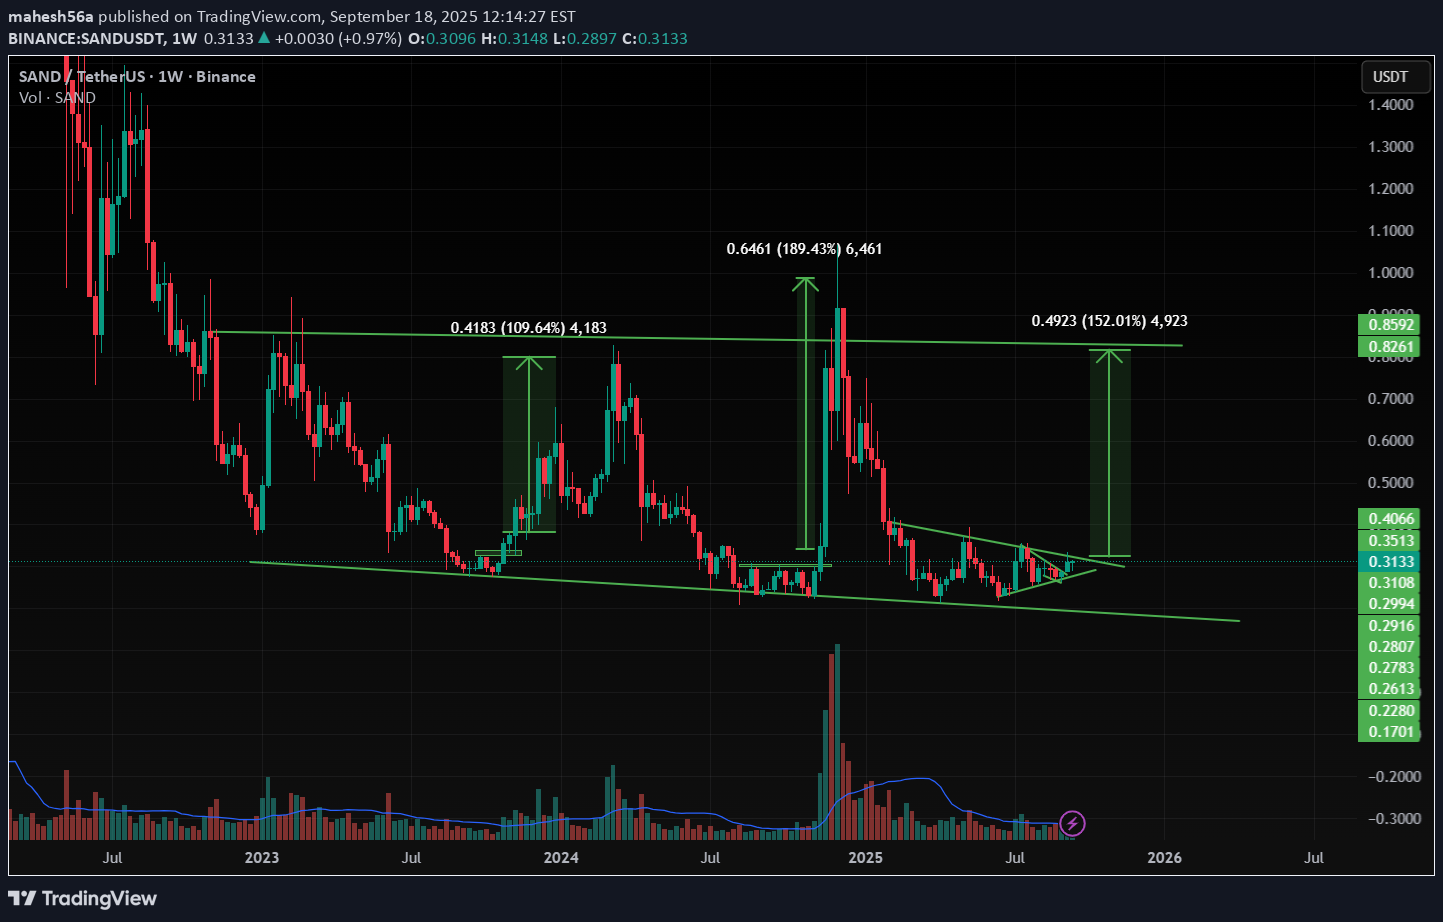
تحلیل ارز سند کوین: سقوط احتمالی تا ۰.۱۸۶۶ و مسیر بازیابی قیمت!

The currency is expected to fall to 0.1866 and then rebound to 0.2352 & 0.2986. The analysis fails with its stability 1W below 0.1558.
آیا سندباکس (SAND) آماده انفجار از میانگین متحرک 200 است؟ (پیشبینی صعود تا 0.50 دلار)

SAND is again pushing into the breakout zone that has been rejecting price for months. This time, momentum looks better as buyers are holding higher lows and slowly pressing against EMAs. If we get a proper breakout here, that’s where the shift starts — continuation toward the $0.50 zone comes next. Swallow Academy

SAND is Ready for 130% + Up Move
SAND is making a Triangle pattern at Support zone and It is Ready for Breakout from that pattern . and at the same time Altcoin Season Index is at 74 , when it is >75 it is sign of very bullish in altcoins and Breakouts will have very high potential to give a big move . and at the same time Bitcoin dominance is decreasing and altcoins dominance is started increasing , so look on all the altcoins and follow proper risk management , it has very good chances to move UP side but first we have to protect the down side , where risk management comes into game . Follow for more Ideas and potential coins/ Stocks .

SANDUSDT.P stuck in $0.26–0.35 range — breakout soon?
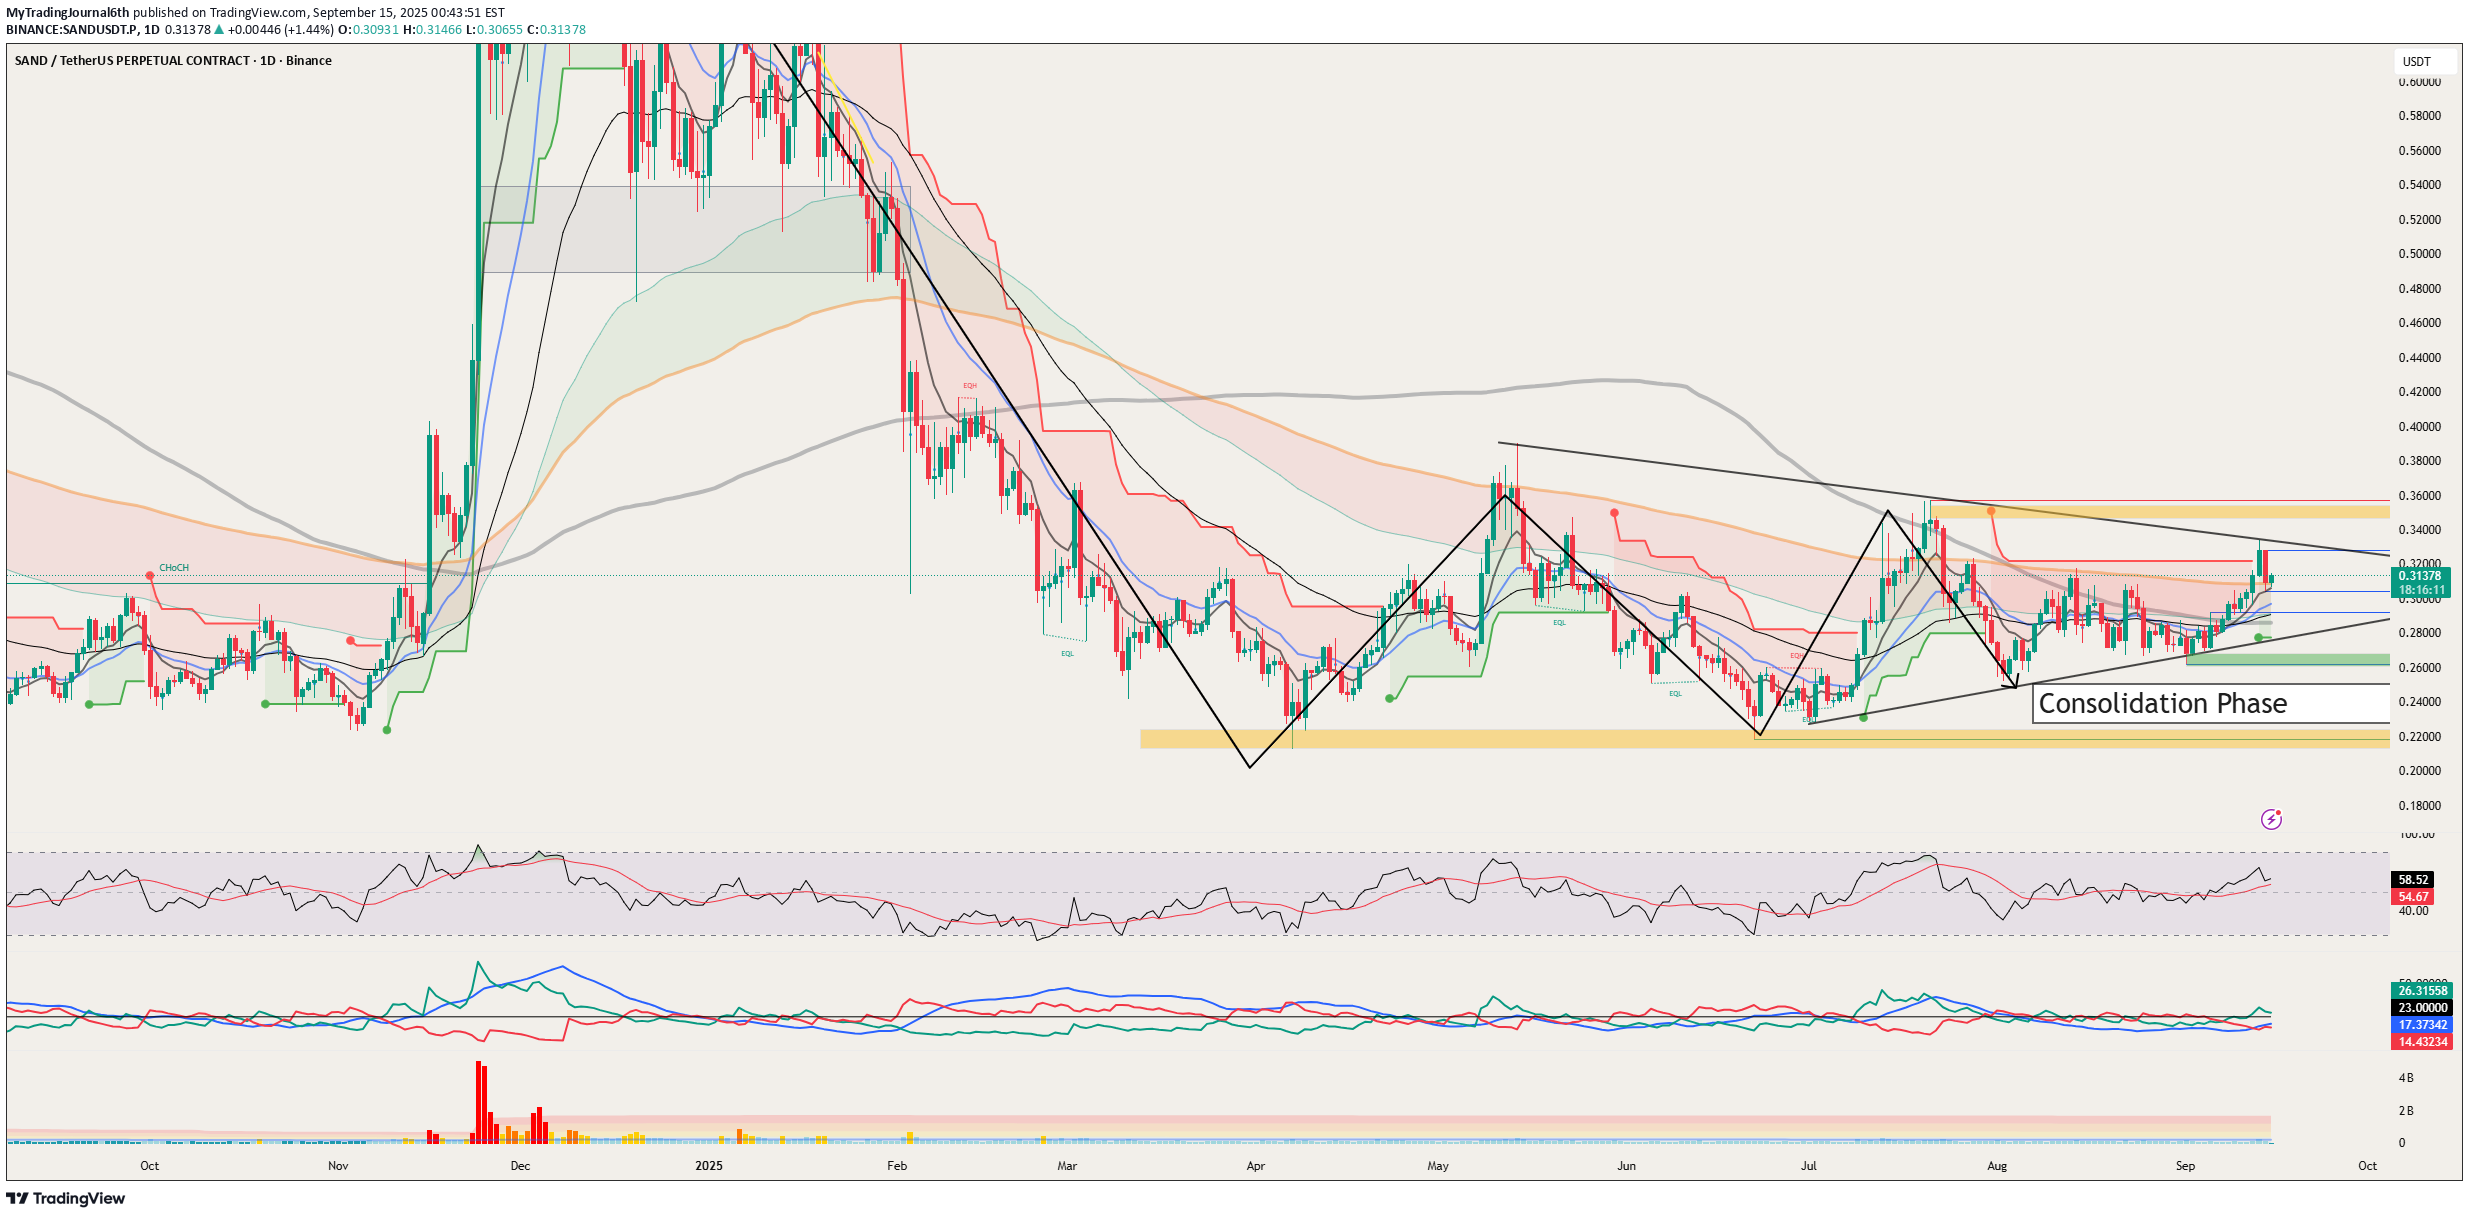
Introduction: SAND is coiling in a tight $0.30–0.33 box; reaction will set next swing. Trend: Higher lows since $0.27, rising into supply. Levels: Resist $0.33, ATH targets $0.35–0.38; support $0.30, then $0.292/$0.275. Pattern: Range box; break/close outside decides. Indicators: Price above EMAs; RSI mid-60s; volume steady. Trade Plan: Long: Break >$0.335, SL <$0.292, TP $0.35/$0.38. Short: Reject $0.33 or lose $0.30, SL >$0.335, TP $0.292/$0.275. Events: FOMC decision (Sep 16–17), late-Sep options expiry, Sandbox ecosystem updates. Takeaway: Break-retest confirms strength; failure means deviation back to range. Conclusion: Hold $0.30 → bias bullish; lose it → $0.275 next. Manage risk. Disclaimer: Educational content, not financial advice. Tags: #SAND #Altcoins #Breakout #Support #Resistance #TradingEducation #TechnicalAnalysis
Disclaimer
Any content and materials included in Sahmeto's website and official communication channels are a compilation of personal opinions and analyses and are not binding. They do not constitute any recommendation for buying, selling, entering or exiting the stock market and cryptocurrency market. Also, all news and analyses included in the website and channels are merely republished information from official and unofficial domestic and foreign sources, and it is obvious that users of the said content are responsible for following up and ensuring the authenticity and accuracy of the materials. Therefore, while disclaiming responsibility, it is declared that the responsibility for any decision-making, action, and potential profit and loss in the capital market and cryptocurrency market lies with the trader.