
MyTradingJournal6th
@t_MyTradingJournal6th

What symbols does the trader recommend buying?
Purchase History
پیام های تریدر
Filter
MyTradingJournal6th
BTCUSDT – Volatility Squeeze Near 90k, Watch For Breakout
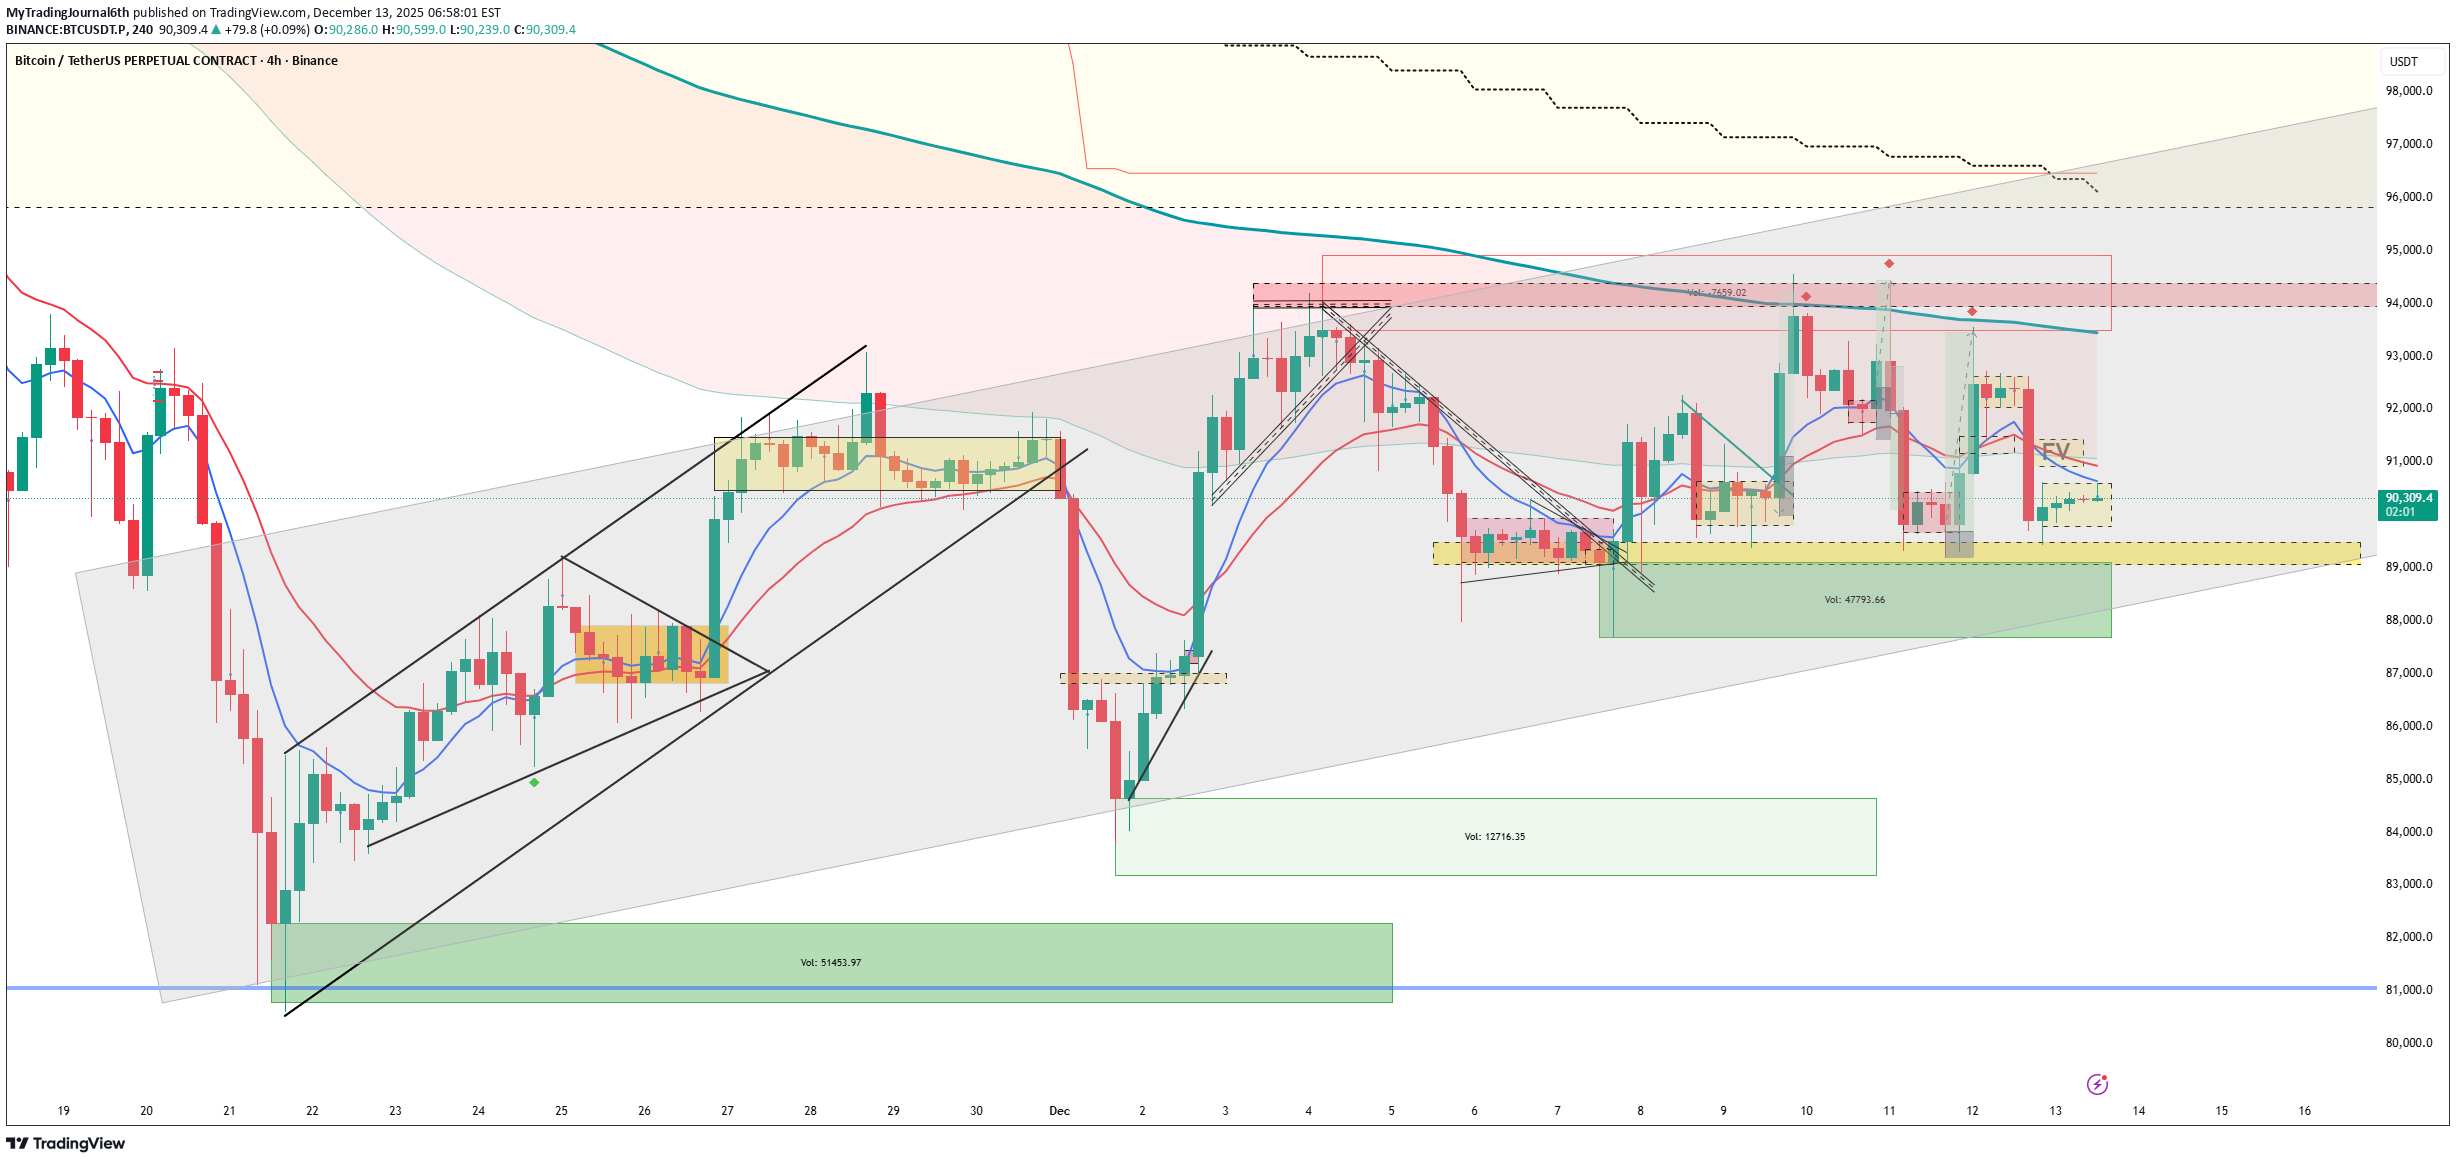
BTCUSDT is consolidating around the 90k handle after a corrective phase from the 100k+ region, with price now hovering near the 20‑day average around 90.4k. Volatility has compressed with 9–20 day ATR near 4.2–4.5k, suggesting that the next impulsive move is likely to be strong once current range breaks. Major Hr Resistance 89400 Momentum is neutral to slightly weak, with RSI in the low‑40s and ADX in the 35–45 zone, indicating a mature trend but not a strong directional push right now. This environment favors breakout or mean‑reversion trades from clearly defined levels rather than aggressive trend-following entries. Bullish plan (if price holds 88k–89k support): Bias: Long above 88k–89k demand zone. Possible entry: On bullish 4H candle reclaiming 90k and closing above short-term range high. Targets: 93k first, then 96k–98k if volatility expands in bulls’ favor. Invalidation: Clean 4H close below 88k support, or strong breakdown with rising volume. Bearish plan (if 88k fails): Bias: Short below 88k, aiming for a deeper mean reversion after failure of range support. Possible entry: Retest of 88k as resistance after breakdown. Targets: 84k–85k initial liquidity pocket. Invalidation: Reclaim and 4H close back above 89k–90k. This is a trade idea, not financial advice. Manage risk per your plan and position size according to your own strategy.
MyTradingJournal6th
بیت کوین زیر 90 هزار تثبیت شد: بعد از تصفیه اهرمها، بازار منتظر حرکت بعدی است!
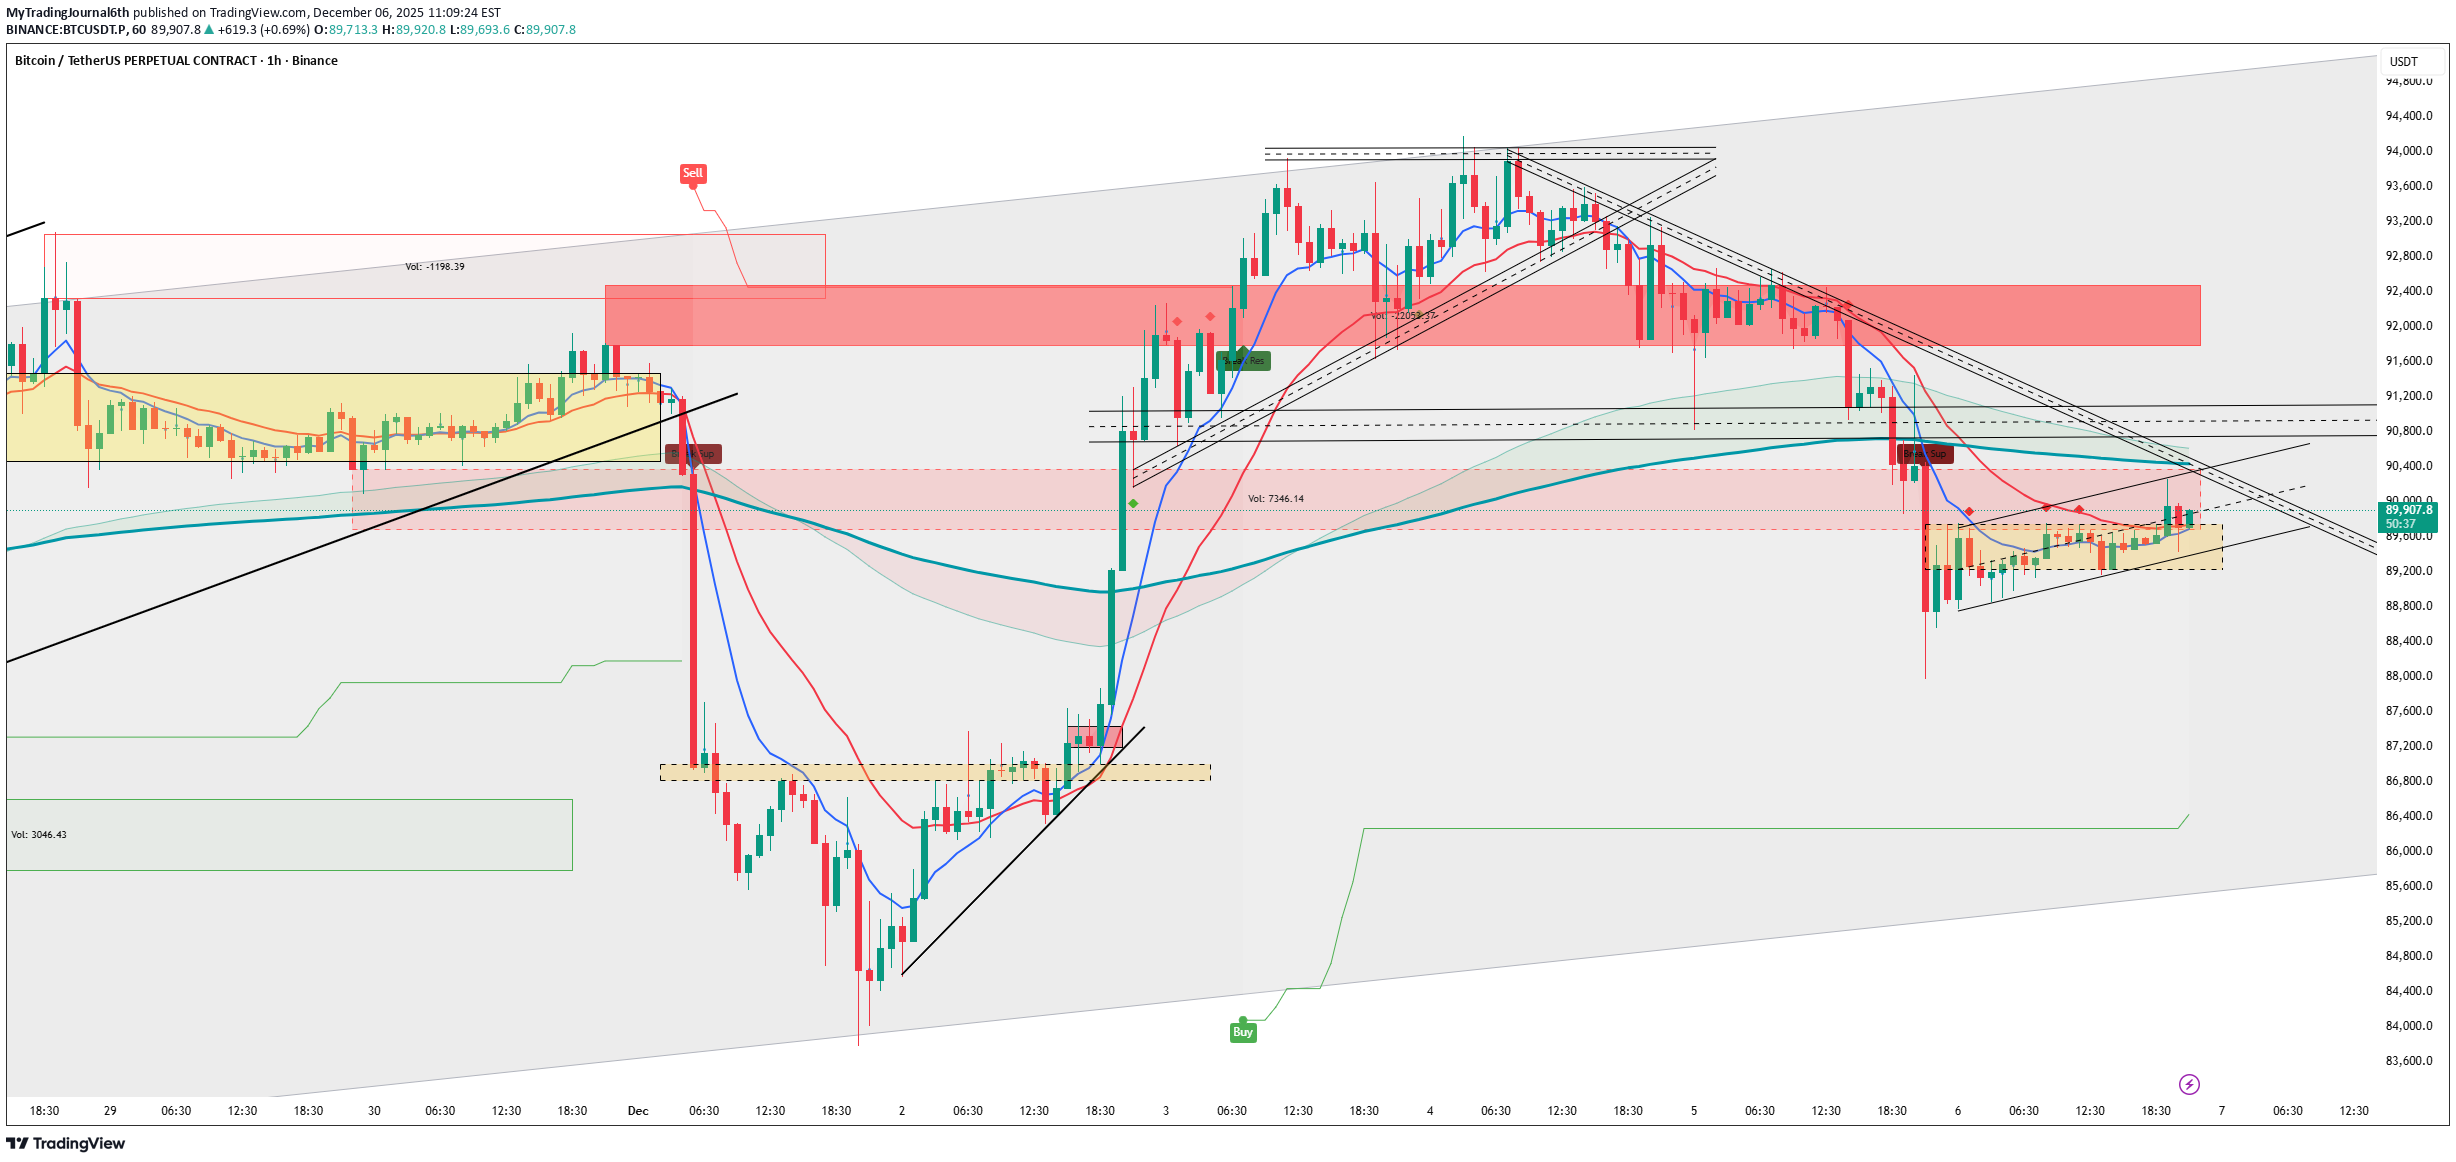
Bitcoin is trading just under the 90K mark on BTCUSDT perpetuals, consolidating after a leverage flush that cleared out a large chunk of crowded long positions. The price action on the 1‑hour chart is now showing tighter candles and reduced volatility, reflecting a pause as traders reassess direction following the recent liquidation spike
MyTradingJournal6th
تحلیل فوری بیت کوین: آیا حمایت 92,799 شکسته میشود؟ فرصت شورت جدید!
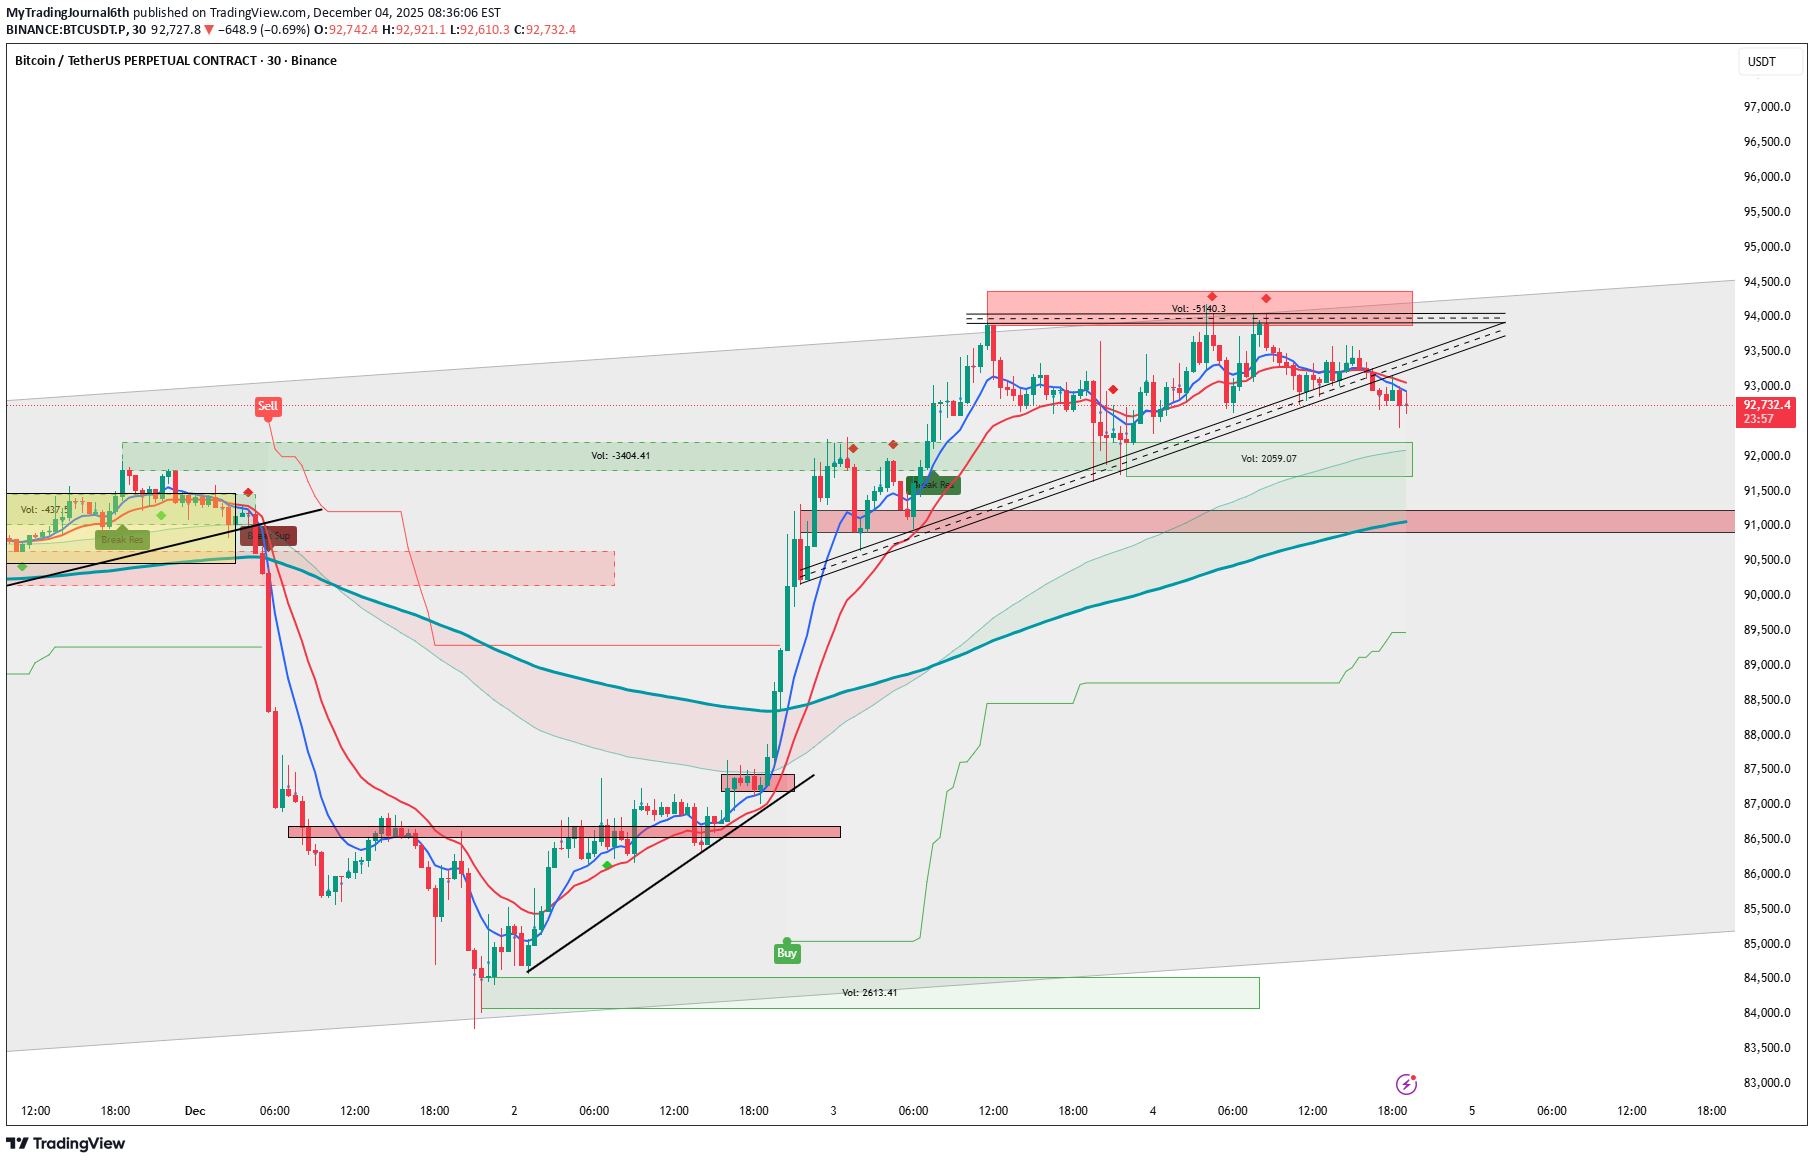
BTCUSDT.P at 92,799 on 30min consolidates near lows (92,610), with SELL signals strong amid tight range post-pullback.
MyTradingJournal6th
رمزگشایی بازار خرسی: استراتژیهای سرمایهگذاری در بحران اقتصادی ۲۰۲۵
Understanding the Current Bear Market The markets are currently in a bear phase, defined by a decline of 20% or more from recent highs. Recent news shows Bitcoin and broader equities facing renewed selling pressure, influenced by market risk-off sentiment and liquidity tightening. Crypto assets like Bitcoin have fallen significantly, reflecting cautious investor behavior amid economic uncertainties and volatility spikes as we enter December 2025. Long-Term Bear Market Strategy Stay Calm and Balanced: Avoid panic selling; maintain a diversified portfolio to spread risk across asset classes including bonds and defensive stocks. Dollar-Cost Averaging: Invest gradually in discounted quality assets to reduce average purchase cost during market dips. Focus on Strong Companies: Prefer large-cap, well-established firms and essential sectors such as food and healthcare. Prepare for Recovery: Bear markets are temporary. Position yourself to benefit when markets rebound by holding quality investments and investing strategically during declines. Final Thoughts While the bear market brings challenges, it also offers opportunities for disciplined investors. By understanding the current market dynamics, managing risk, and adopting a patient long-term view, investors can navigate volatility and position themselves for future gains. This post synthesizes the latest news on market conditions and practical investment advice for weathering a bear market effectively.
MyTradingJournal6th
تحلیل بیت کوین (BTCUSDT.P): کفسازی در ۸۵ هزار دلار و نشانههای احتمالی بازگشت!
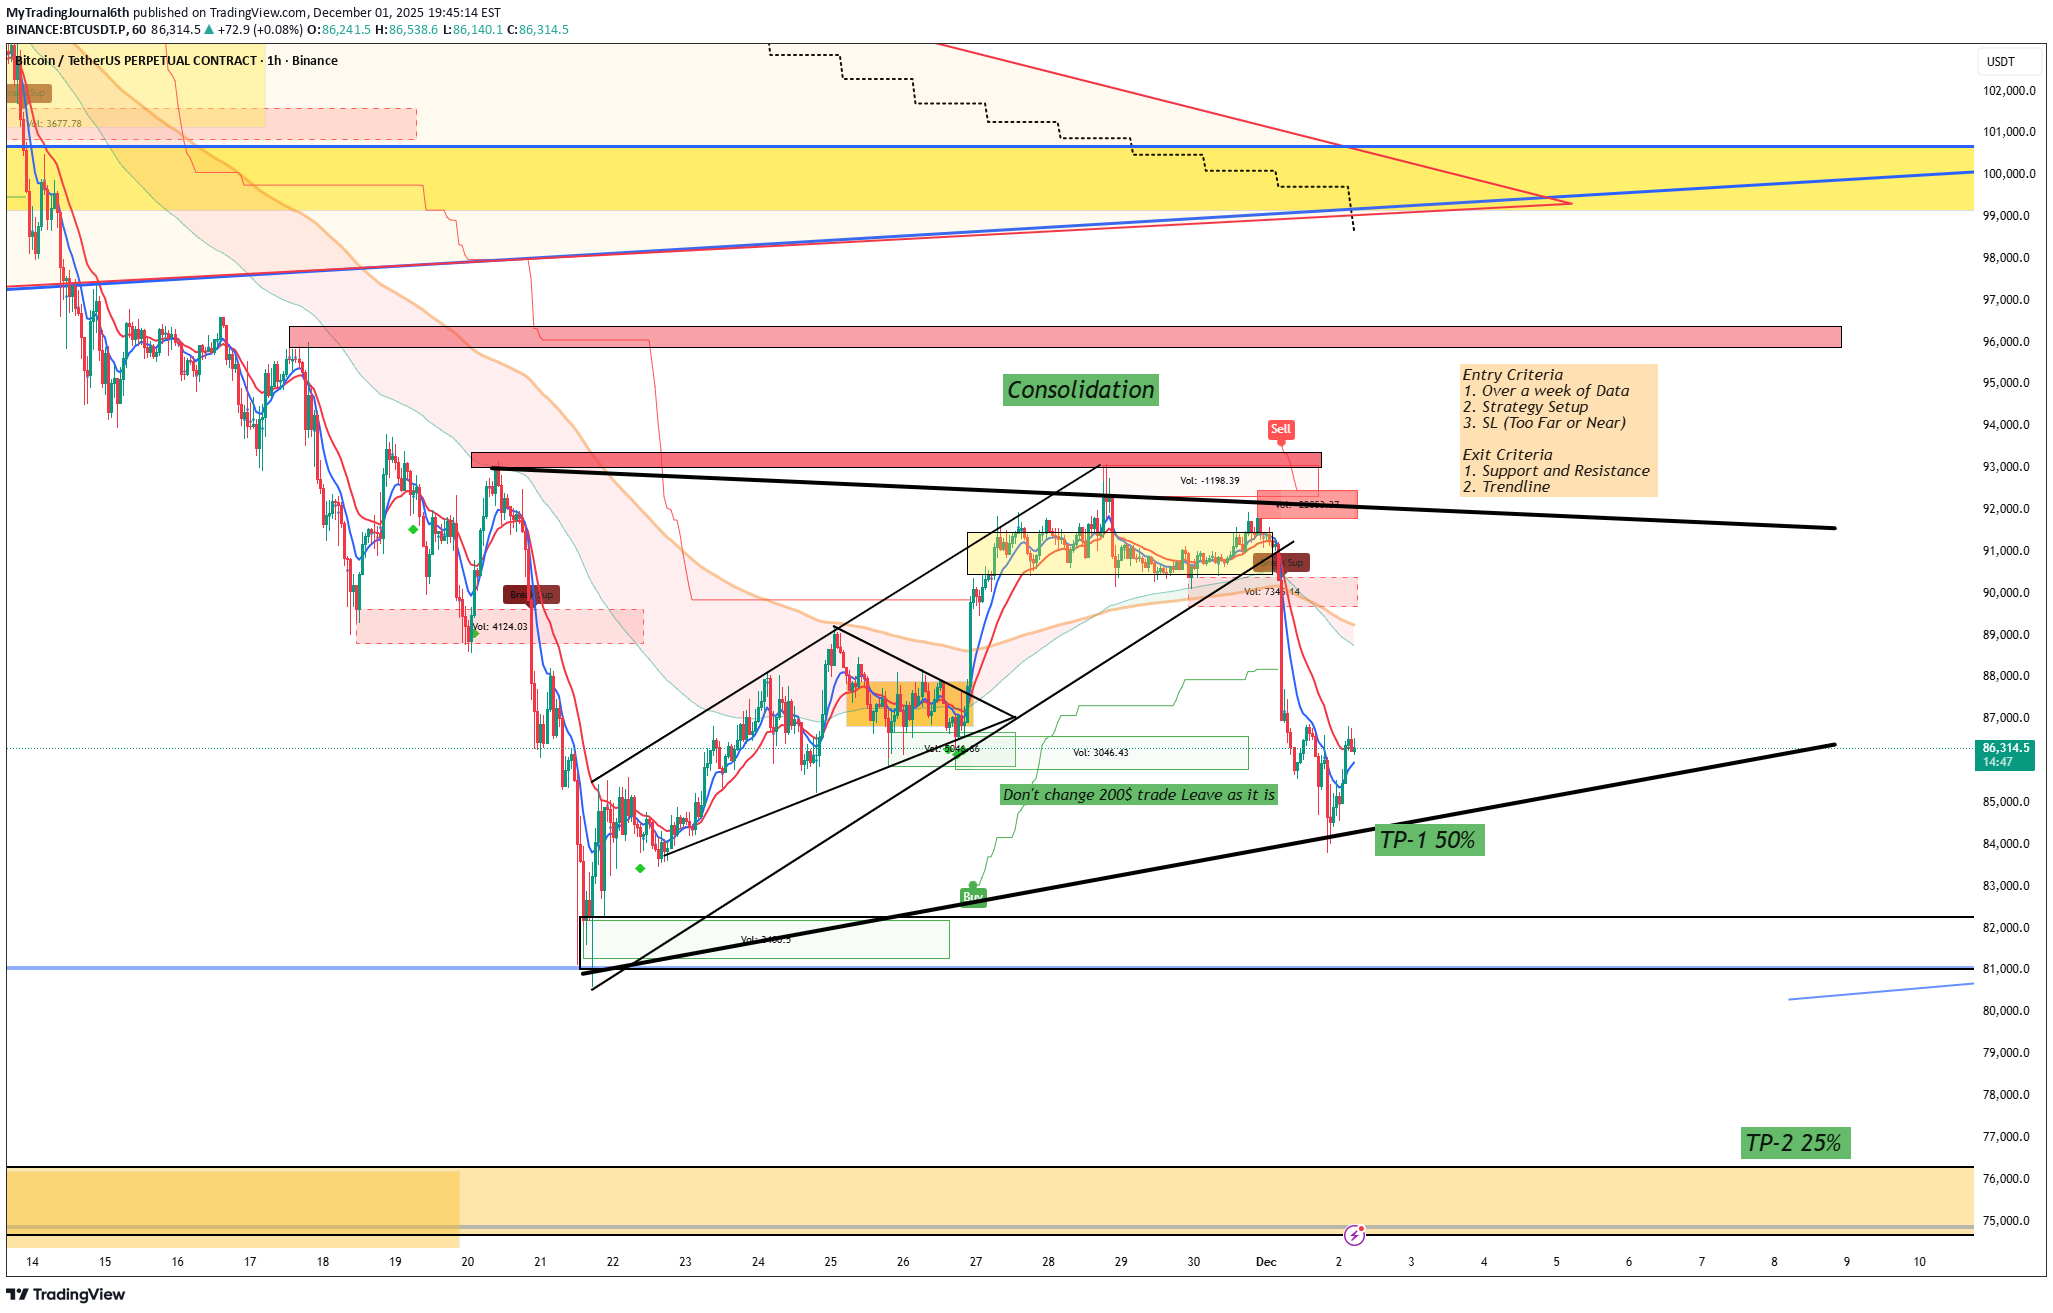
BTCUSDT.P consolidates at 86,307 after a 5% December pullback from 113K highs, holding key demand zone 85K–87K with low volume. Technical Indicators RSI (32–40) and Stochastic signal oversold conditions across timeframes, while MACD shows bearish divergence weakening. ADX above 50 confirms downtrend strength, but higher lows near 85K suggest potential reversal structure. Key Levels Support: 85,000 (swing low), 83,000 (next demand). Resistance: 86,500 (breakout test), 89,500–93,500 (supply).
MyTradingJournal6th
تحلیل سقوط بیت کوین: آیا بازار خرسی تأیید شد؟ اهداف قیمت و سیگنالهای هشداردهنده
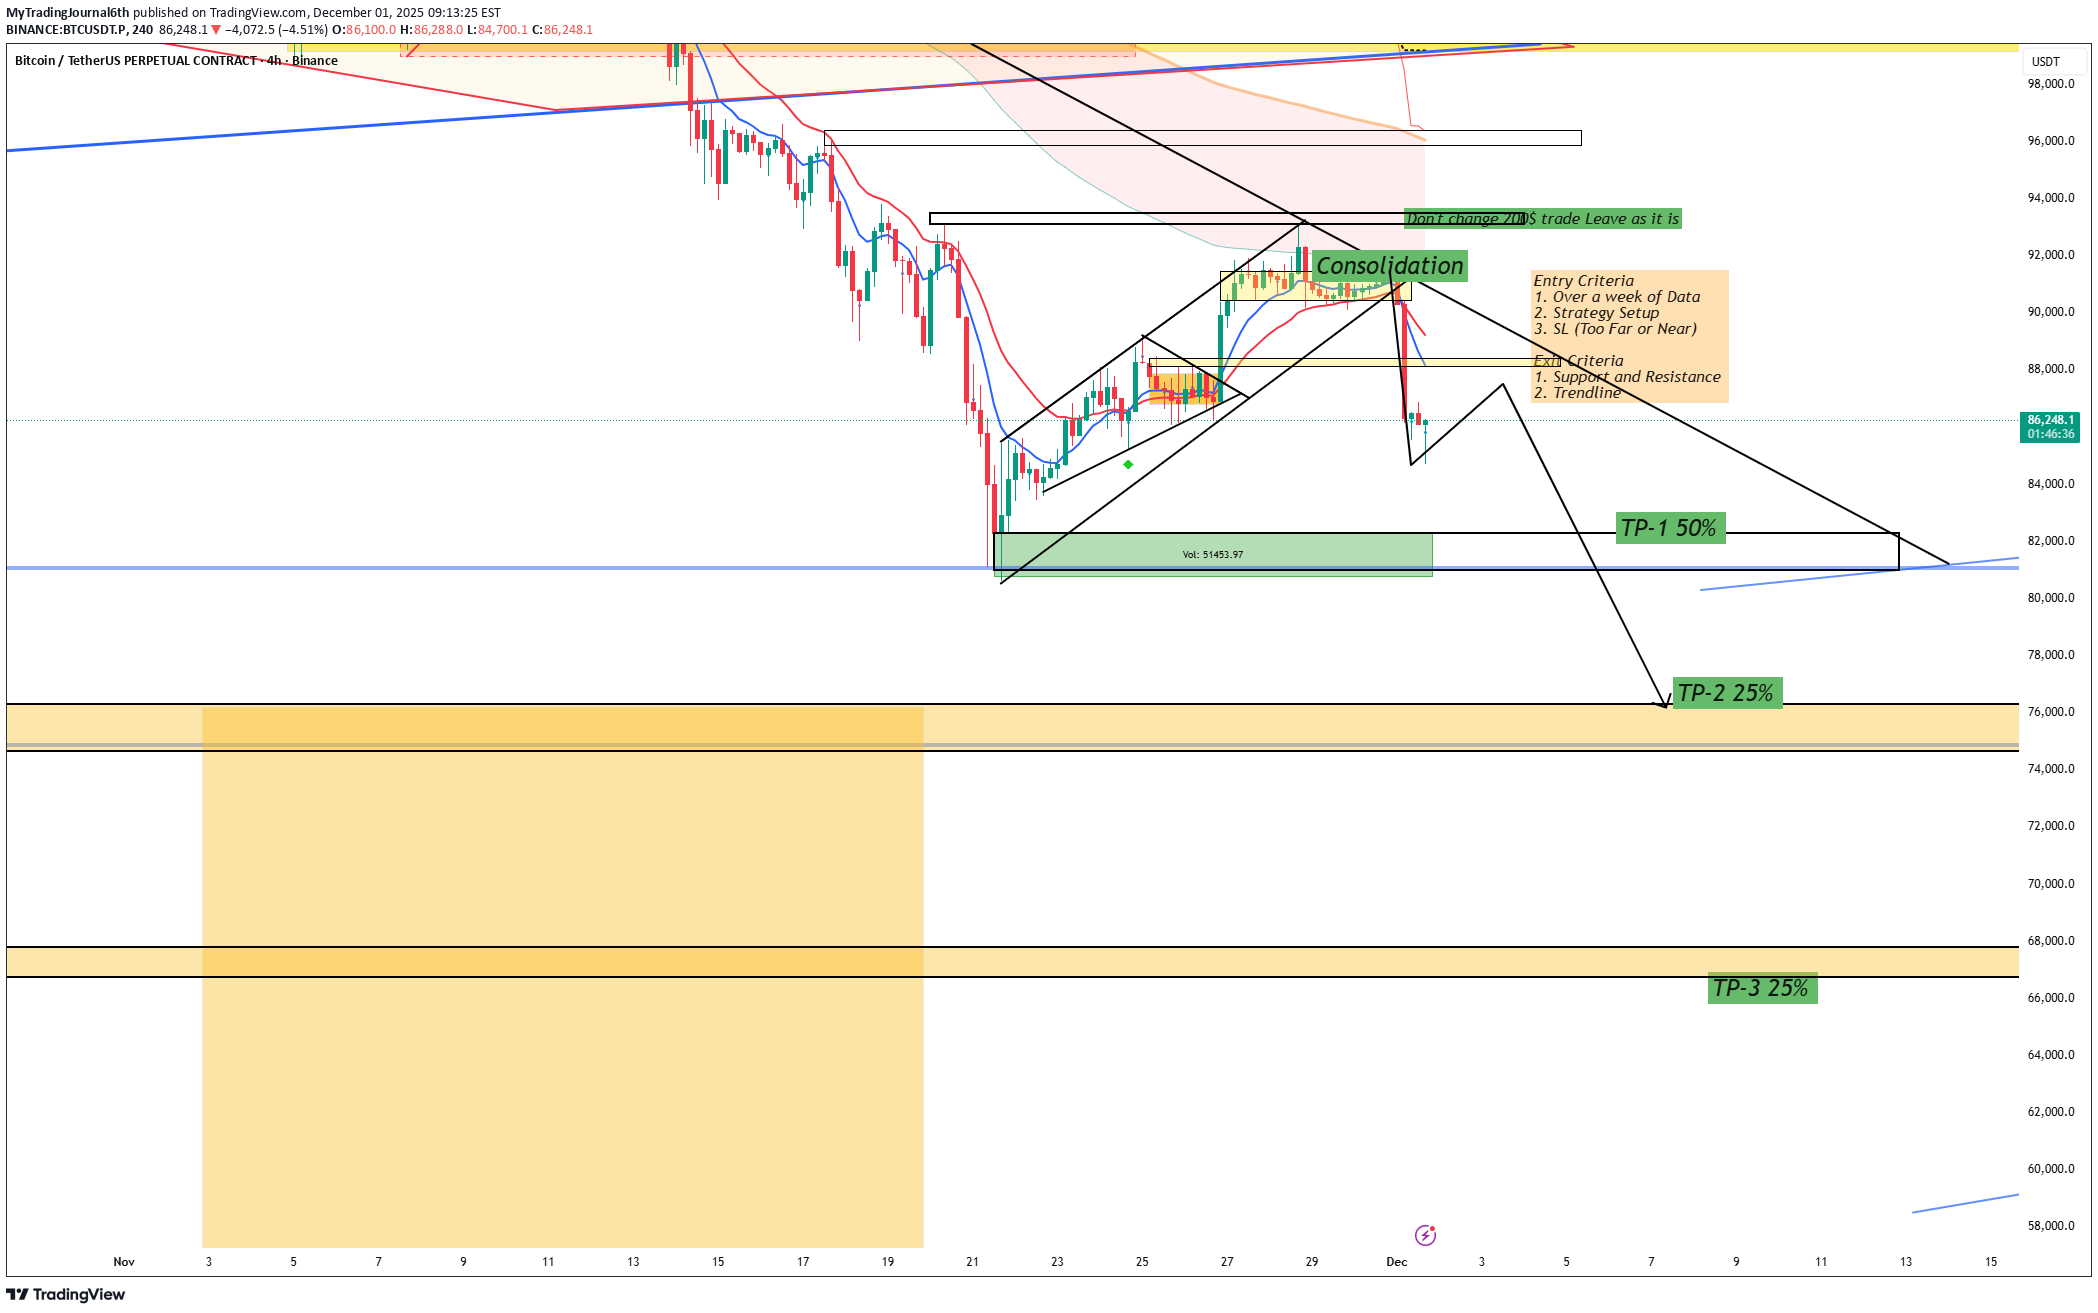
Bitcoin confirms bear market with monthly MACD turning red, echoing past downturns. Price slid to ~$86K, down 4.55%, mirroring 2022 trajectory post-FTX with 16-17% November losses. Key Bearish Signals Bear flag breakdown targets $66.8K; immediate supports at $85.5K-$82K. Lower highs/lows, EMAs sloping down, bearish engulfing on daily. Whales distributing, weak ETF demand fuel deeper retests #BearMarket #Bitcoin #TradingSetup
MyTradingJournal6th
تحلیل کوتاه ۴ ساعته قیمت اتریوم (ETHUSDT.P): منتظر شکست یا عقبنشینی در سطح ۳۸۸۵
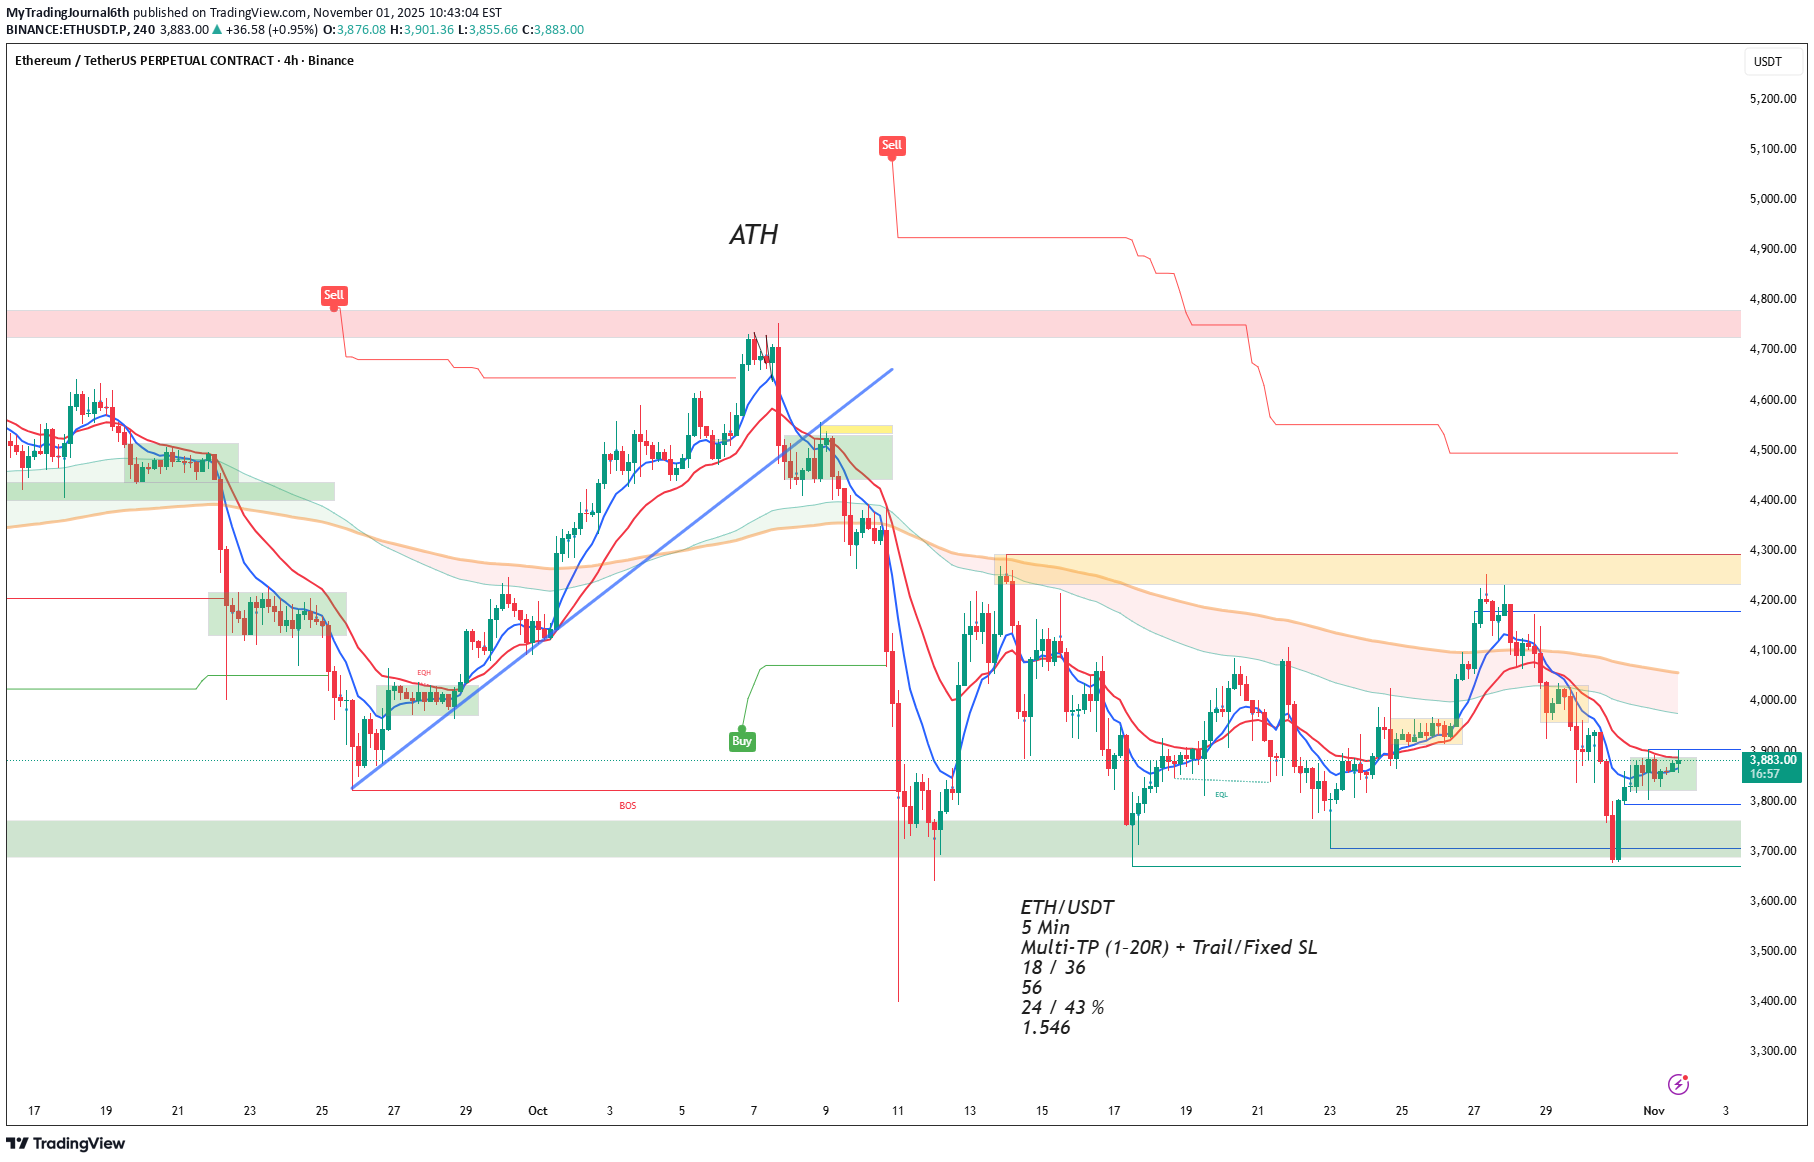
ETHUSDT.P trading near 3,885 level. Monitoring for potential breakout or retracement on the 4H chart. Will respond to next move. Disclaimer: Not financial advice.
MyTradingJournal6th
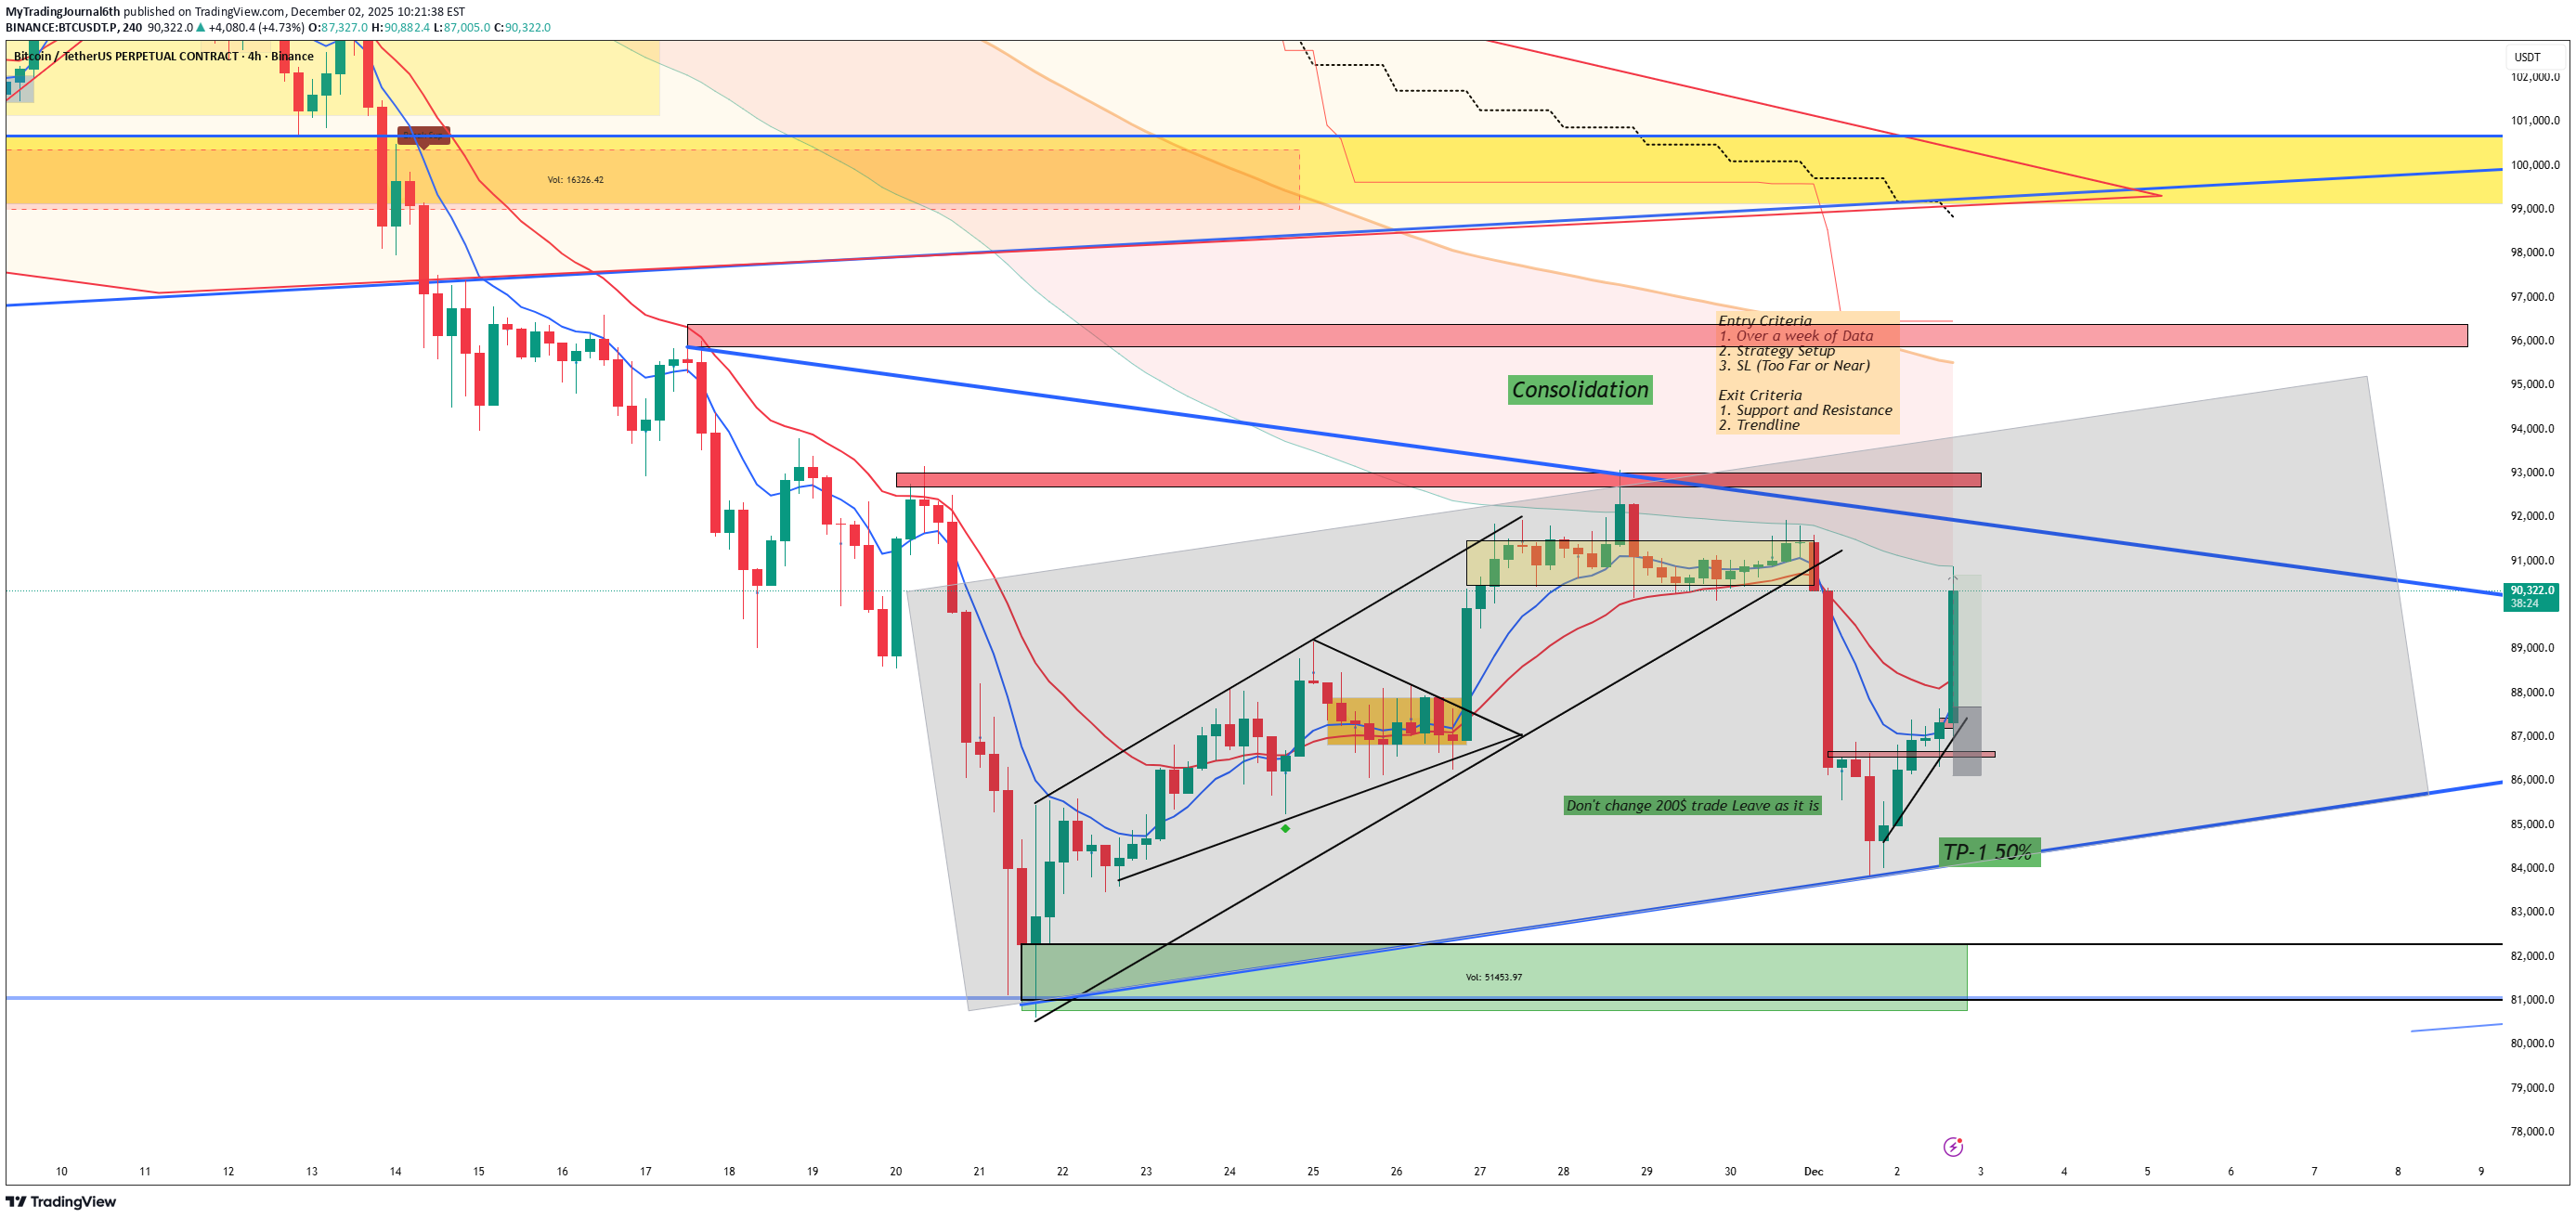
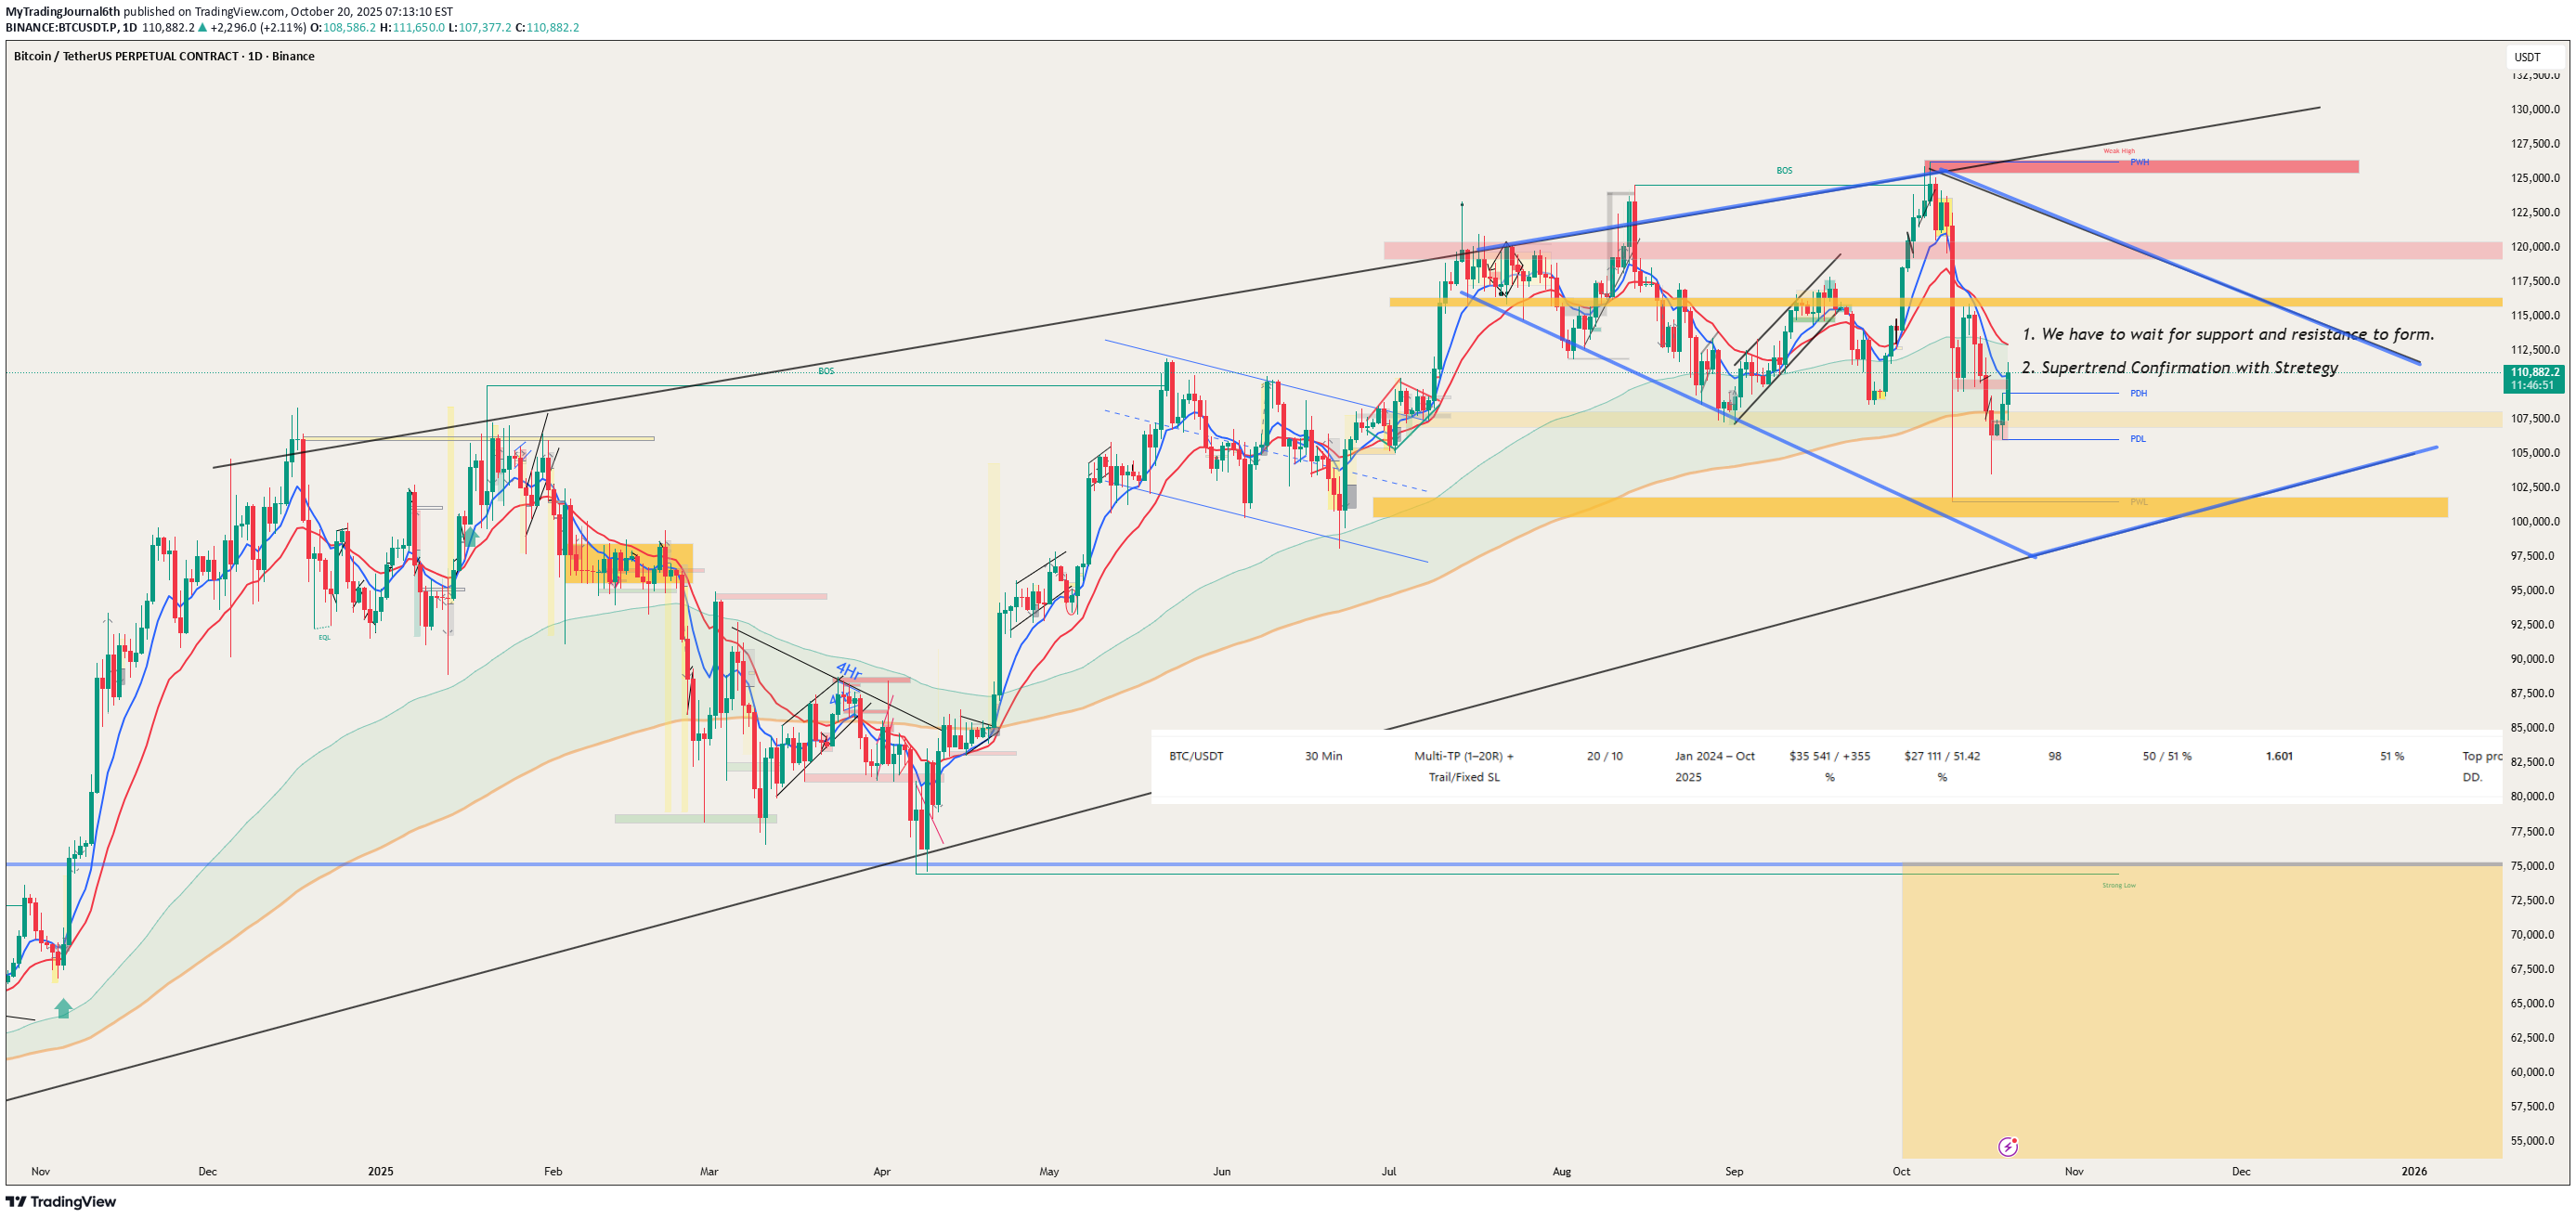
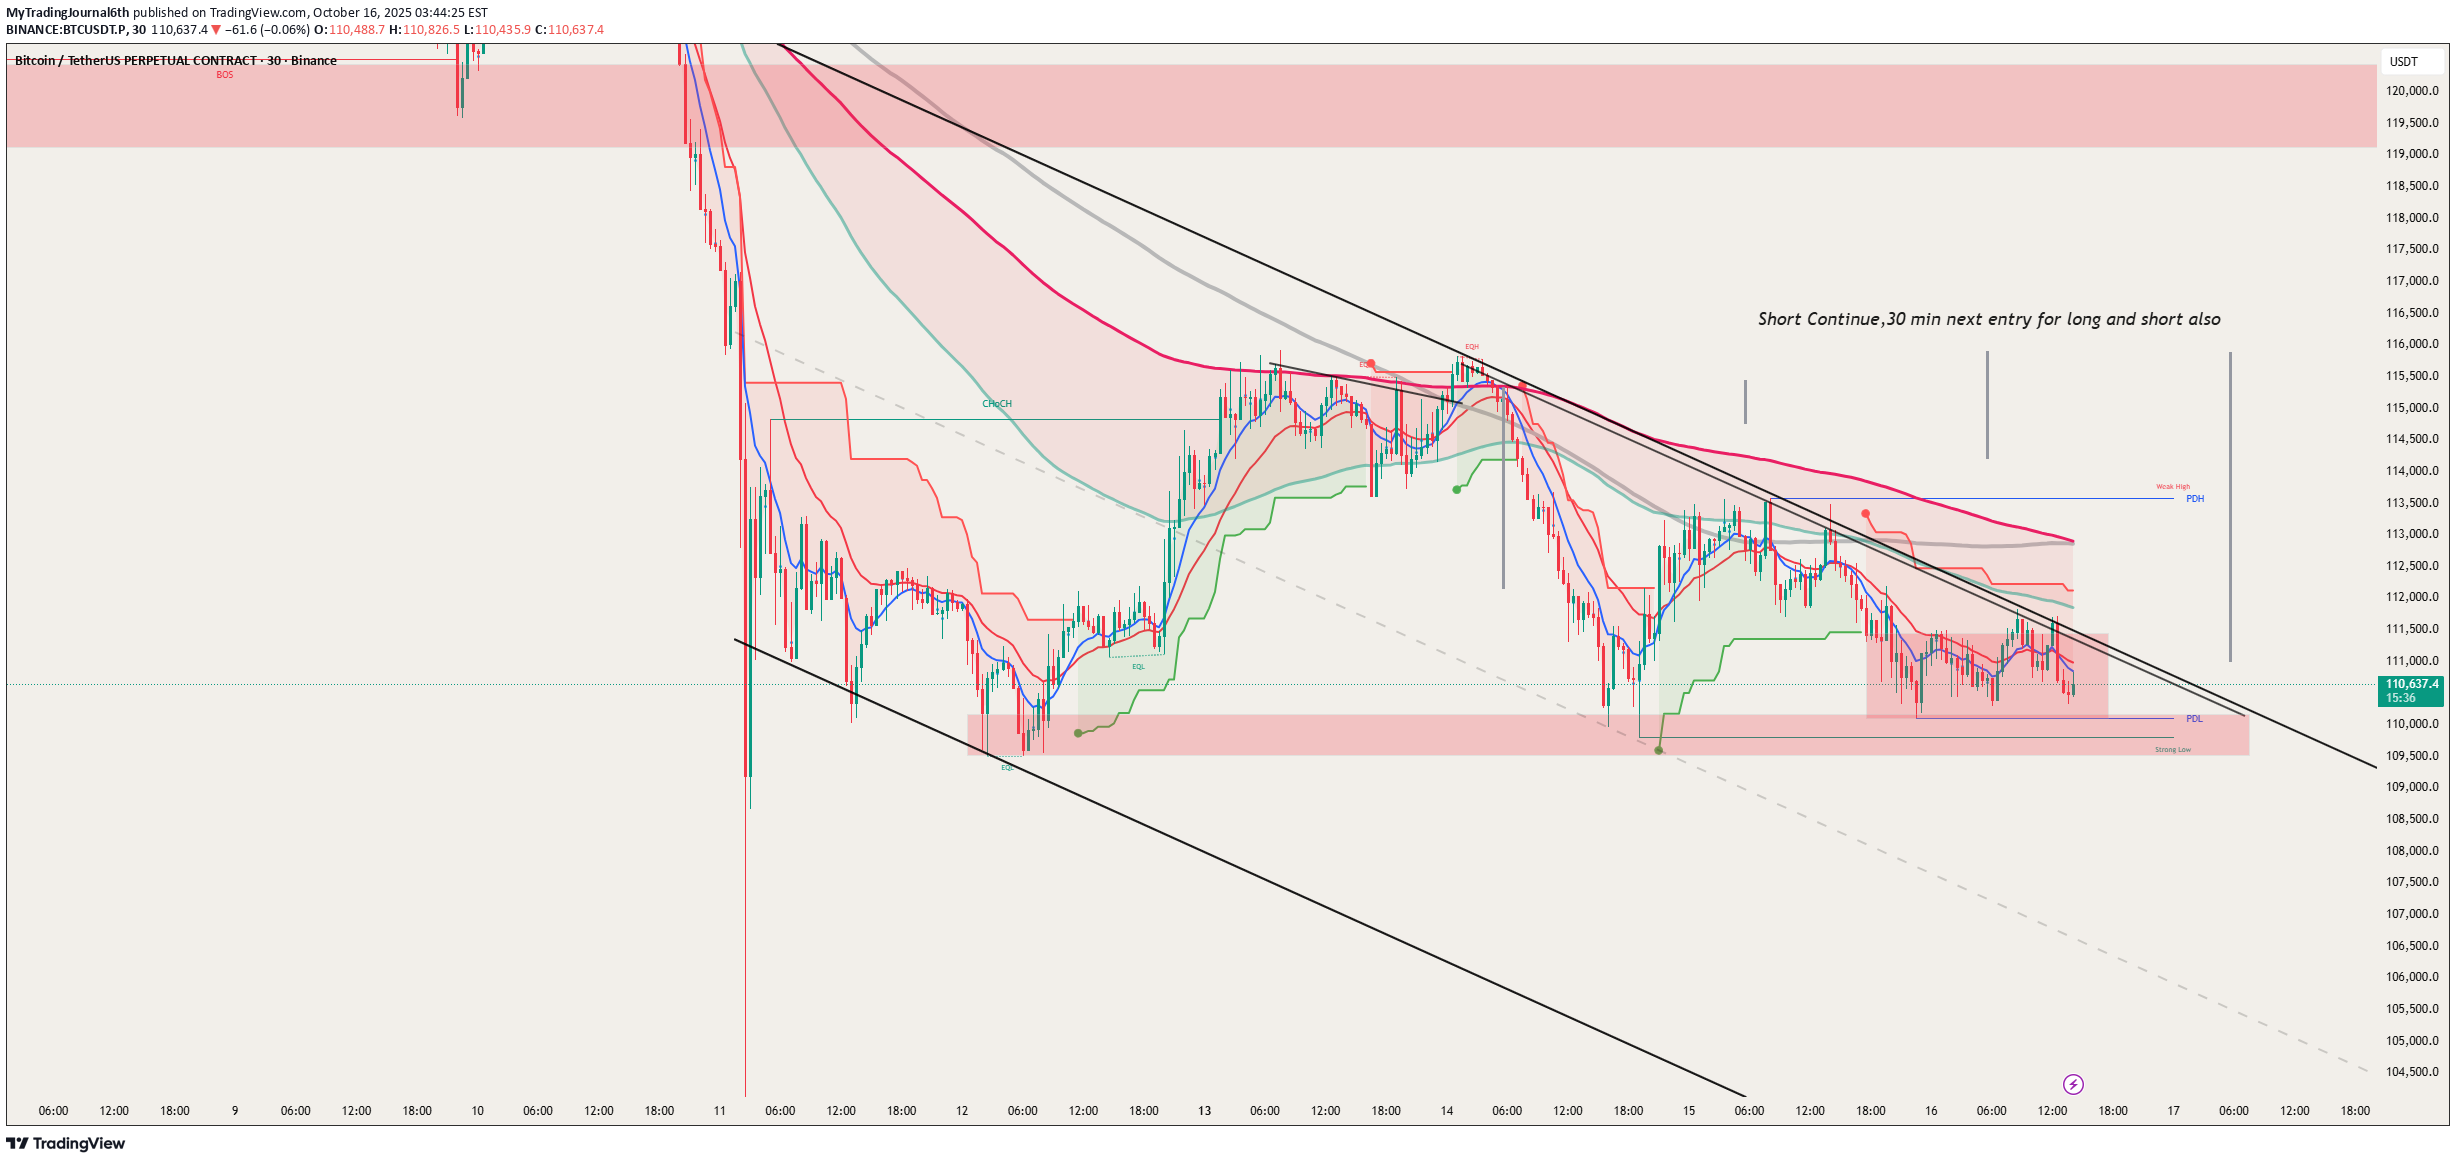
تحلیل بیت کوین (BTCUSDT.P): منتظر شکست یا برگشت در تایم فریم 4 ساعته!
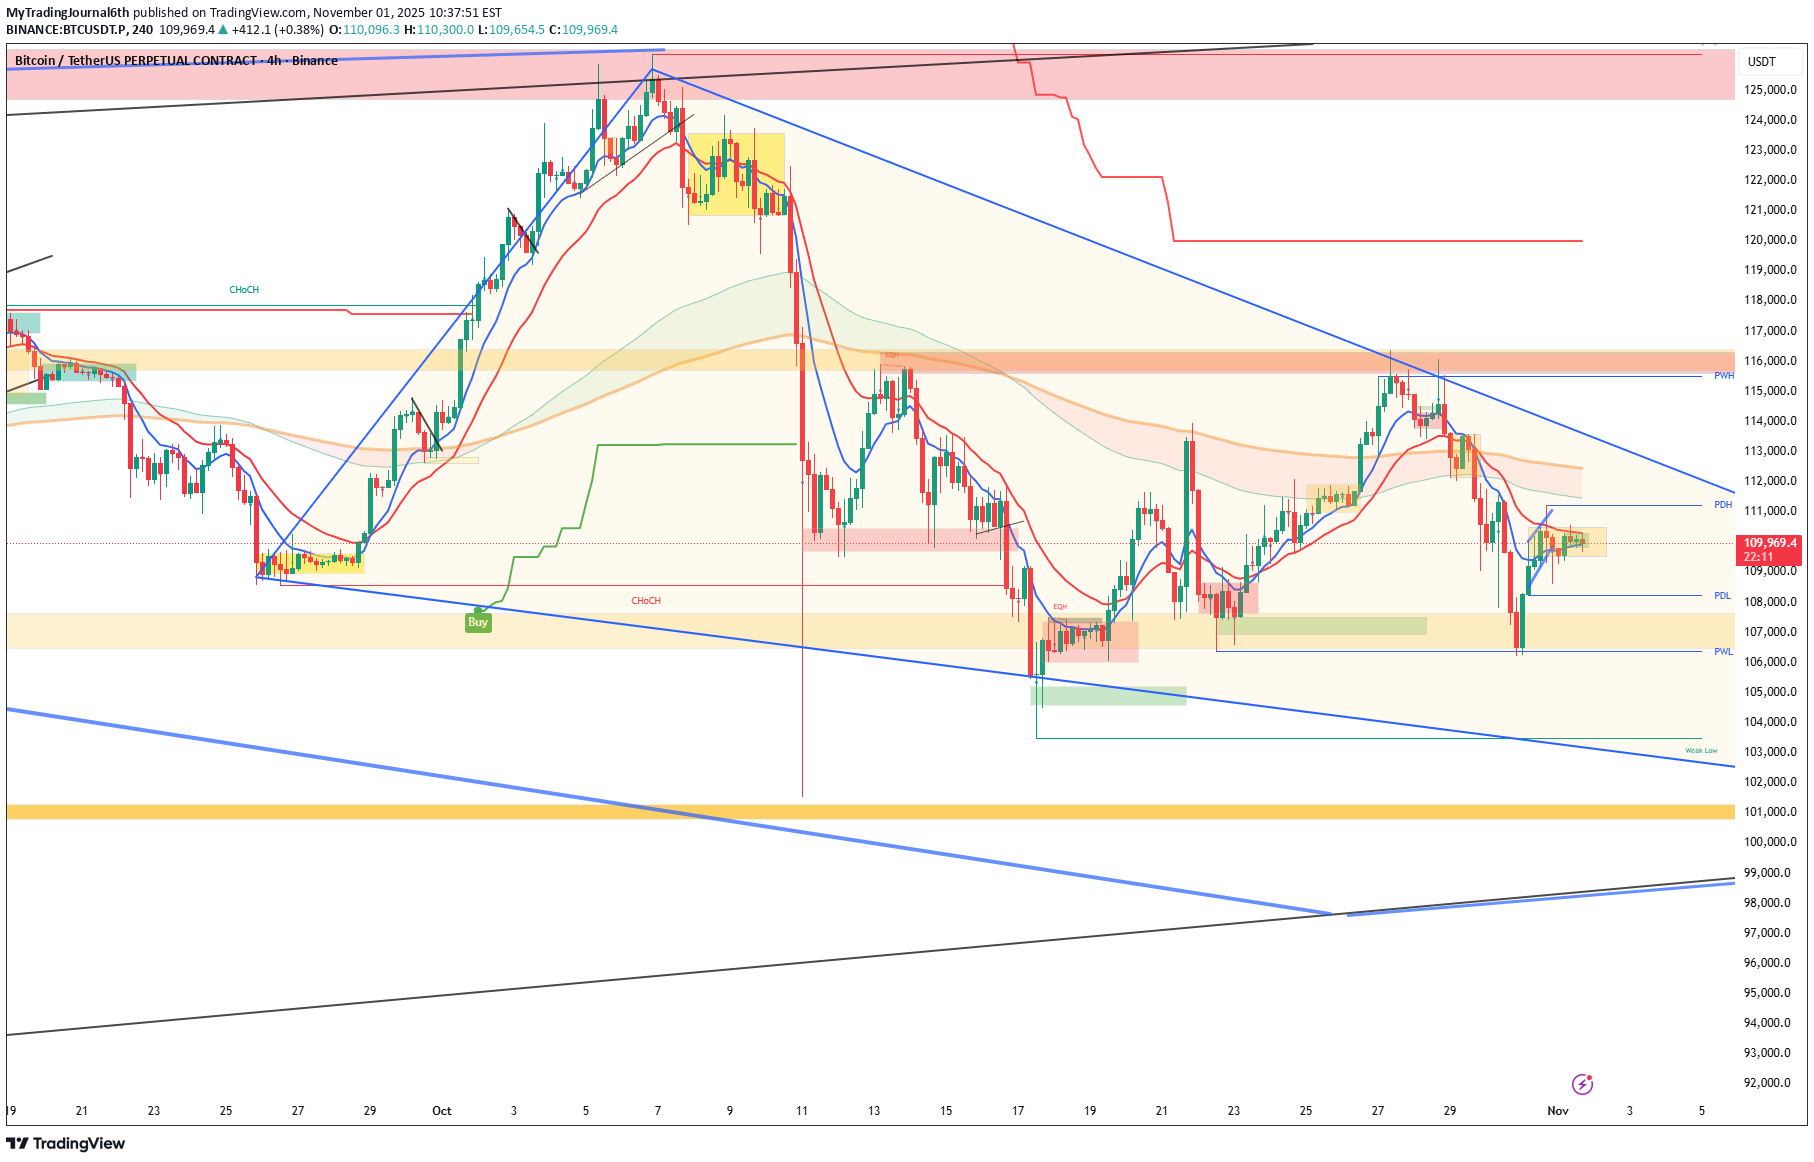
BTCUSDT.P consolidating near 110,000. Watching for breakout or reversal signals on the 4H timeframe. Will update on direction. Disclaimer: Not financial advice. For educational purposes only.
MyTradingJournal6th
تشکیل الگوی الماس در نمودار: پیشبینی سقوط بزرگ تا نوامبر ۲۰۲۶!
1-week range: Resistance at 116,000 and support at 108,000 4-hour range: Resistance at 126,000 and support at 102,000 A short position can be planned near 116,000, as the next potential move could target 75,000. In the previous bear market, it took roughly 365 candles from the top to the bottom. If the current top is 126,000, there’s a strong possibility this bearish trend could continue until around November 2026, when the bottom might form near 25,000 — a price level ideal for accumulation by large players. Remember: Smart money never buys at the highs — those levels are usually traps. Good luck.
MyTradingJournal6th
بیت کوین در کجاست؟ نبرد حیاتی گاوها و خرسها بر سر ۱۱۰ هزار دلار!
🔍 Technical Analysis Bitcoin is currently consolidating around the $110,500 zone on the 30-minute timeframe, showing mixed signals that require careful attention from traders. The price action reveals a critical inflection point where institutional players are likely positioning for the next directional move. Current Market Data: Price: $110,555.2 (+0.03%) Session Range: $110,330.4 - $110,610.1 Key Level: Trading below EMA 9 at $110,911.3 Timeframe: 30 Minutes (Binance Perpetual) 📊 Key Technical Observations 1. Moving Average Analysis The price is currently below the EMA 9 ($110,911.3), indicating short-term bearish pressure. The Moving Average Ribbon shows mixed signals with price consolidating between key dynamic support and resistance levels. 2. Smart Money Concepts Multiple LuxAlgo Smart Money Concept indicators are active, suggesting institutional order blocks and liquidity zones are being respected. This indicates smart money is actively participating in the current price range. 3. Volume Profile Volume remains moderate but consistent, suggesting controlled consolidation rather than aggressive selling or buying pressure. 4. Support & Resistance Framework Immediate Resistance: $110,610 (session high) Key Resistance Zone: $110,900 - $111,000 (EMA 9 confluence) Immediate Support: $110,330 (session low) Critical Support Zone: $110,000 - $110,200 (psychological level) ⚡ Key Catalysts to Watch Break above EMA 9 ($110,911) - Could trigger short-covering rally Volume expansion on breakout direction - Confirms institutional participation $110,000 psychological level test - Critical support for bulls Smart Money Concepts signals - Watch for order block reactions 🧠 Market Psychology The current consolidation reflects institutional accumulation/distribution phase. With Bitcoin trading near multi-year highs, both bulls and bears are positioning carefully. The 30-minute timeframe shows indecision, but a clear directional break with volume will likely trigger significant follow-through. Market Sentiment: Neutral (Consolidation Phase) Volatility: Medium (3.84% as per recent data) Institutional Flow: Mixed (Smart Money Concepts showing balanced activity) ⚠️ Risk Management Reminder Never risk more than 2% of your trading capital per trade Wait for volume confirmation before entering positions Bitcoin remains volatile - size positions accordingly Consider wider stops on lower timeframes due to noise 📝 Disclaimer: This analysis is for educational purposes only and not financial advice. Always conduct your own research and consult with qualified financial advisors before making trading decisions. Past performance does not guarantee future results. What's your take on Bitcoin's current consolidation? Drop your analysis in the comments below! 👇 #Bitcoin #BTC #TechnicalAnalysis #CryptoTrading #SmartMoney #TradingView
Disclaimer
Any content and materials included in Sahmeto's website and official communication channels are a compilation of personal opinions and analyses and are not binding. They do not constitute any recommendation for buying, selling, entering or exiting the stock market and cryptocurrency market. Also, all news and analyses included in the website and channels are merely republished information from official and unofficial domestic and foreign sources, and it is obvious that users of the said content are responsible for following up and ensuring the authenticity and accuracy of the materials. Therefore, while disclaiming responsibility, it is declared that the responsibility for any decision-making, action, and potential profit and loss in the capital market and cryptocurrency market lies with the trader.