
RSR
Reserve Rights
| تریدر | نوع سیگنال | حد سود/ضرر | زمان انتشار | مشاهده پیام |
|---|---|---|---|---|
 origami_capital33Rank: 4538 | خرید | حد سود: تعیین نشده حد ضرر: تعیین نشده | 12/18/2025 | |
 CryptoAnalystSignalRank: 30933 | خرید | حد سود: تعیین نشده حد ضرر: تعیین نشده | 12/17/2025 |
Price Chart of Reserve Rights
سود 3 Months :
سیگنالهای Reserve Rights
Filter
Sort messages by
Trader Type
Time Frame
origami_capital33
RSRUSDT – Clear Long After Liquidity Sweep
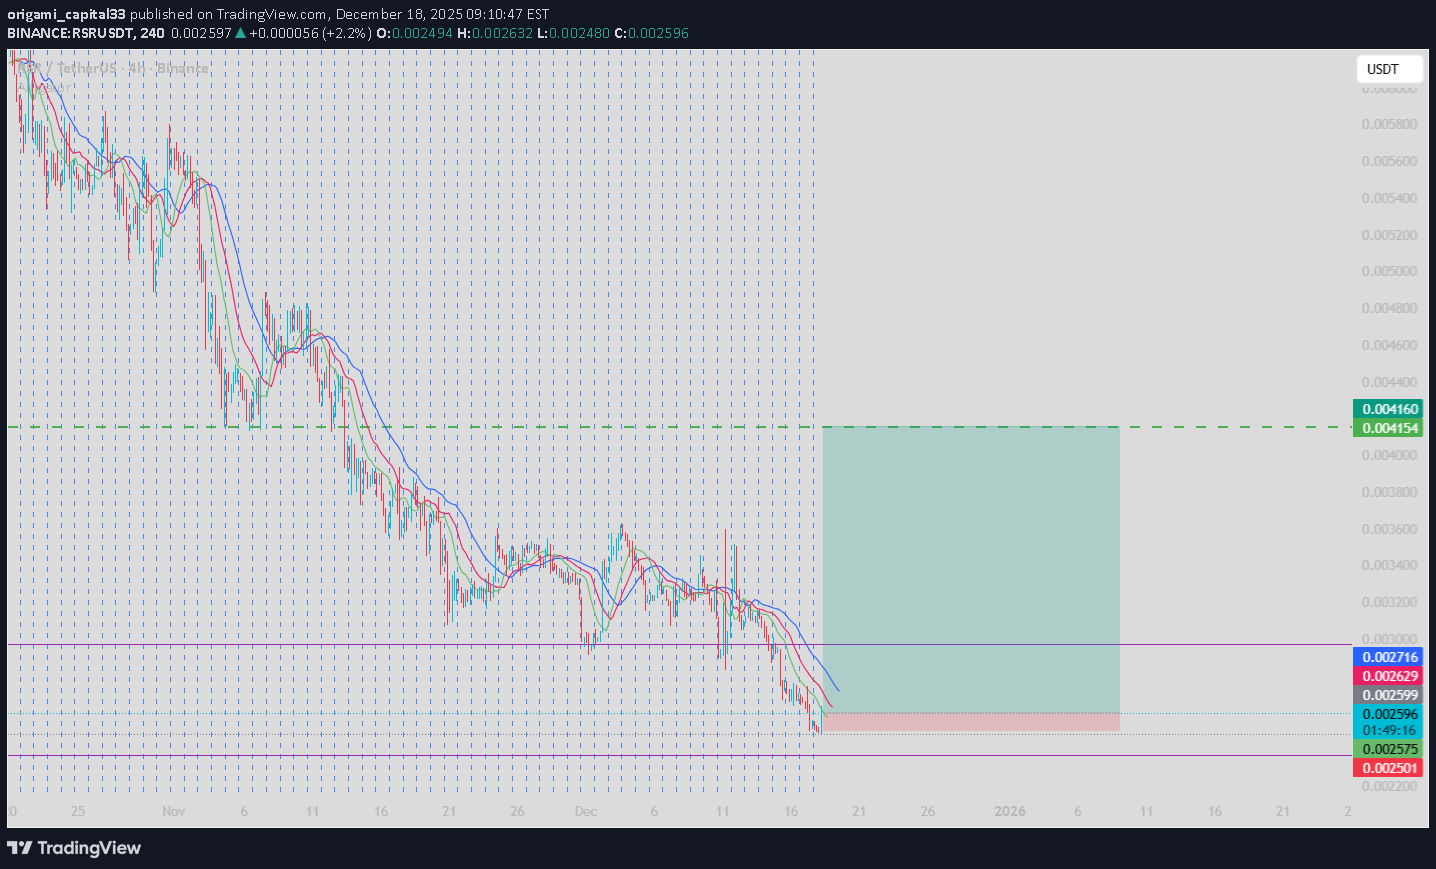
Sell-side liquidity has been fully cleared and price is now reacting strongly from demand. This move looks like stop-hunt → displacement → reversal, not continuation lower. • Bias: Long • Structure: Sell-side sweep + stabilization • Price holding above local demand • Expectation: Mean reversion into premium Entry zone: 0.00255 – 0.00260 Invalidation: Clean close below 0.00250 Targets: 0.00285 0.00320 0.00415 (range high / liquidity) As long as price holds above the sweep low, longs remain favored. Looking for continuation toward unfilled liquidity overhead. — Not financial advice. Trade responsibly.
CryptoAnalystSignal
#RSR/USDT Bullish Reversal in MAGICUSDT Accumulation
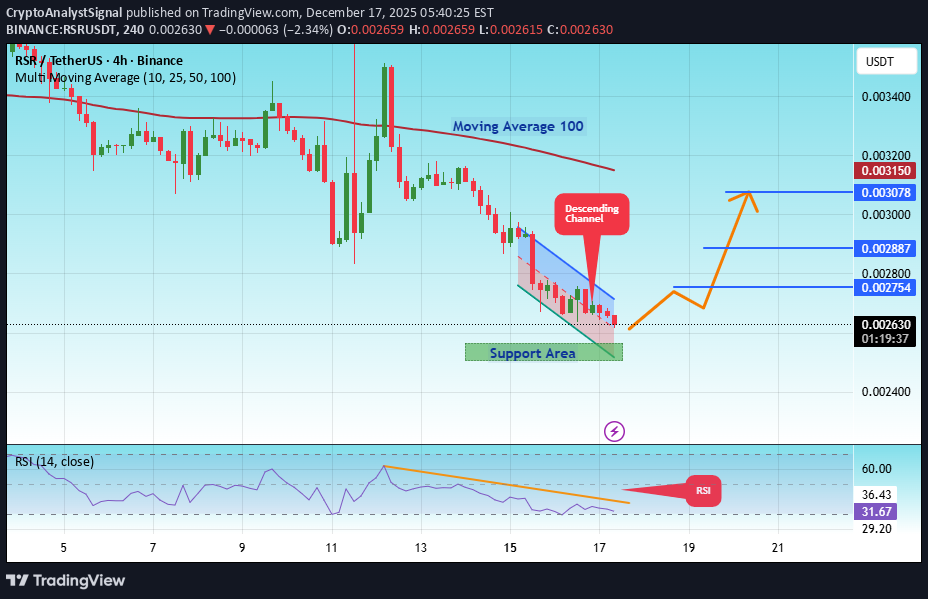
#RSR The price is moving in a descending channel on the 1-hour timeframe. It has reached the lower boundary and is heading towards breaking above it, with a retest of the upper boundary expected. We have a downtrend on the RSI indicator, which has reached near the lower boundary, and an upward rebound is expected. There is a key support zone in green at 0.002534. The price has bounced from this level multiple times and is expected to bounce again. We have a trend towards consolidation above the 100-period moving average, as we are moving close to it, which supports the upward movement. Entry price: 0.002628 First target: 0.002754 Second target: 0.002887 Third target: 0.003078 Don't forget a simple principle: money management. Place your stop-loss below the support zone in green. For any questions, please leave a comment. Thank you.
origami_capital33
کفنشینی RSR: آیا بزرگترین برگشت قیمتی در راه است؟ (تحلیل پُرریسک/پاداش)

rsr is consolidating at a significant weekly support level after a prolonged downtrend. This zone, around 0.00326–0.00328, has acted as both a previous resistance and now a defended support, indicating potential seller exhaustion. If buyers step in here, this could form a major reversal base for a long setup. • Direction: Long (Conditional on bullish confirmation) • Entry Zone: 0.00326 – 0.00328 (on a bullish reversal candle or break above consolidation high) • Stop Loss: 0.00305 (below the recent swing low and weekly support) • Target: 0.00360 – 0.00380 -0.00480(previous consolidation zone / HTF resistance) • R/R: High‑quality mean reversion setup – well‑defined risk below key support, clear first target toward equilibrium. Key ICT/SMC Observations: Price is consolidating at a major weekly support level, showing decreased selling momentum. Liquidity likely swept below 0.00326 on recent wicks, trapping sellers. A break above 0.00330 would confirm a short‑term market structure shift. The Fair Value Gap from any bullish displacement will provide the optimal ent
origami_capital33
سیگنال خرید قوی RSR/USDT: ورود بر اساس تکنیکهای ICT و SMC (با هدف 3.2:1)
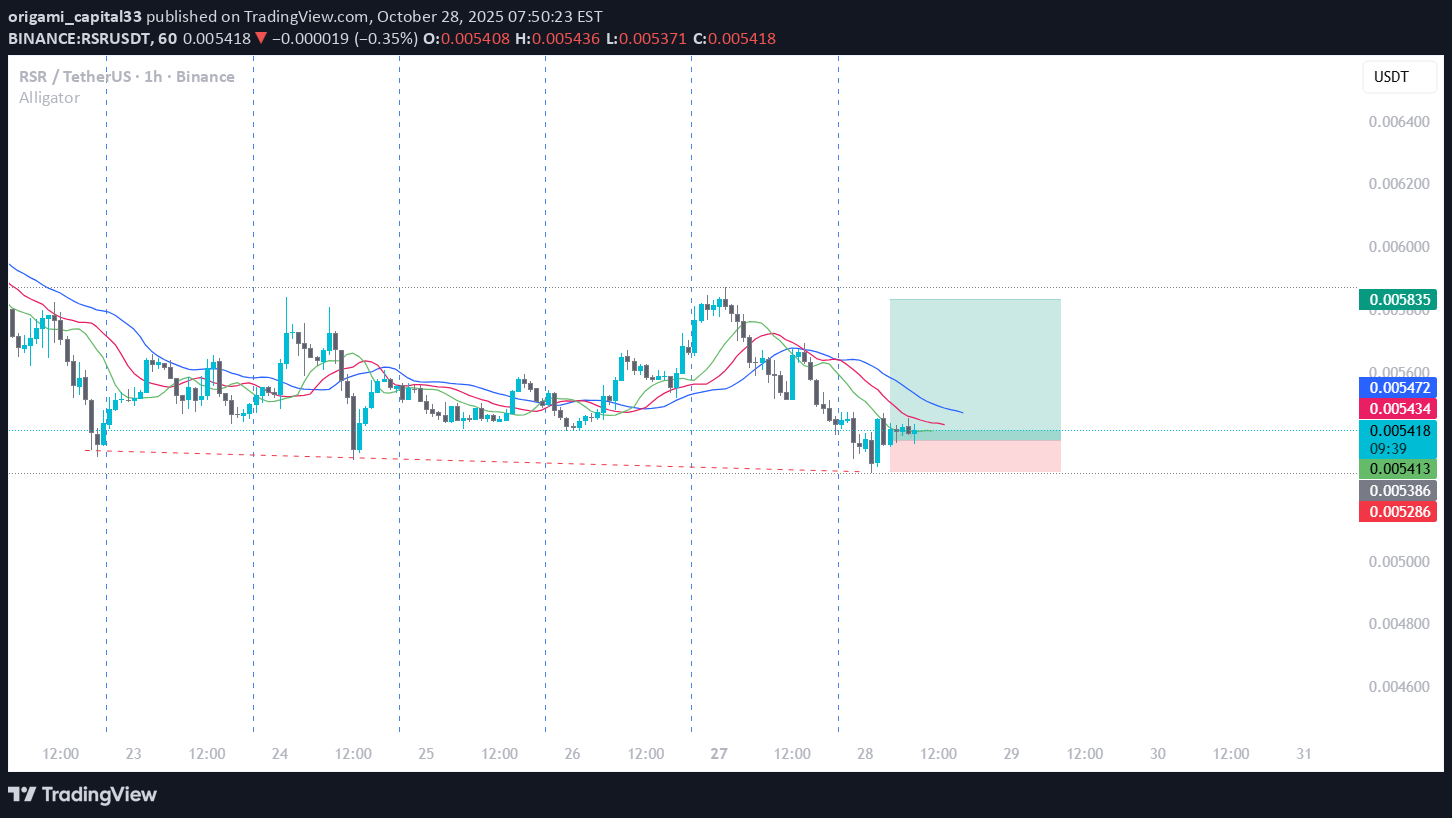
🟢 RSR/USDT | 1H Long Setup Concepts: ICT | SMC | Bill Williams Price is showing signs of a short-term bullish reversal after reaching a discount zone within the higher-timeframe range. Liquidity was taken below previous lows, sweeping sell-side liquidity — a classic ICT manipulation-to-displacement setup. The Alligator indicator (Bill Williams) is starting to compress, showing potential for a phase transition from accumulation to the next impulsive wave. The lips (green), teeth (red), and jaw (blue) are beginning to align for a possible bullish cross, hinting at trend awakening. Smart Money Confirmation (SMC): Liquidity sweep: Below equal lows Market structure shift: Minor break of structure on LTF Entry: On fair value gap (FVG) + alligator compression zone Stop loss: Below liquidity sweep zone (0.005286) Take profit: Targeting the previous structural high (0.005835) Trade idea: 🟩 Entry: 0.00543 🔴 Stop: 0.00528 🎯 TP: 0.00583 RR ≈ 3.2:1 📈 If bullish momentum continues and the Alligator opens upward with green lips leading, we could see continuation toward the upper range liquidity.

SaaDesigns
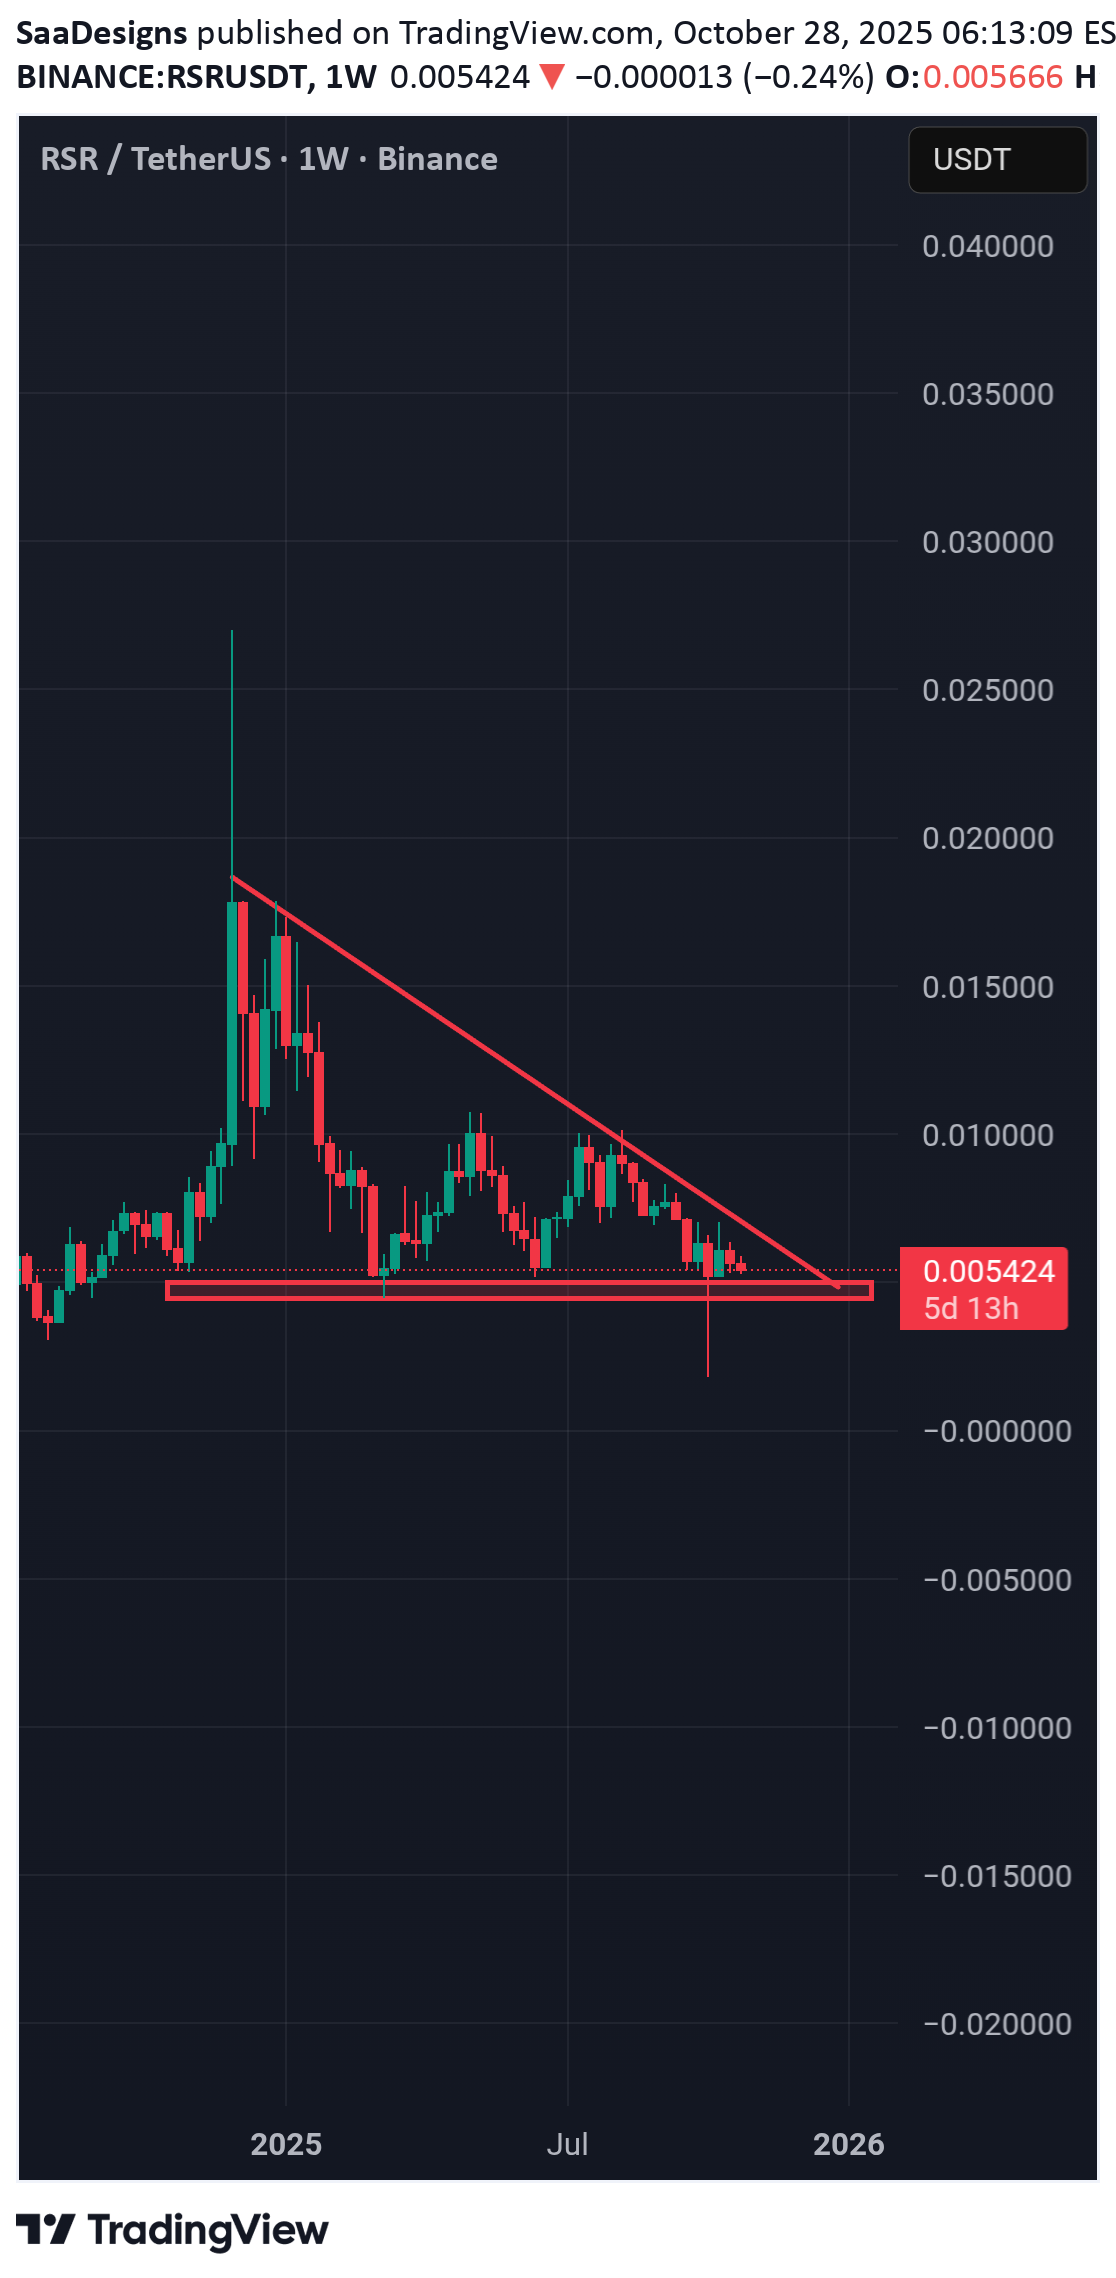

BandForBands
RSR: آماده جهش 300 درصدی؟ تحلیل ساختار و نسبت ریسک به ریوارد عالی


CryptoCheckGroup
آیا ریپل سکیور (RSR) آماده انفجار قیمتی همزمان با بیت کوین است؟

Reserve currency is my favorite altcoin, doesn't get pushed much but there is a litany of fundmentals that make it a solid choice. As far as technicals go, we may have passed that last best spot to purchase RSR. hitting the weekly midline here in the channel. It wouldn't be a bad time to buy now though. RSR has been compressing for nearly a year now. Compression causes price to consolidate, the order book gets denser until volatility moves price past areas where there's no orderflow. RSR's price action has been correlating strongly with Bitcoin's movements. If we're at the cusp of Bitcoin's meltup, I'd say so is RSR.

CryptoNuclear
RSR/USDT — Accumulation Zone: Ready Rally or Breakdown?

🔎 Overview RSR is standing at a major crossroads. After enduring a prolonged downtrend (2021–2023), the token entered a strong accumulation phase and staged a notable rally in 2024. However, throughout mid-2025, the momentum stalled and price action slipped back into sideways consolidation. Now, RSR is testing the key support zone (0.0040 – 0.0060), a level that has repeatedly acted as a battleground between bulls and bears. The outcome here will likely dictate the next major trend. --- 📊 Key Technical Levels Primary Support (Yellow Box): 0.0040 – 0.0060 → the accumulation base. Minor Resistance: 0.007089 → first breakout trigger. Major Resistance: 0.009605 → confirmation of mid-term bullish momentum. Extended Target: 0.018389 → potential rally target if sentiment flips positive. Risk Zone: 0.001603 → historical low if breakdown occurs. --- 📈 Bullish Scenarios 1. Bounce from Support (Conservative) Price holds above 0.0058–0.006. 5D close above 0.007089 with rising volume. Targets: 0.0096 → 0.0183. Strategy: Enter near support, scale out profits, set SL below 0.004. 2. Aggressive Breakout Direct breakout above 0.0096 with strong 5D candle. Mid-term bullish confirmation. Targeting 0.0183 with potential for a bigger swing. 📌 Narrative: If RSR holds this accumulation zone, the market could treat it as the “last cheap zone” before a stronger rally unfolds. --- 📉 Bearish Scenarios 1. Support Breakdown 5D close below 0.0040 with heavy sell volume. Likely retest of historical low at 0.0016. Strategy: Exit longs, wait for re-entry at lower levels. 2. False Breakout Price spikes above 0.0070 but fails to hold. Quick rejection back into the range, signaling seller dominance. 📌 Narrative: A failed defense of this support could trigger a new capitulation phase, dragging RSR back toward extreme lows. --- 🌀 Pattern & Sentiment Current structure: range-bound accumulation. The yellow box = decision-making zone. Market-wide sentiment (BTC & altcoins) will heavily influence whether RSR breaks higher or falls further. --- 🎯 Trading Strategies Swing Traders: Accumulate near 0.0058–0.006 with tight SL, scale profits. Breakout Traders: Wait for confirmed closes above 0.0070 / 0.0096. Risk Management: Limit risk to ≤ 2–3% per trade. --- 📌 Conclusion RSR/USDT is at a make-or-break accumulation zone. If support holds → bullish potential toward 0.0096 and 0.0183. If support breaks → bearish risk down to 0.0016. This is a crucial moment for both traders and holders — the yellow box will determine the next big move. #RSR #RSRUSDT #CryptoAnalysis #SupportResistance #AccumulationZone #BullishScenario #BearishScenario #AltcoinAnalysis

ZelfTrade
$RSRUSDT – Testing the Big Level Again

Risking some small bids here. The weekly chart has tested the 0.010 zone five times already — and often the sixth time is the charm. Context-wise, September might be a quiet month, not expecting much immediate action. But that makes it a good time to position early. 🔑 Key level: reclaim 0.01 📈 Expectation: an easy 2x move from there ⏳ Plan: slowly scaling in, will re-evaluate once 0.01 is cleared Sometimes the best plays are built in the quiet months before the expansion.

Innotrade_AJ
RSR/USDT: Bullish Momentum Building on Multiple Timeframes

BEFORE WE BEGINN SUBSCRIBE, BOOST AND COMMENT OUR HIGH QUALITY ANALYSIS. Firstly, our Algo-based indicators are used to create this analysis. This analysis takes a look at the RSR/USDT pair on both the daily (1D) and weekly (1W) charts, revealing a confluence of bullish signals that suggest potential for significant upward movement. Weekly (1W) Chart Analysis: The weekly chart for RSR/USDT is showing strong signs of a bullish reversal and continuation. A key feature is the "Liquidity Sweep OrderBlock with a B-Buy signal" located in the lower price region. This indicates that a significant level where sell-side liquidity was resting has been swept, and buyers have since stepped in with force. The price is currently respecting a supportive trendline and has broken out of a bearish trend. The indicator below the main chart, labeled "Innotrade MC Signal with Volume Confirmation," shows a "BUY" signal, with the reading "Above 50 and Volatility Band- Bullish." This suggests that momentum is in favor of the bulls and is supported by volume. Additionally, the multi-timeframe status table indicates "Overbought" conditions on most timeframes, which, while sometimes a precursor to a pullback, in this context of a strong breakout can also signify strong buying pressure. Daily (1D) Chart Analysis: The daily chart reinforces the bullish sentiment seen on the weekly timeframe. The price appears to be in an uptrend, holding above several key moving averages (EMA 100, 200, 400, 800, 1000). We can observe multiple "B" (Buy) signals as the price interacts with key support levels and moving averages. Similar to the weekly chart, the daily chart shows an indicator table where the RSI Status is a "Bull Trend" across most timeframes from 15 minutes to daily, and the MC Status is "Overbought." This widespread bullish and overbought reading suggests a strong, sustained buying interest in the short to medium term. Synthesis and Outlook: Both the weekly and daily charts for RSR/USDT are aligning to paint a bullish picture. The weekly chart provides the macro view of a potential trend reversal, confirmed by a liquidity sweep and strong momentum indicators. The daily chart offers a more granular look, showing consistent buying pressure and respect for key technical support levels. The combination of these factors suggests that RSR/USDT is positioned for further upside. Traders might consider looking for entry opportunities on minor pullbacks, with an eye on the higher price levels suggested by the ascending channel on the weekly chart. Disclaimer: This is not financial advice. The analysis is for educational purposes only. Please conduct your own research before making any trading decisions.
Disclaimer
Any content and materials included in Sahmeto's website and official communication channels are a compilation of personal opinions and analyses and are not binding. They do not constitute any recommendation for buying, selling, entering or exiting the stock market and cryptocurrency market. Also, all news and analyses included in the website and channels are merely republished information from official and unofficial domestic and foreign sources, and it is obvious that users of the said content are responsible for following up and ensuring the authenticity and accuracy of the materials. Therefore, while disclaiming responsibility, it is declared that the responsibility for any decision-making, action, and potential profit and loss in the capital market and cryptocurrency market lies with the trader.