
ROSE
Oasis Network
| تریدر | نوع سیگنال | حد سود/ضرر | زمان انتشار | مشاهده پیام |
|---|---|---|---|---|
No results found. | ||||
Price Chart of Oasis Network
سود 3 Months :
سیگنالهای Oasis Network
Filter
Sort messages by
Trader Type
Time Frame

Cryptojobs
ROSE - BULLISH OUTLOOK STILL ONGOING
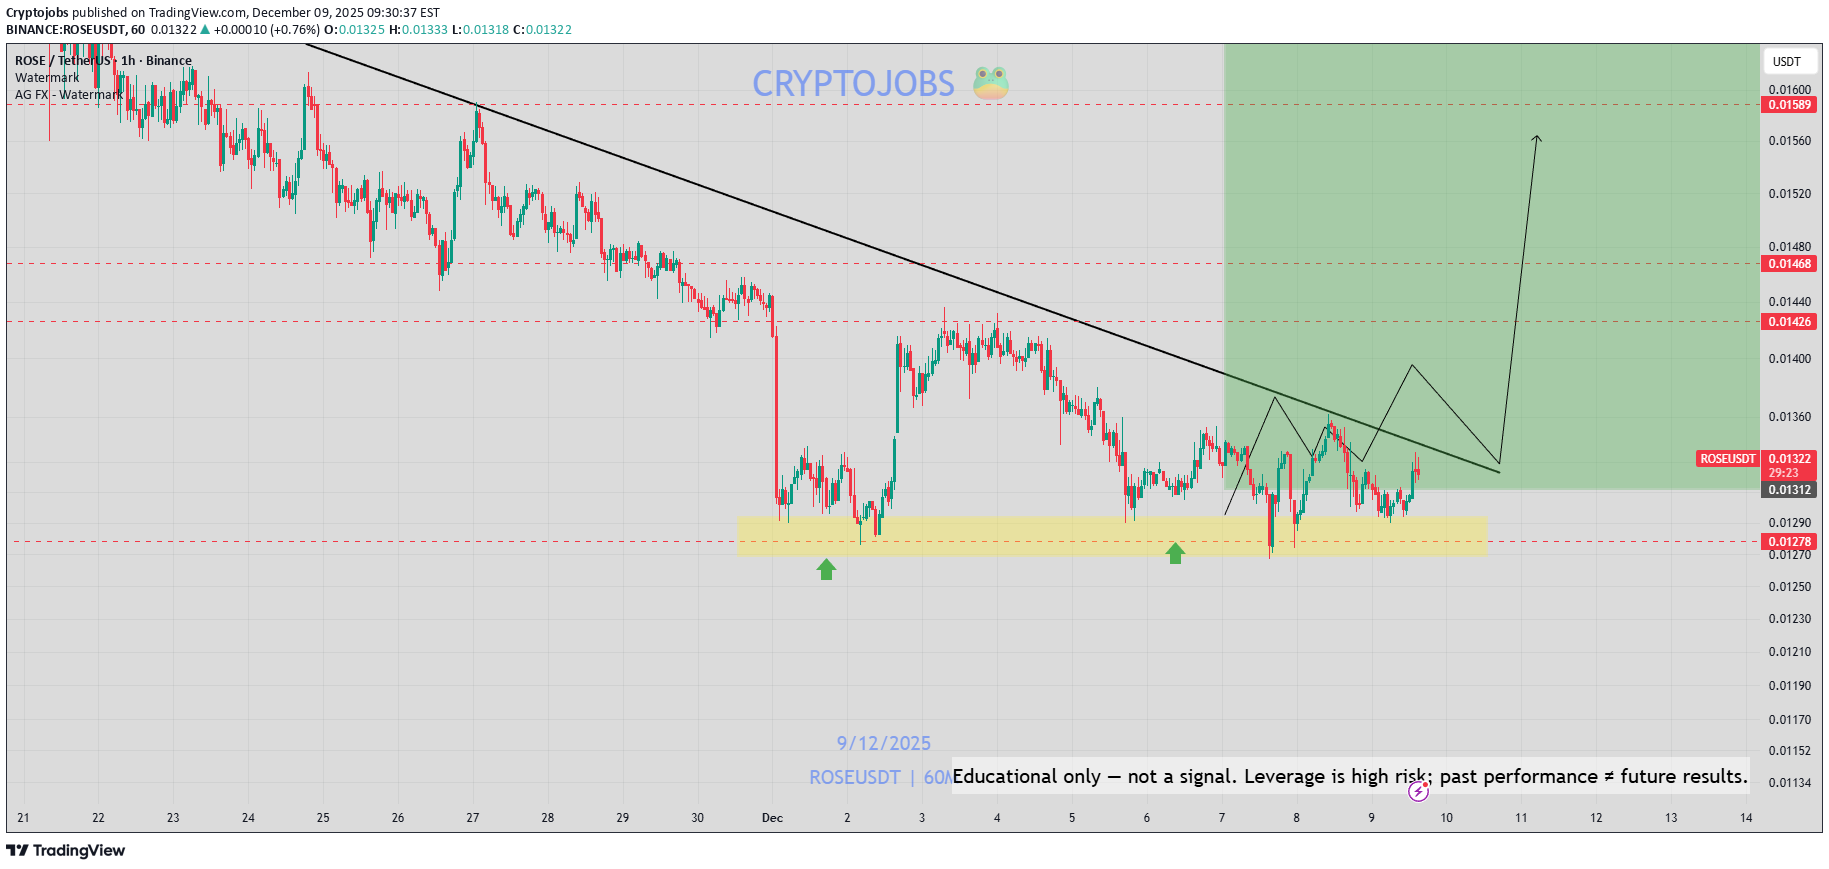
Same view to me on ROSE Bullish above the yellow zone; 📈 Breakout could happen soon!

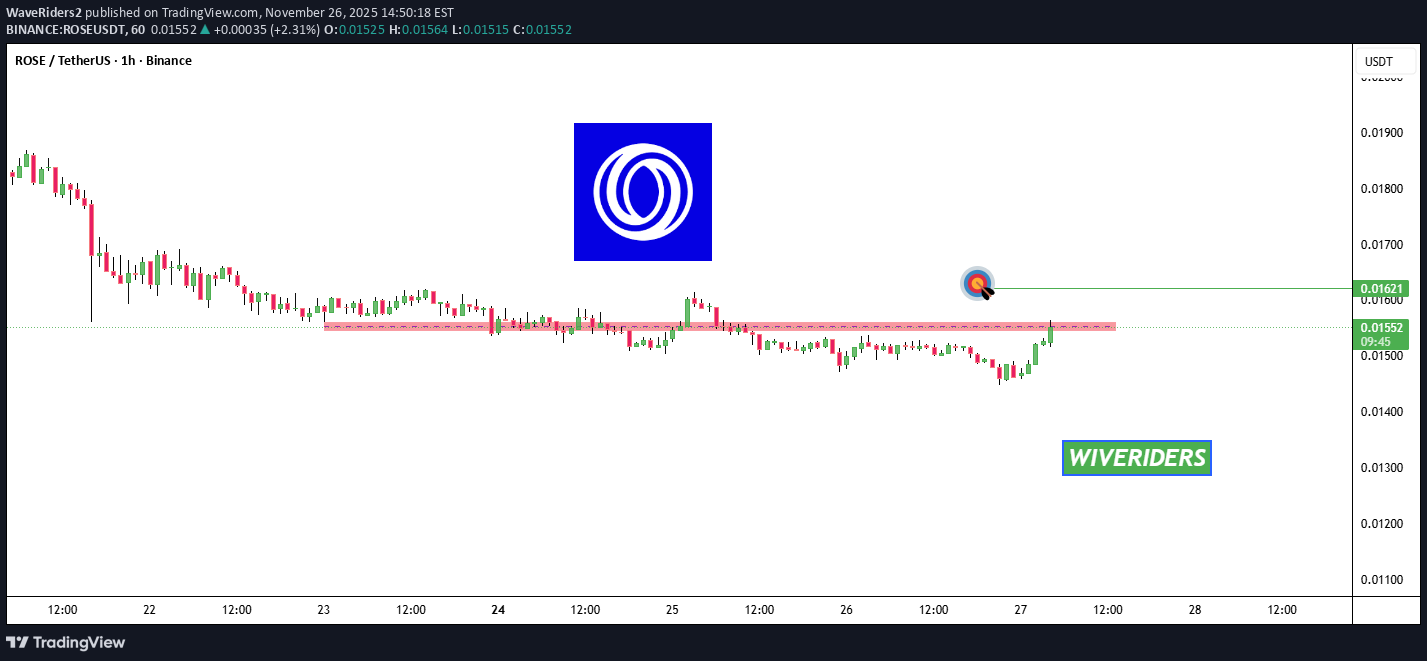
WaveRiders2
بررسی فوری ارز ROSE: آیا قیمت به زودی مقاومت قرمز را میشکند؟ (هدف بعدی کجاست؟)

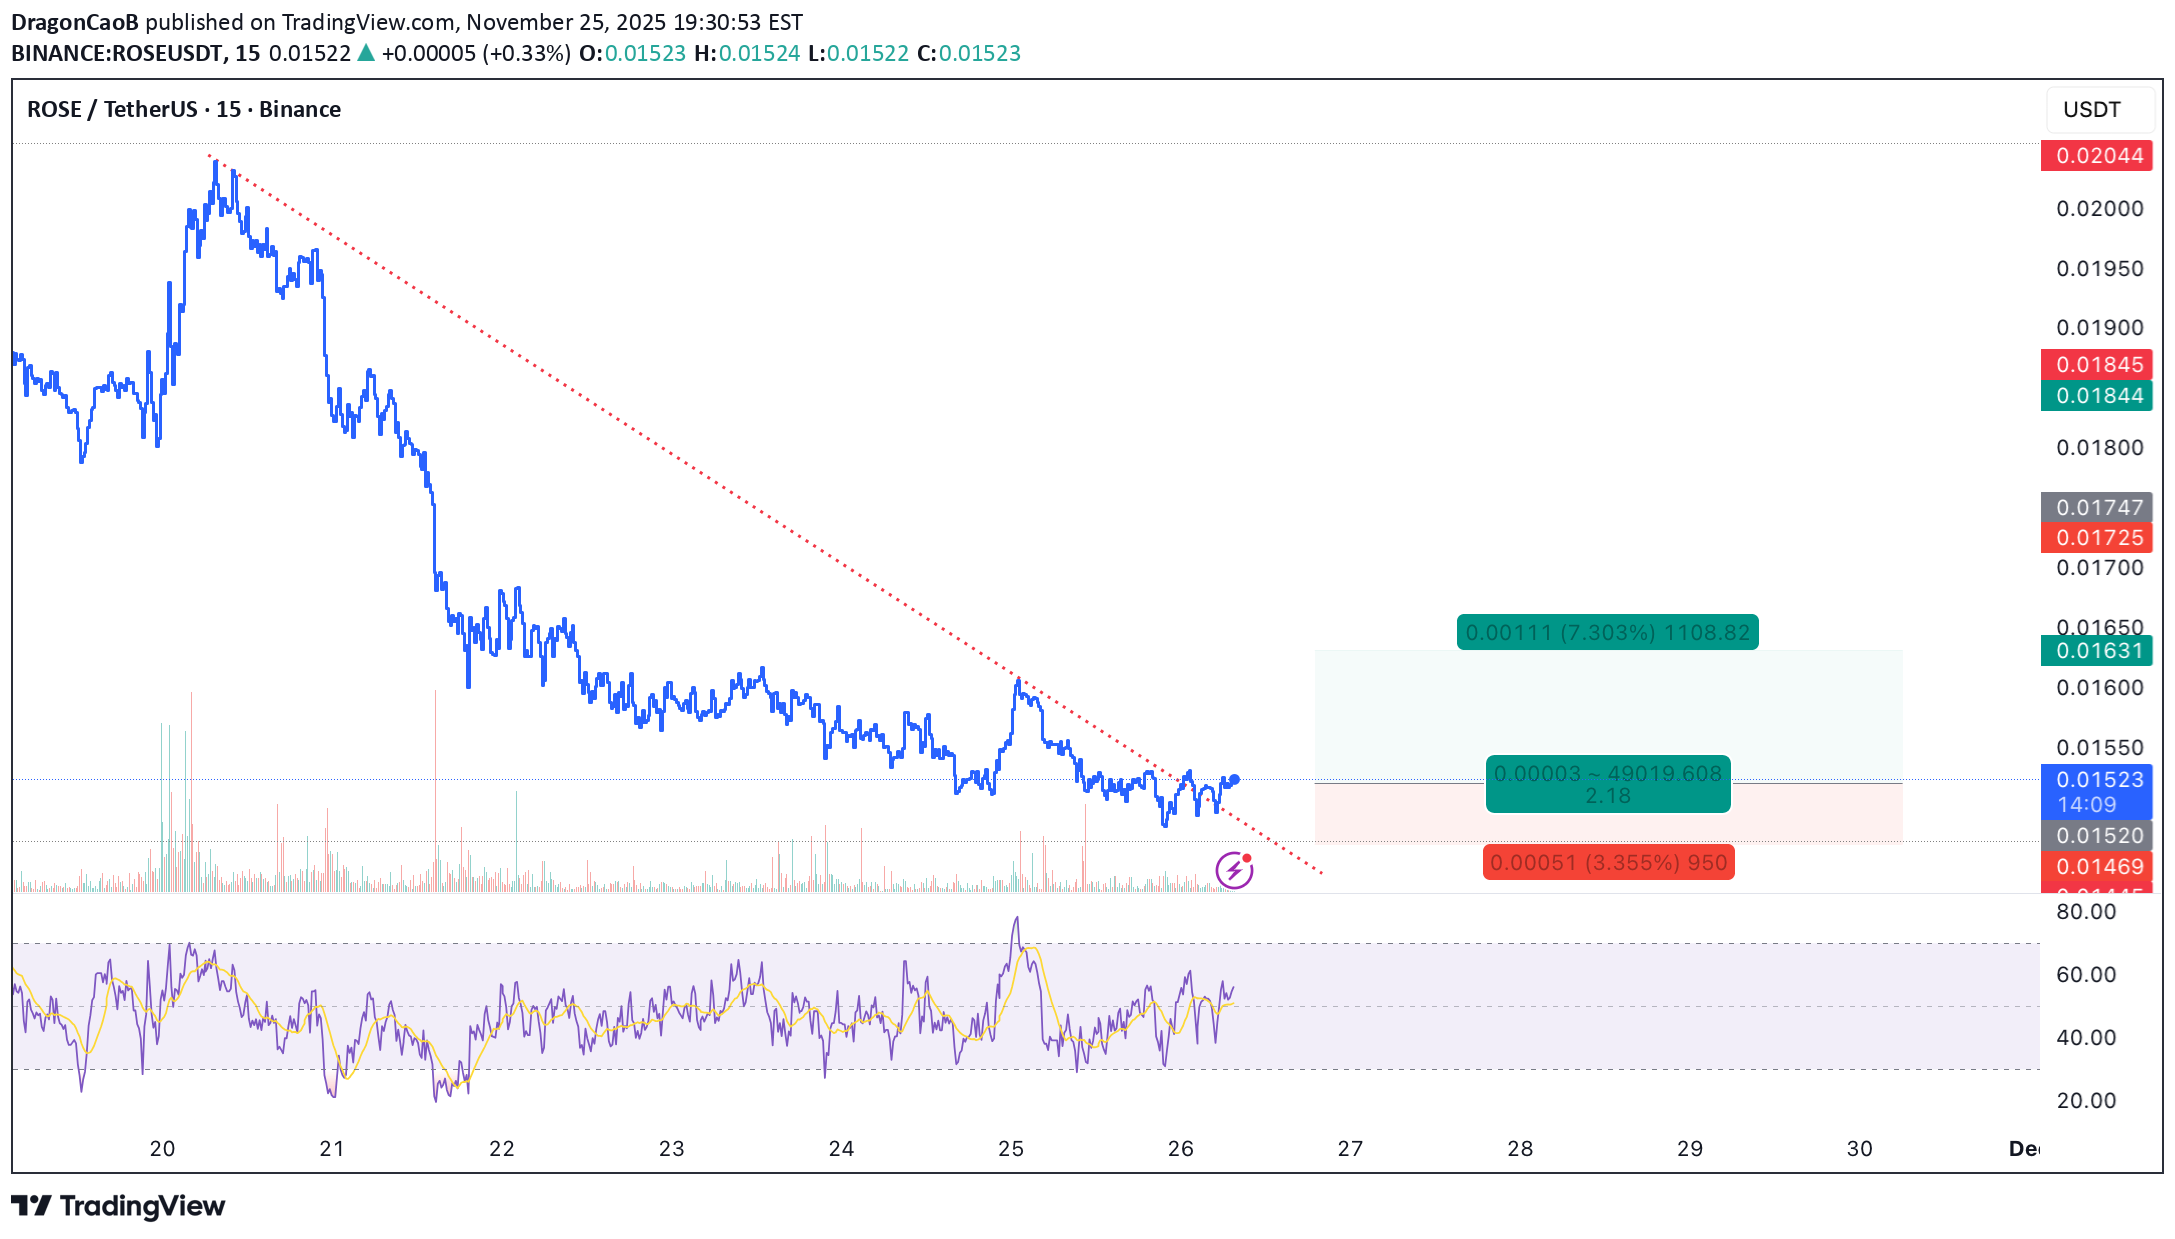
DragonCaoB
سیگنال خرید قوی ROSE: شکست روند نزولی و آماده صعود به قله قبلی!
🐂 Scalp LONG – ROSE ROSE has broken its short-term downtrend and is now stabilizing above a strong multi-timeframe support zone. RSI is turning upward, indicating improving momentum. With structure shifting bullish and overhead resistance nearby, a retest of the recent high is likely. Key Signals Short-term downtrend clearly broken Price holding firmly above strong support RSI rising → momentum recovery underway 🎯 TP: 0.01631 🛡️ SL: 0.01469 📊 RR: 1 : 2.18 A clean long setup aiming for a continuation push toward the previous high.

MuratKrkn
پیشبینی هیجانانگیز قیمت ROSE تا سال 2026: آیا این ارز صعود خواهد کرد؟
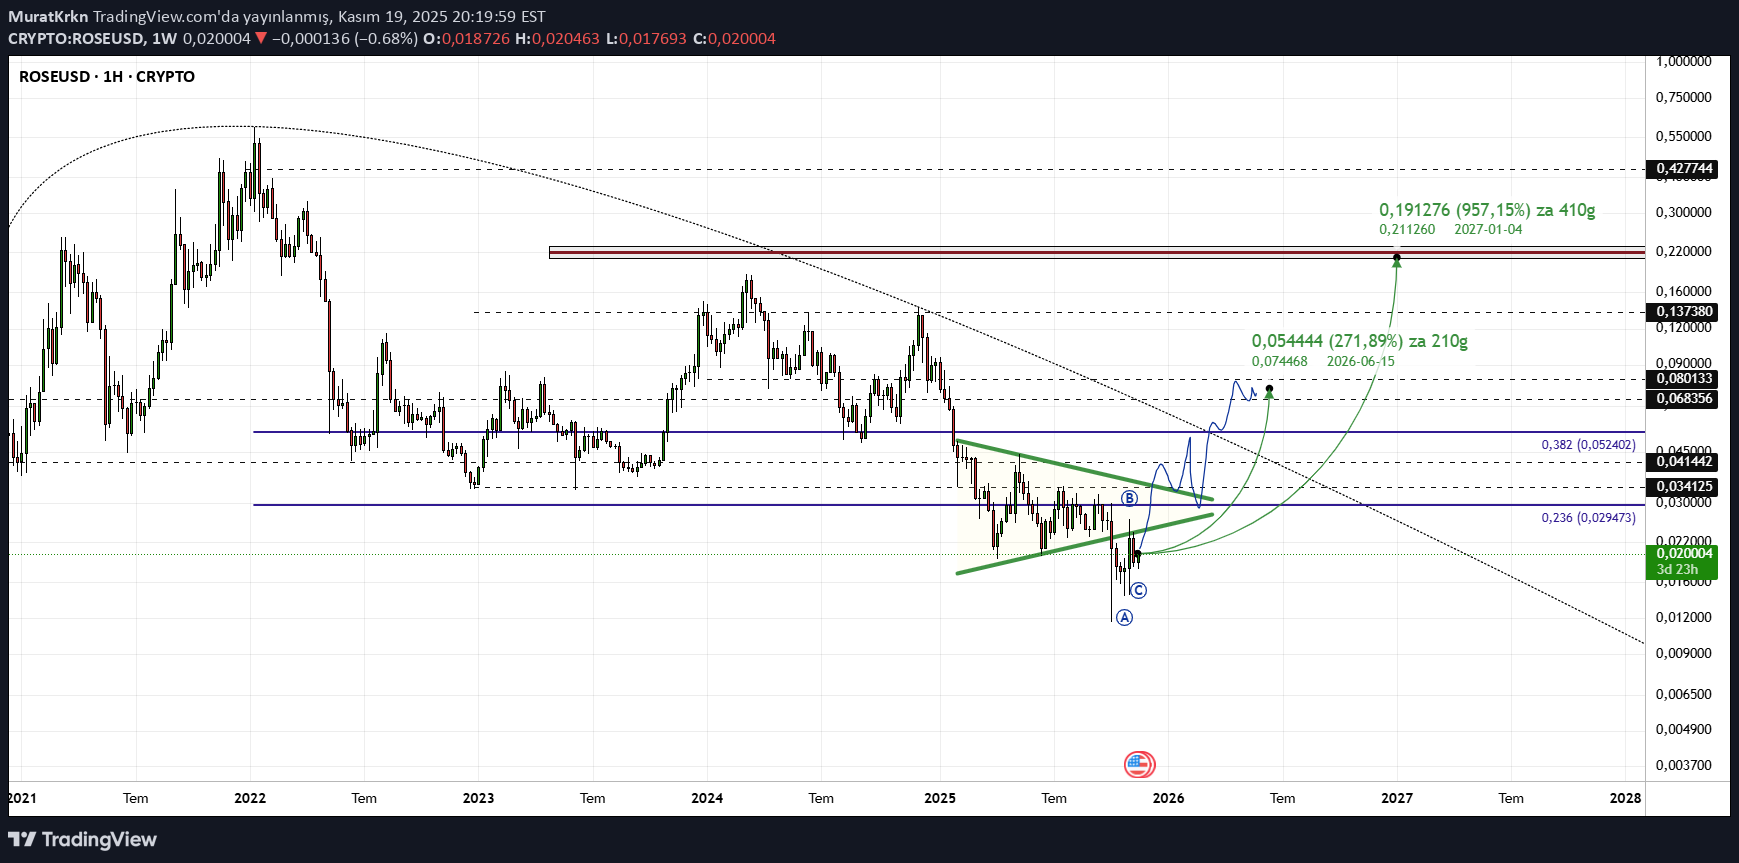
My 2026 goal for Rose. In the chart, I have indicated the levels I expect the rise to reach, which will start in December. rose movements are very positive. The level to be cleared starts within the green triangle. Since it is a weekly chart, I make updates over time according to the flow.
Cryptojobs
پیشبینی صعودی هیجانانگیز ROSE: آیا کف قیمت مشخص شد؟
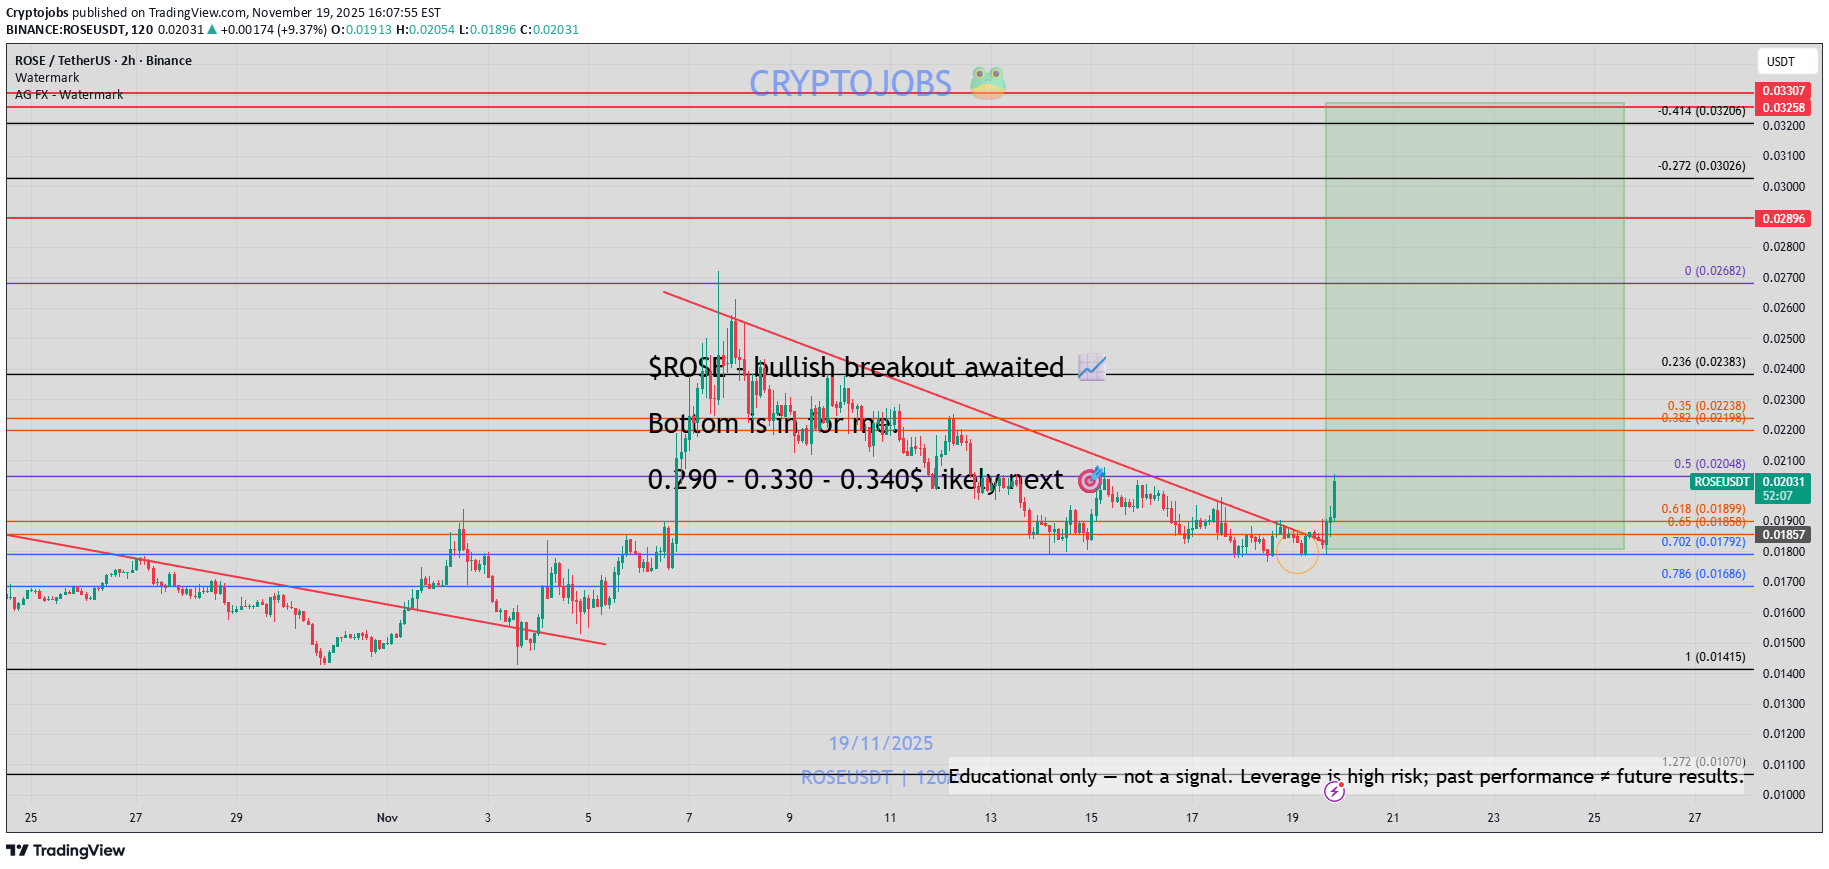
ROSE - bullish breakout awaited 📈 Bottom is in for me. 0.290 - 0.330 - 0.340$ likely next 🎯

iMoneyTeam
تحلیل قوی خرید (Long): منتظر واکنش قیمتی در ناحیه تقاضا باشید!
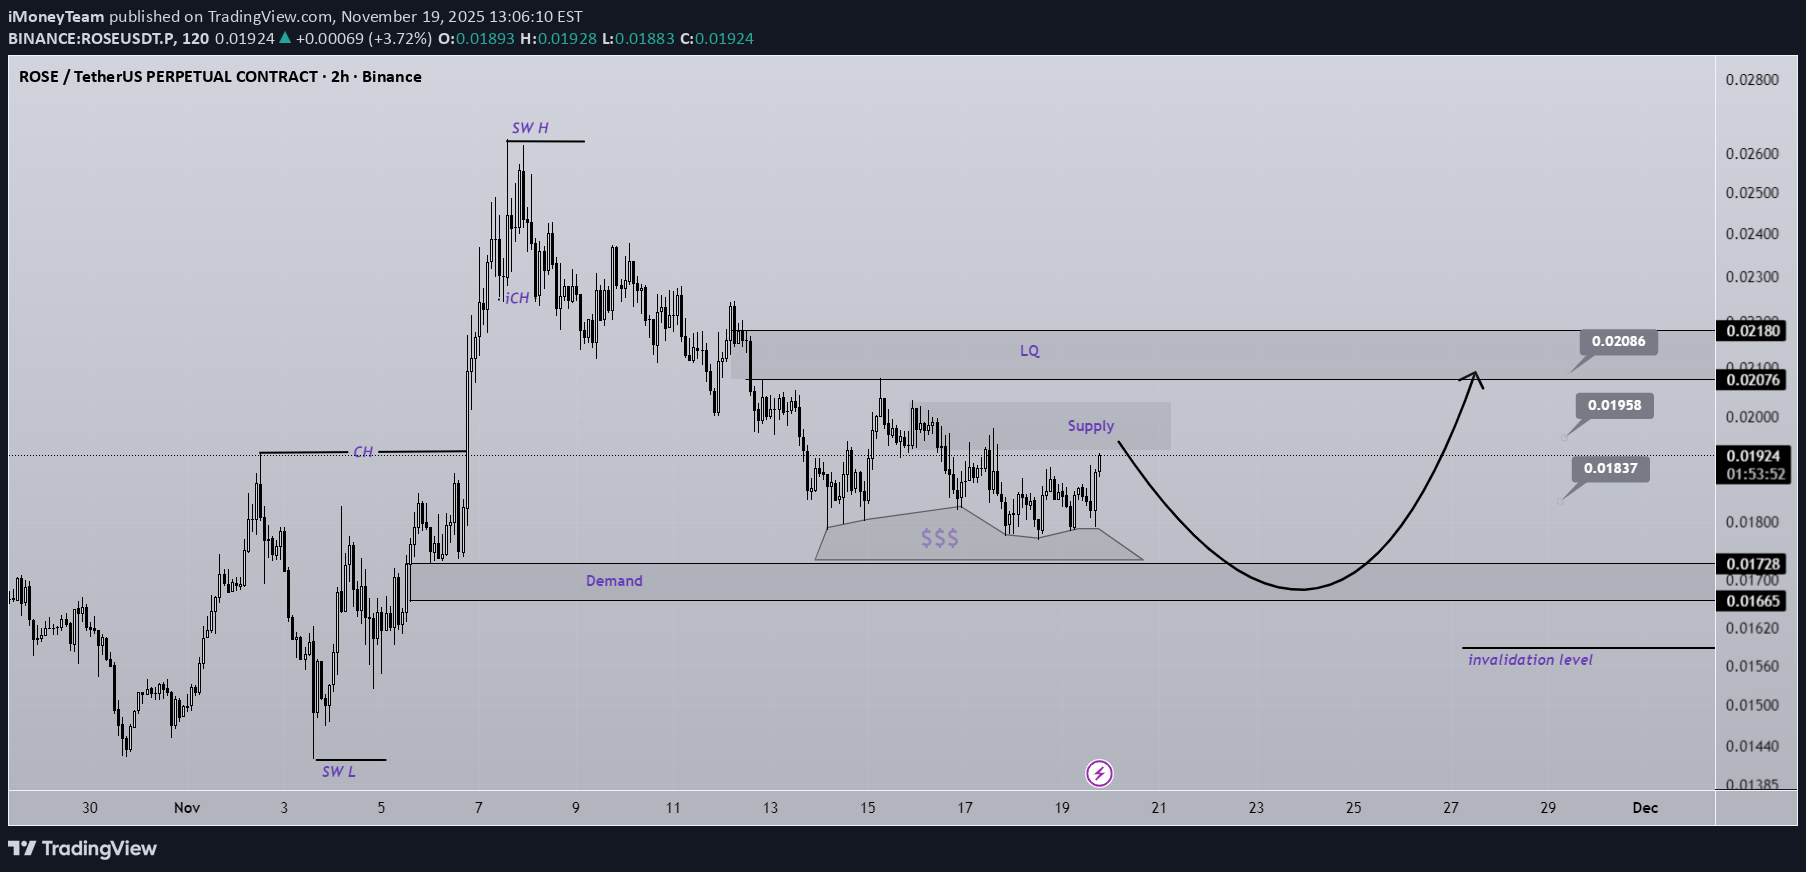
This is a buy/long setup | do not use it as a sell/short setup. We have a solid support zone on the chart with significant liquidity resting around it. Price is expected to show a strong rejection upon tapping the demand zone. The targets are marked on the chart. A 4-hour candle closing below the invalidation level will invalidate this analysis. Do not enter the position without capital management and stop setting Comment if you have any questions thank you
Cryptojobs
تحلیل جدید قیمت ROSE: آیا روند نزولی ادامه دارد یا الگوی فنجان و دسته شکل میگیرد؟
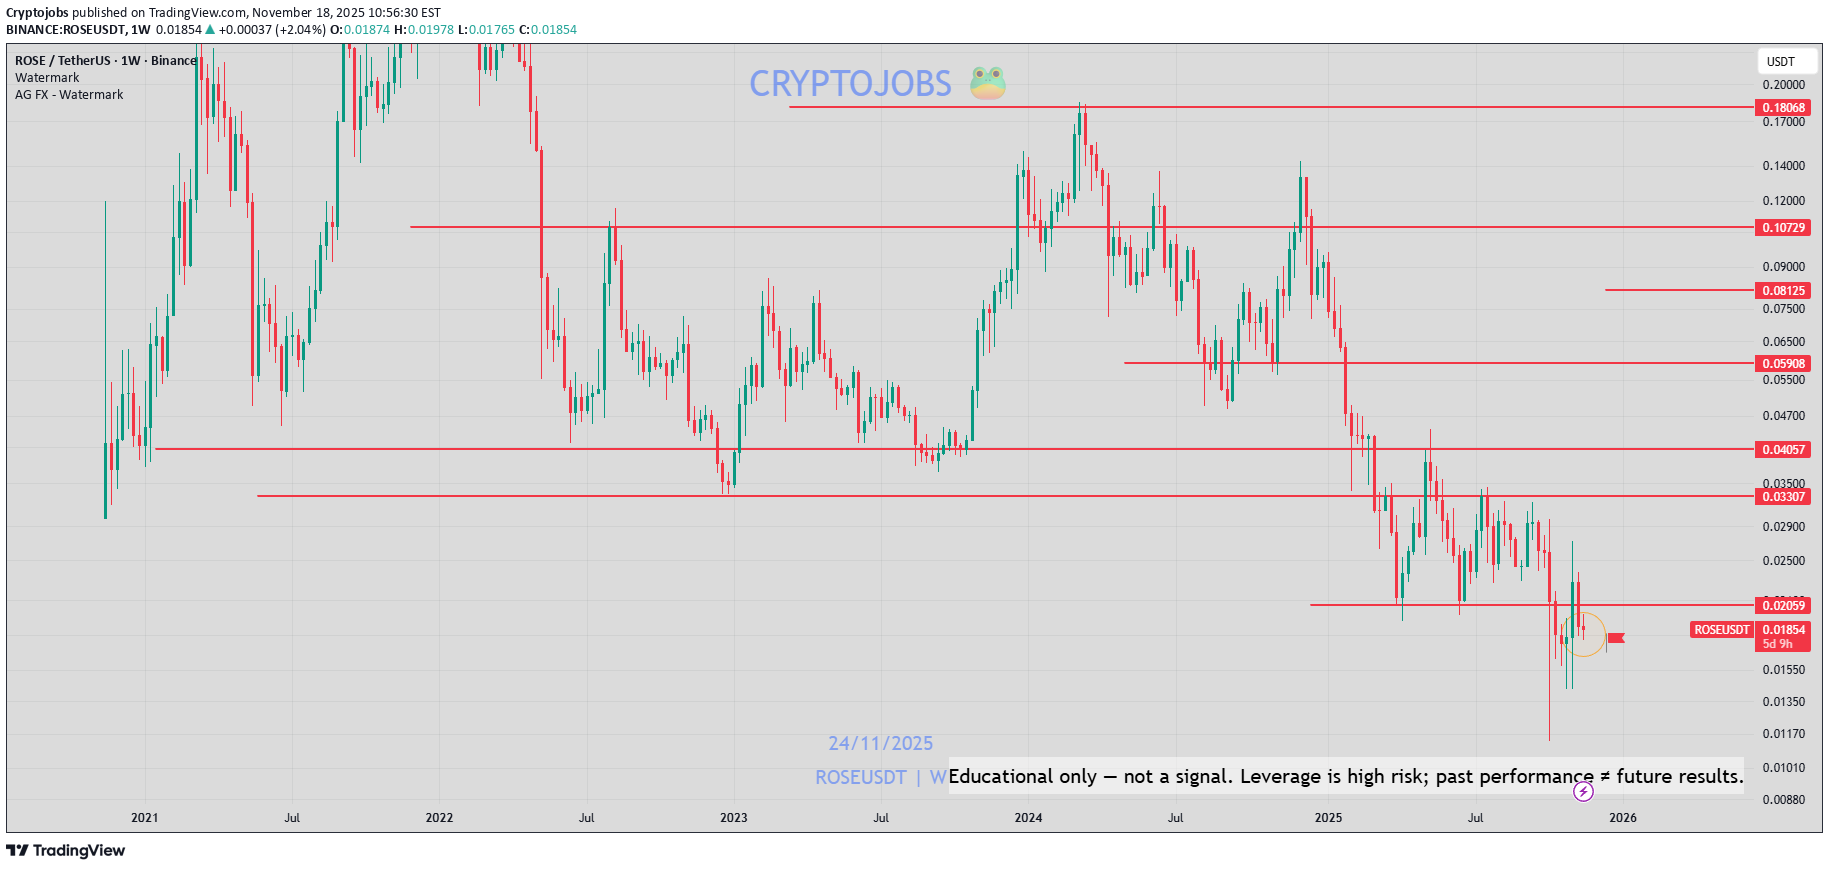
ROSE - Update: Bearish trend still ongoing 📉 WEEKLY CANDLE = DOJI = NEUTRAL Neutral on the daily, still bearish bias. Many resistances to be break again: 0.1875 - 0.2070 - 0.1980 - 0.2180 .. 📉Following the H1 structure: 0.160 - 0.1680$ support could be visit next 🚀On the other hand, it could be a Cup & Handle pattern, (bullish setup). 🔴 Weekly support to be maintained: 0.1740$ If #BTC bottomed at 88,000$, then ROSE will likely bottom too (H4 view --> Second chart). My bias: Short term ==> Still bearish bias under resistances, but possibly long term bullish structure.

AndrewsMarket-Mastery
تحلیل تکنیکال ROSE/USDT: آیا الگوی گُوِه نزولی نویدبخش انفجار صعودی است؟
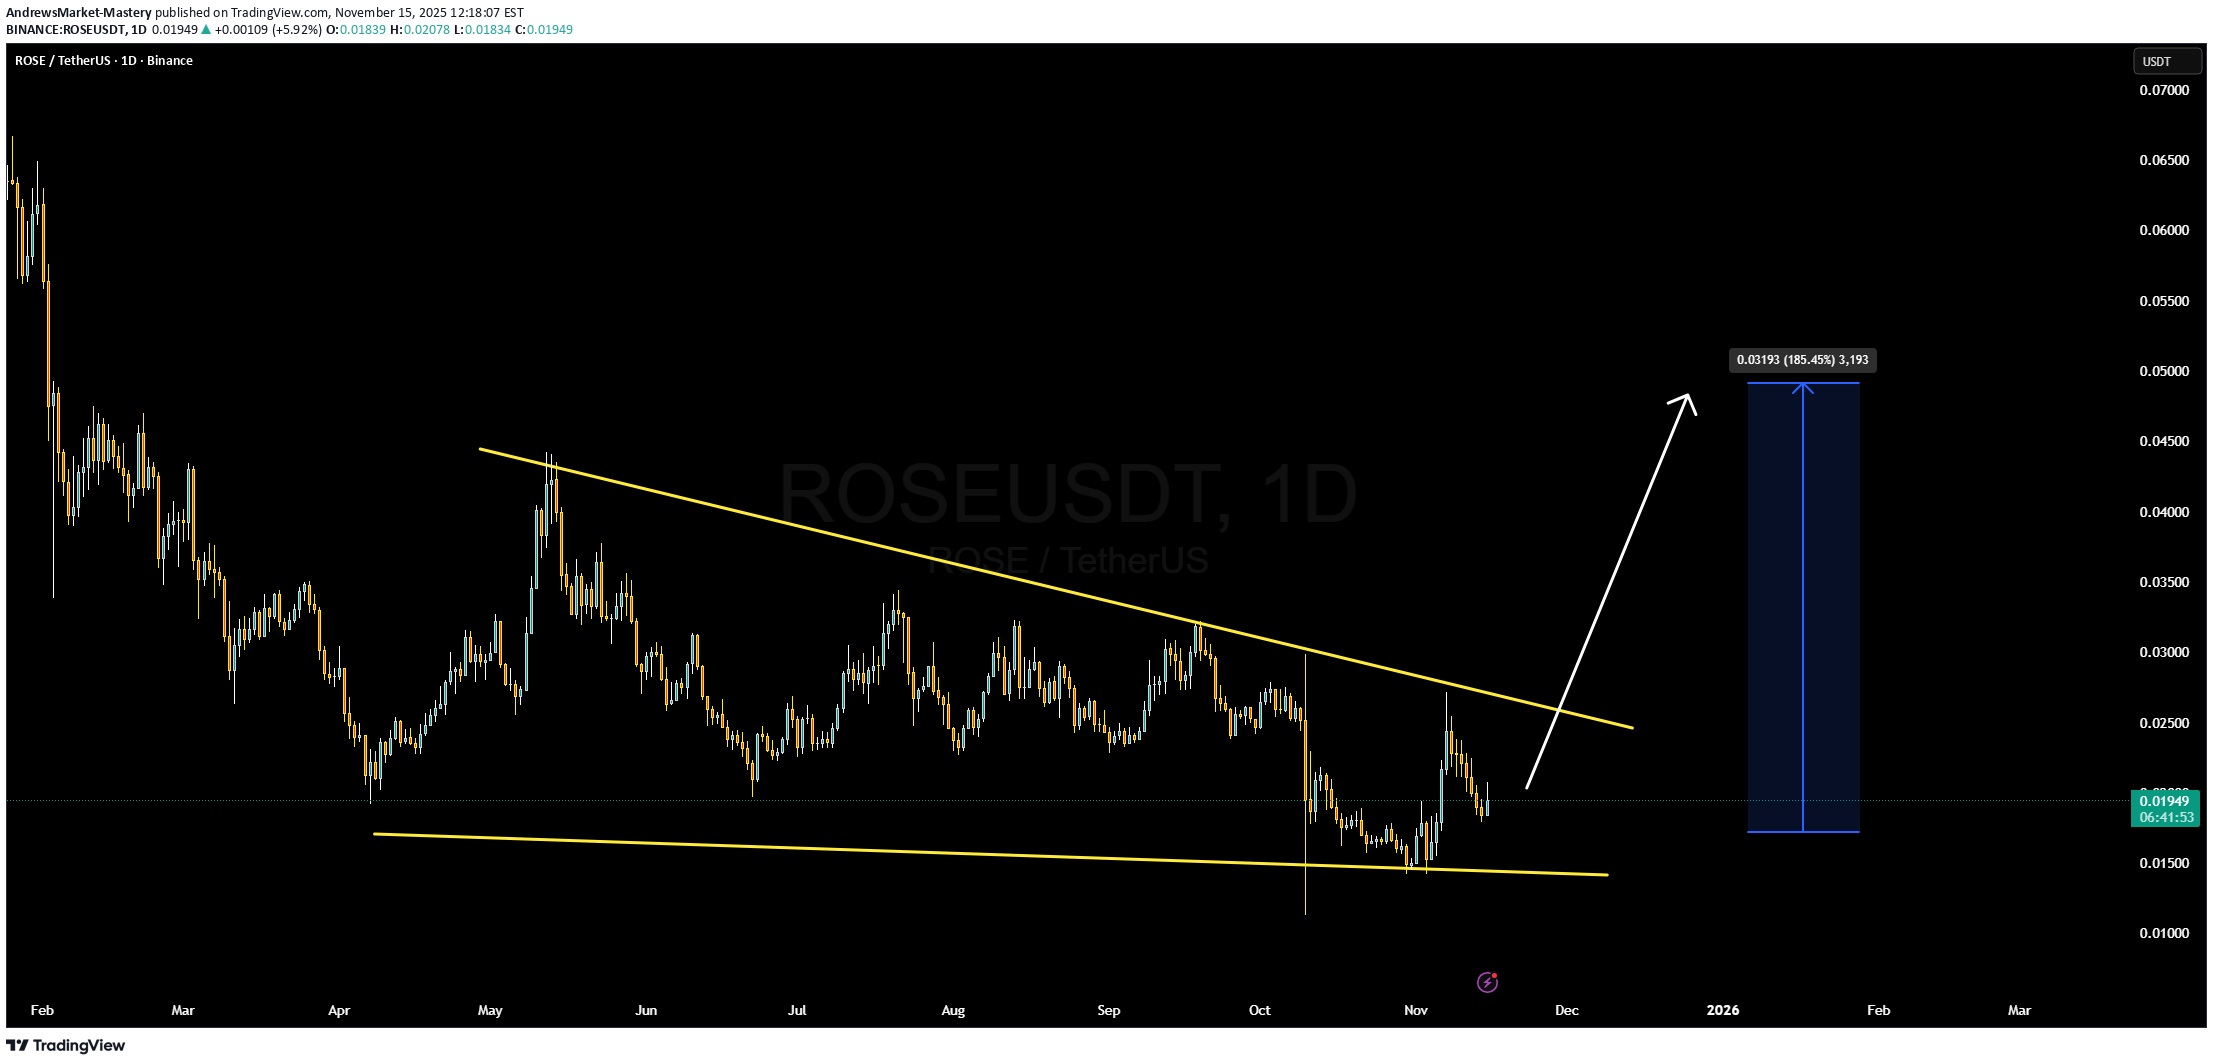
ROSE/USDT is showing a very promising setup right now, with price action squeezing into what appears to be a falling wedge — a classic bullish reversal pattern. The narrowing range suggests that sellers are losing conviction and buyers are gradually stepping in, especially as volume begins to pick up. If ROSE breaks above the upper trendline with conviction, we could see a significant shift in momentum. On the fundamentals side, ROSE is the native token of the Oasis Network, a privacy-first, scalable layer-1 blockchain built for confidential compute. ROSE powers transaction fees, staking, and delegation both at the consensus layer and in ParaTime environments. Its capped supply of 10 billion tokens and a dedicated allocation of staking rewards are designed to align long-term network participation with token scarcity. Staking ROSE is a key part of its value proposition — holders can delegate tokens to validators, help secure the network, and earn rewards in return. Some estimates suggest staking yields can range quite broadly depending on how long the token is staked. Meanwhile, its ParaTime layer supports private smart contracts via secure enclaves, making ROSE relevant for privacy-sensitive Web3 use cases.

CryptoWithJames
تحلیل تکنیکال ارز ROSE: شکست قاطع از الگوی گُوِه نزولی و هدف سود خیرهکننده ۱۰۹٪!
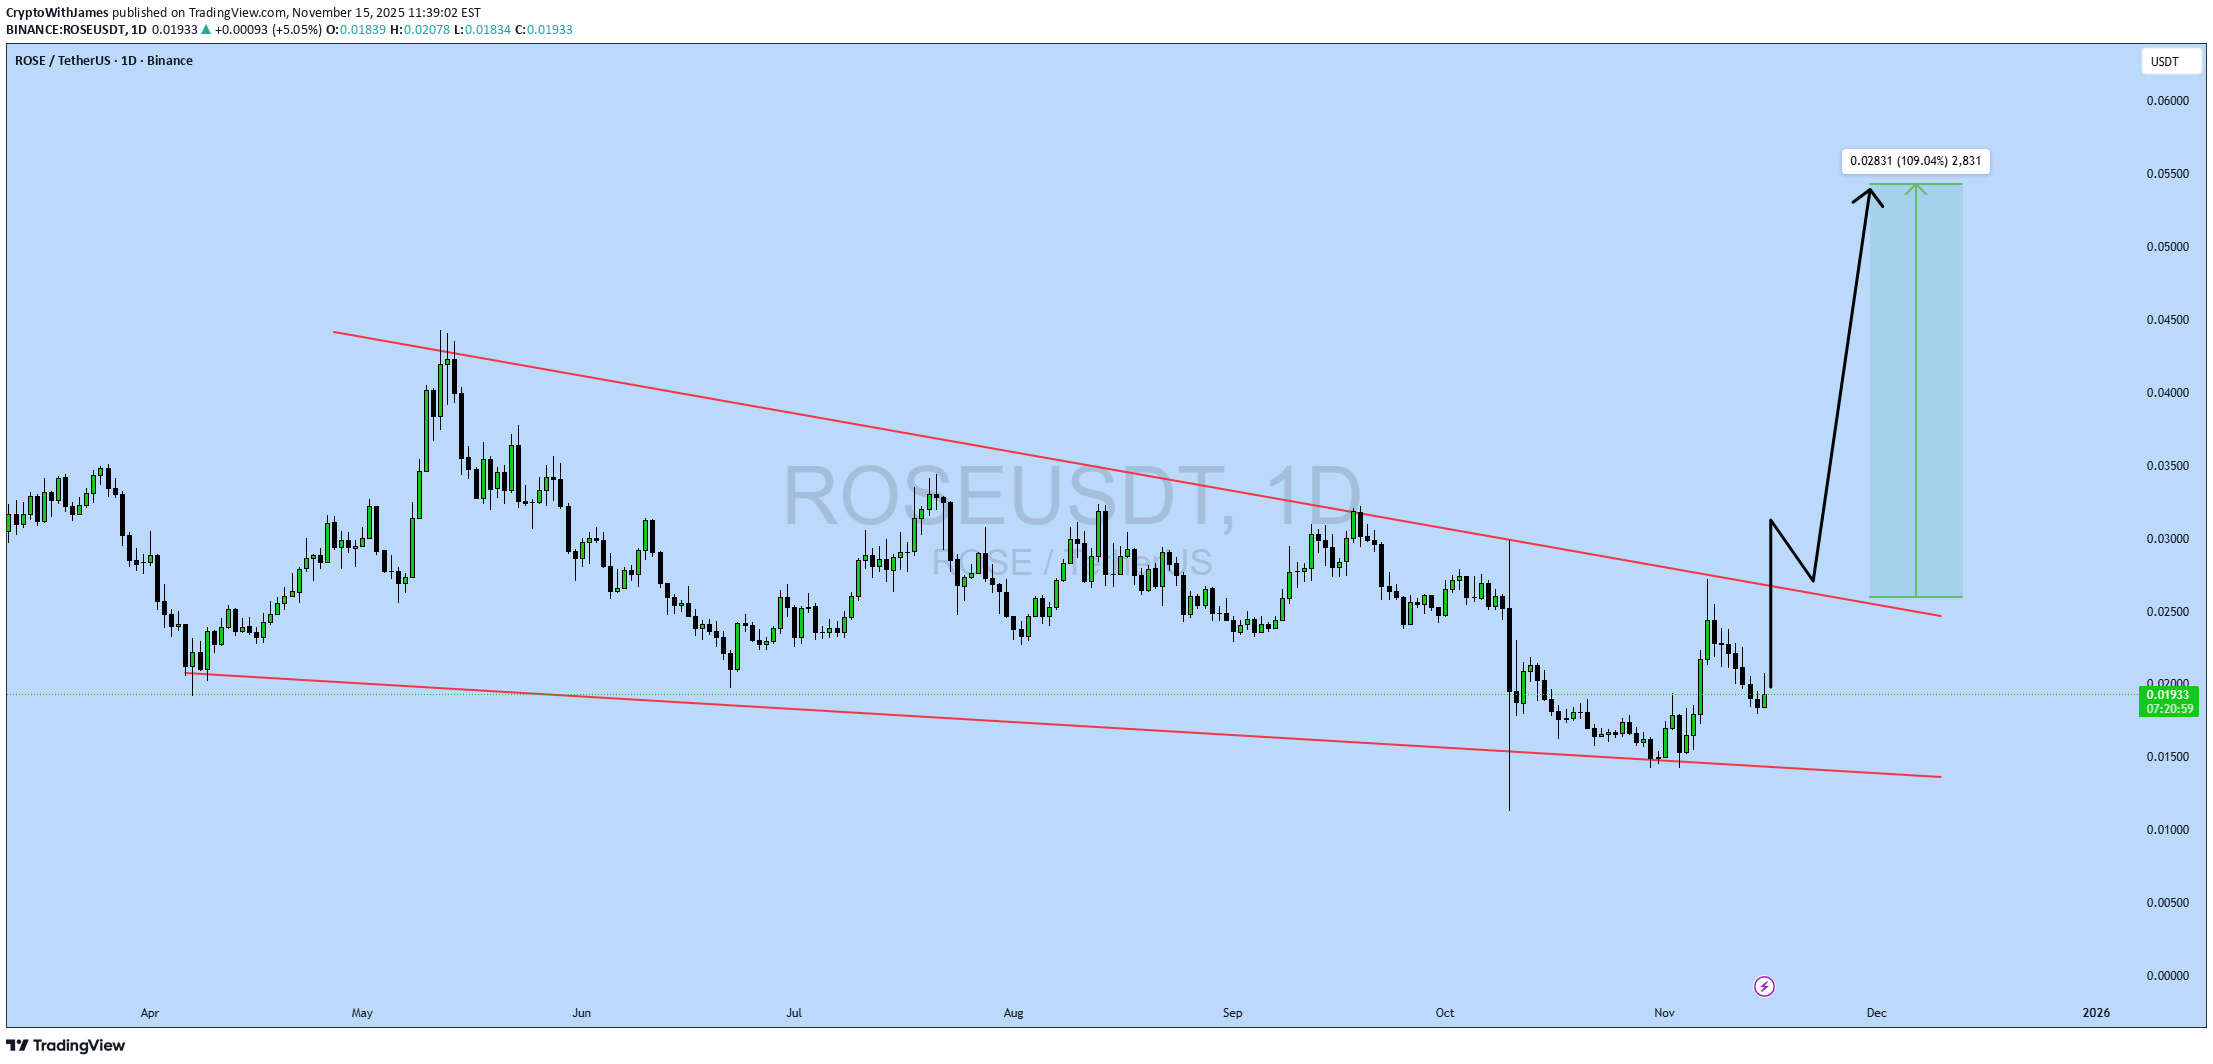
#ROSE UPDATE ROSE Technical Setup Pattern: Falling Wedge Pattern Current Price: $0.019 Target Price: $0.028 Target % Gain: 109.04% Technical Analysis: ROSE is breaking out of a falling wedge pattern on the 1D chart as price pushes above the descending resistance trendline with growing bullish momentum. The recent surge shows strong buyer interest, and if price holds above the breakout zone, a move toward the $0.028 target becomes likely. Time Frame: 1D Risk Management Tip: Always use proper risk management.

Bithereum_io
تحلیل تکنیکال ROSE/USDT: فرصت خرید در کف الگوی مثلث نزولی و اهداف هیجانانگیز!
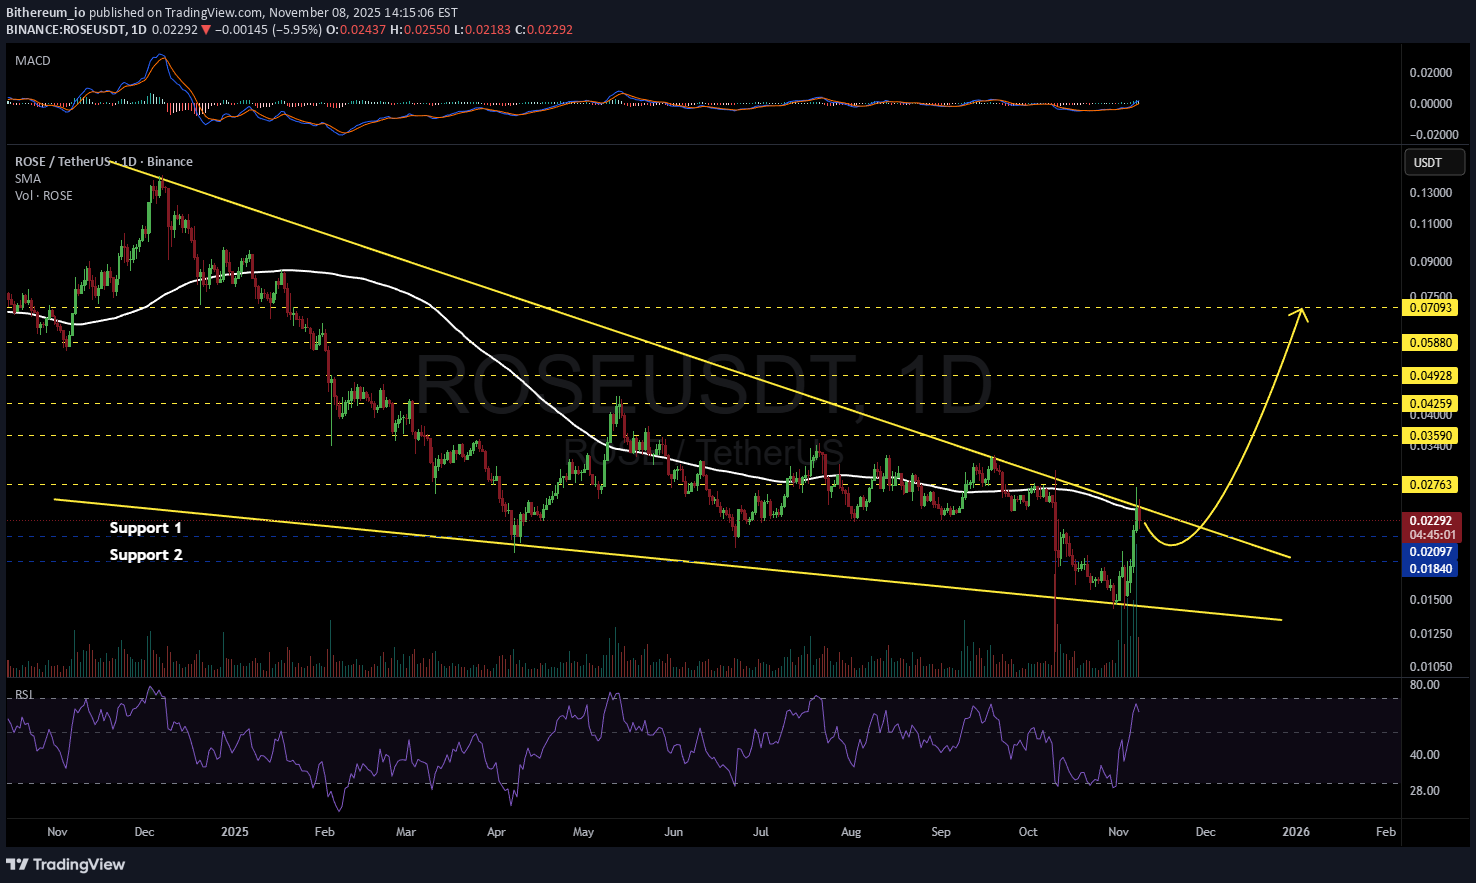
#ROSE is currently trading within a falling wedge pattern on the daily chart and was recently rejected from the wedge resistance and the daily SMA100. Consider accumulating a position around the current level and near the support zones at: 💰 $0.02097 💰 $0.01840 In case of a breakout above the pattern resistance and the daily SMA100, the potential upside targets are: 🎯 $0.02763 🎯 $0.03590 🎯 $0.04259 🎯 $0.04928 🎯 $0.05880 🎯 $0.07093 ⚠️ Always remember to use a tight stop-loss and maintain proper risk management.
Disclaimer
Any content and materials included in Sahmeto's website and official communication channels are a compilation of personal opinions and analyses and are not binding. They do not constitute any recommendation for buying, selling, entering or exiting the stock market and cryptocurrency market. Also, all news and analyses included in the website and channels are merely republished information from official and unofficial domestic and foreign sources, and it is obvious that users of the said content are responsible for following up and ensuring the authenticity and accuracy of the materials. Therefore, while disclaiming responsibility, it is declared that the responsibility for any decision-making, action, and potential profit and loss in the capital market and cryptocurrency market lies with the trader.