
AndrewsMarket-Mastery
@t_AndrewsMarket-Mastery

What symbols does the trader recommend buying?
Purchase History
پیام های تریدر
Filter
AndrewsMarket-Mastery
XAUUSD Forming Falling Wedge

XAUUSD is currently developing a classic falling wedge structure after a strong impulsive bullish move, which typically signals continuation rather than reversal in a broader uptrend. Price action is compressing with lower highs and higher lows, showing that selling pressure is weakening while buyers are quietly absorbing supply. The recent breakout and hold above the previous demand zone confirms bullish intent, and this consolidation looks more like healthy price digestion before the next expansion phase. From a market structure perspective, gold remains firmly bullish on the higher timeframes. The strong rally from the prior accumulation zone shows aggressive institutional buying, and the falling wedge forming above key support highlights strong trend control by buyers. As long as price holds above the highlighted demand area, pullbacks are likely to be corrective rather than trend-changing, offering continuation opportunities toward higher liquidity levels. Fundamentally, gold continues to be supported by ongoing USD weakness, expectations of softer monetary policy, and persistent global uncertainty. Slowing inflation momentum, increased expectations of future rate cuts, and rising demand for safe-haven assets keep XAUUSD structurally strong. Investor interest remains elevated as gold acts as both an inflation hedge and a risk-off asset, aligning perfectly with the current technical setup. Overall, the falling wedge signals a high-probability bullish continuation. A clean breakout and sustained acceptance above the wedge resistance opens the path toward new highs, with momentum favoring buyers. As long as price respects the demand zone and maintains higher lows, XAUUSD remains positioned for further upside, offering a strong risk-to-reward profile for trend-aligned trades.
AndrewsMarket-Mastery
سیگنال صعودی SAGA: آیا کفسازی برای جهش بزرگ آغاز شده است؟
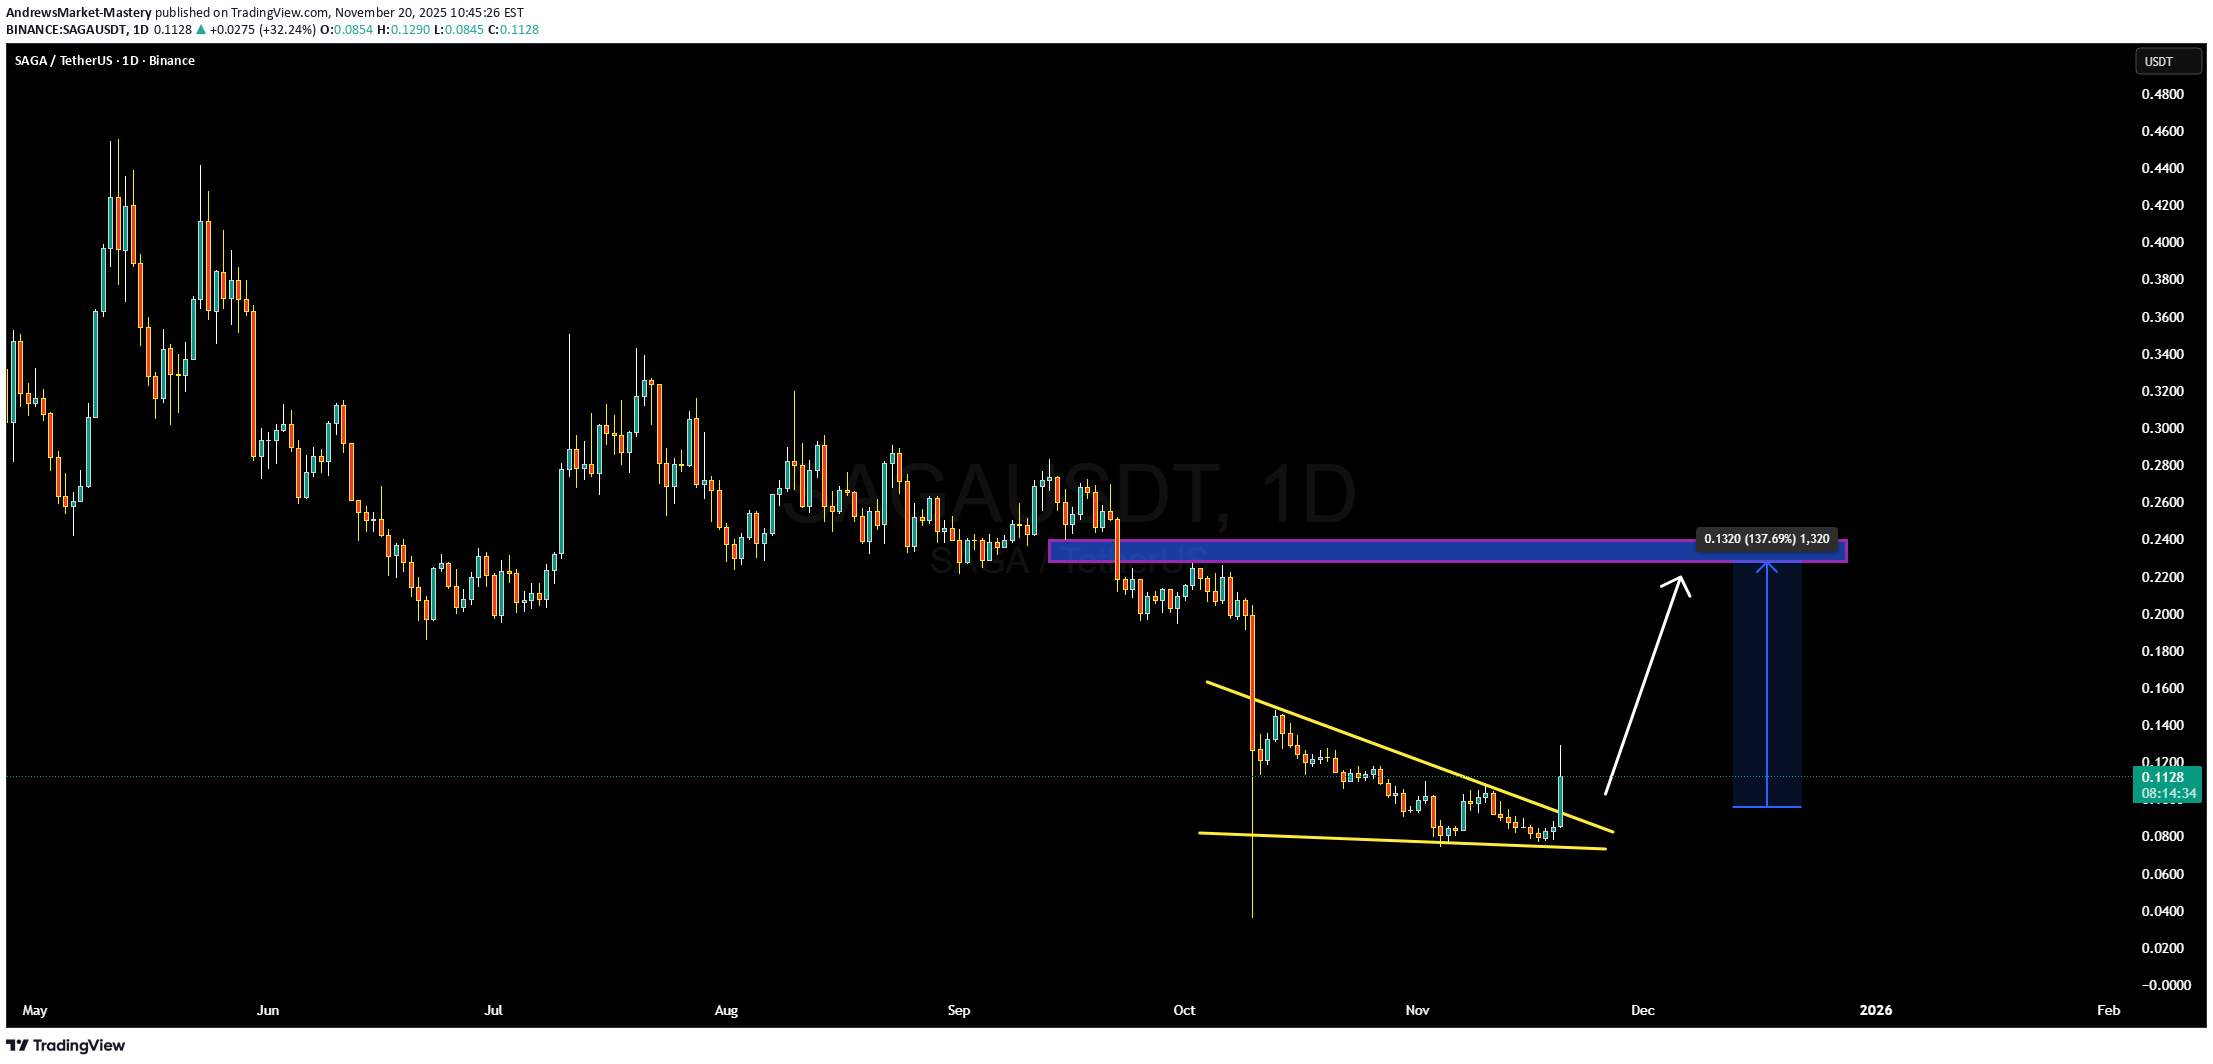
SAGA/USDT is developing a classic falling-wedge formation, signaling that downside pressure may be easing and a bullish reversal could be near. The compression in price — with lower highs slowly tightening — suggests that sellers are running out of steam, while buyers may be building a base. Volume behavior is healthy, and a breakout above the wedge’s upper trendline could confirm a reversal and lead to a strong upward leg. On the fundamentals side, SAGA is a Layer-1 blockchain built for on-chain gaming and social applications, with a focus on NFT marketplaces, web3 identity, and low-latency scalability. This aligns well with themes like “play-to-earn”, web3 gaming infrastructure, and multichain social metaverse, which are increasingly popular among developers and investors. Its token, SAGA, is used for staking, governance, and transaction fees in the network, giving it multifaceted utility. Tokenomics also favor a potential breakout: SAGA has a capped or controlled supply with a portion allocated to ecosystem incentives, validator rewards, and community programs. A meaningful share of tokens are locked or vested, reducing active circulation and potentially creating supply-side tailwinds as ecosystem adoption grows. As more developers build on SAGA, staking demand could increase, putting upward pressure on the token. From a trading perspective, the ideal setup would be to wait for a clean breakout above the upper trendline of the wedge, confirmed by a strong volume candle. A retest of that breakout point could offer a favorable entry, while a stop should be placed just below the recent swing low or the lower wedge boundary. If the breakout holds, the risk-reward is very attractive given SAGA’s strong use case and structural setup.
AndrewsMarket-Mastery
سیگنال صعودی DYM: آیا کفسازی گُوِه نزولی منجر به انفجار قیمت میشود؟
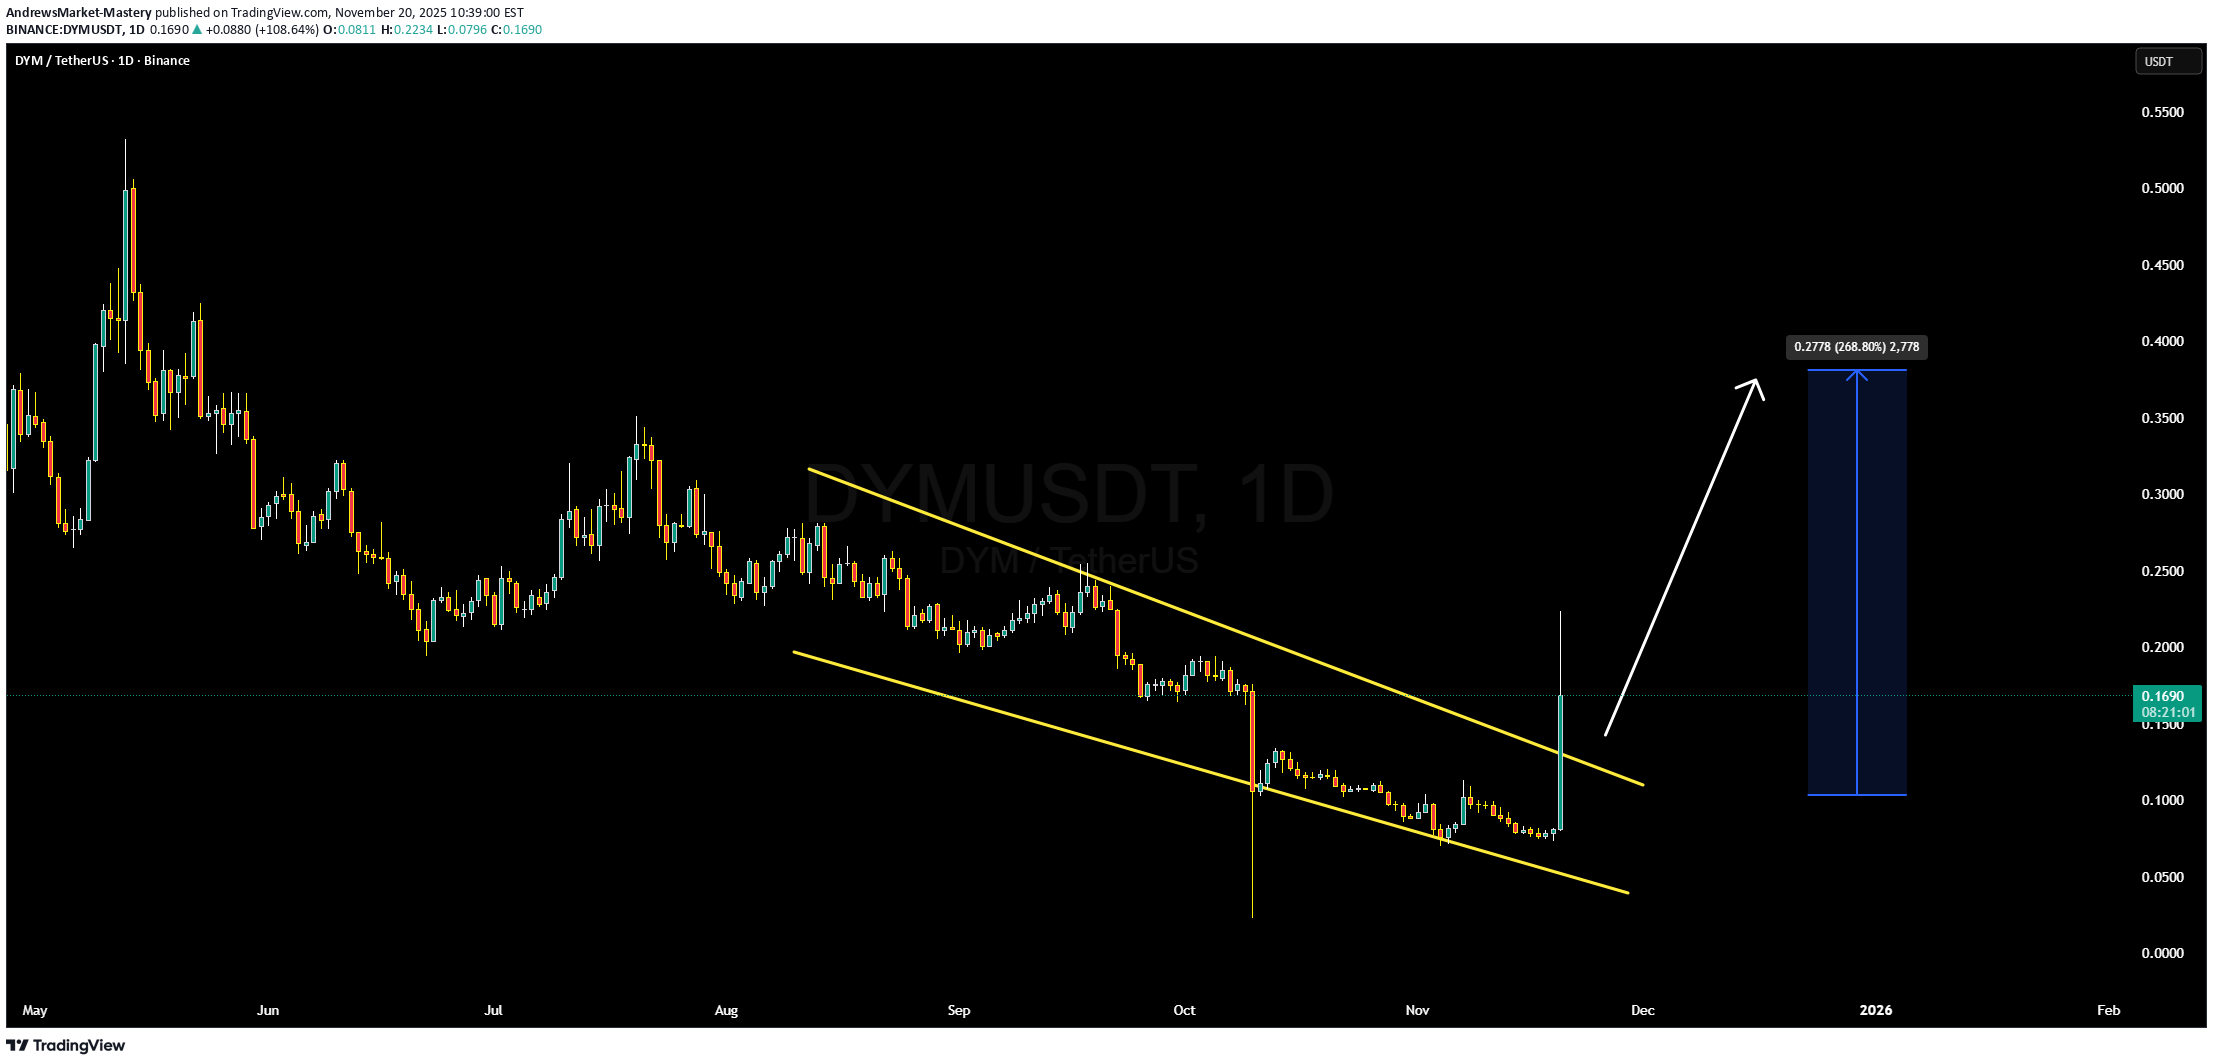
DYM/USDT is forming a well-defined falling wedge pattern, which typically signals a potential bullish reversal. The wedge shows declining momentum on lower highs, while support is holding firm. Volume behavior suggests accumulation — buyers are slowly stepping in as sellers’ strength fades. If DYM breaks above the wedge’s upper boundary with conviction, it could trigger a strong breakout. On the fundamentals, Dymension is a modular Layer-1 blockchain built to host essentially app-specific blockchains that run on top of the Dymension Hub. Its architecture supports execution, consensus, and data availability in a scalable way using a Delegated Proof-of-Stake (DPoS) network. The native token, DYM, plays several critical roles: it’s used for staking (securing the network), governance (voting on protocol upgrades), and paying fees on the Hub. Tokenomics are particularly interesting: total supply is capped at 1 billion DYM. Emission is algorithmically adjusted based on how much of DYM is staked — when staking is lower, issuance goes up; when staking is higher, issuance decreases. There’s also a burn mechanism: a portion of protocol fees is converted back into DYM and burned, helping to counter inflation. Strategically, a breakout above the wedge, confirmed by volume, is the trigger I would be watching for to go long. An ideal entry might come on a retest of the breakout level if it acts as support. Risk can be managed by placing a stop just below the lower trendline of the wedge. Given how DYM ties into modular blockchain growth, cross-chain infrastructure, and staking demand, the potential upside could be quite attractive — especially if adoption of its RollApps picks up.
AndrewsMarket-Mastery
مومنتوم صعودی مینا (MINA) با آپدیتهای کلیدی و پشتوانه بنیادین قوی: آیا آماده انفجار است؟
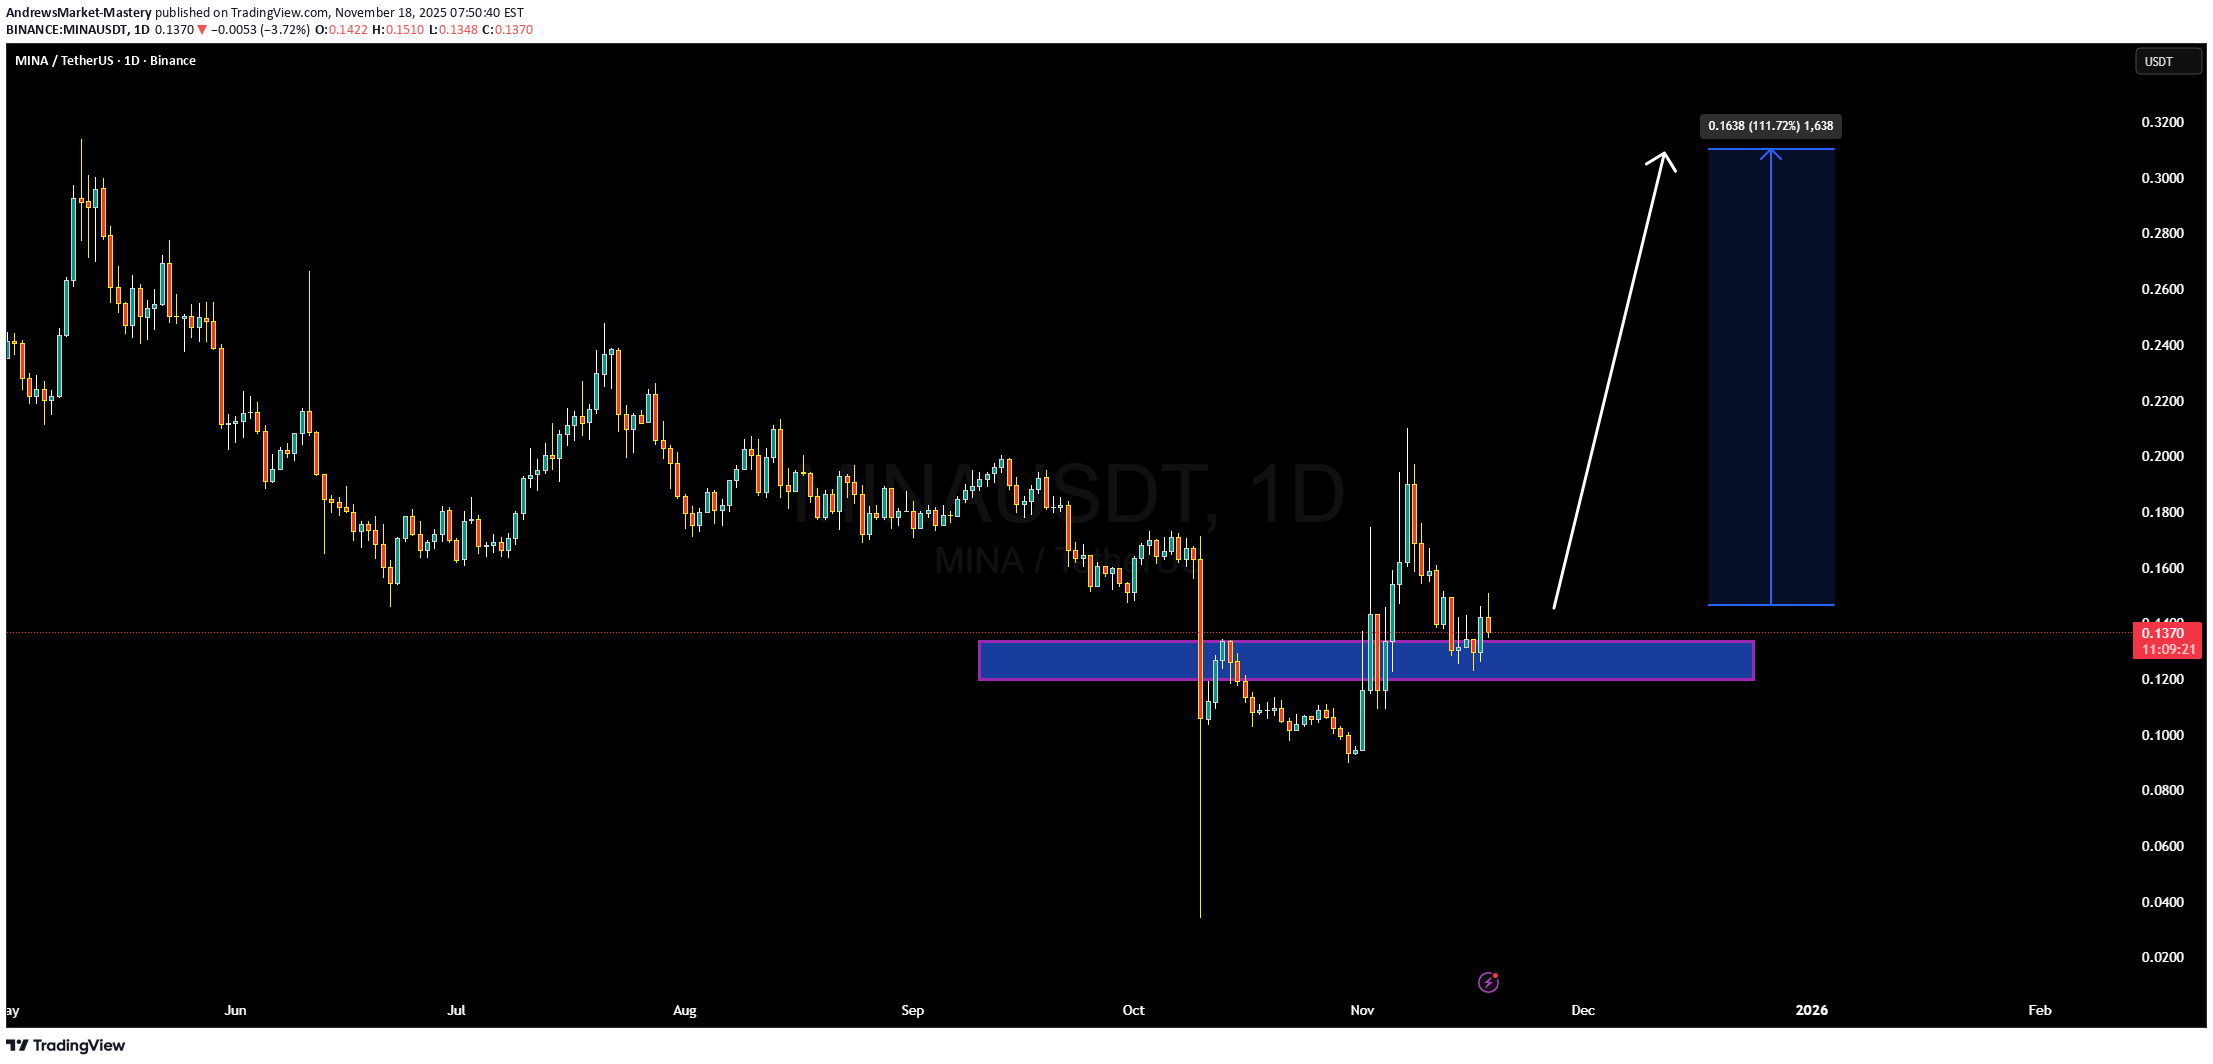
MINA/USDT is showing clear signs of bullish momentum, and the fundamentals strongly support a longer-term uptrend. The protocol is unique: it’s one of the lightest blockchains in the industry thanks to its use of recursive zk-SNARKs, meaning every node only needs to store a very small proof to verify the entire network. This architecture gives Mina a real scalability and decentralization edge — full participation without huge hardware demands. Recently, Mina completed a major upgrade that unlocked full zk-app programmability. This means developers can now build and deploy zero-knowledge smart contracts (zkApps) on Mina’s mainnet, using off-chain execution while only submitting proofs on-chain. That’s a powerful paradigm shift: smart contracts become more scalable, private, and efficient. The roadmap for 2025 is also very aggressive, with o1Labs pushing hard on developer tooling like o1js, and the protocol targeting interoperability, new proof types, and a significantly deeper zk ecosystem. On the institutional side, Mina is gaining traction: it recently secured support for institutional custody and staking via Cupper, which could unlock greater capital inflow. ( [PR Newswire] [4]) Meanwhile, on-chain activity appears to be ramping up, and more developers are building zkApps across voting, digital identity, gaming, and other verticals. ( [Mina Protocol] [5])
AndrewsMarket-Mastery
صعود قریبالوقوع فایل کوین (FIL)؛ 5 سیگنال قدرتمند که نباید نادیده بگیرید!

FIL/USDT is showing strong signs of bullish momentum, and the fundamentals are lining up in a way that supports a potential sustained move. On-chain metrics suggest increasing protocol activity: Filecoin’s network utility is rising, Q3 2025 saw utilization tick up, and active storage demand from enterprise and verified data clients remains robust. From a fundamental perspective, FIL is deeply tied to real-world data storage demand. The token is used to incentivize storage providers and acts as collateral in the network. Token issuance is gradual and tied to network milestones, supporting long-term alignment. Furthermore, recent protocol upgrades like Proof of Data Possession are improving trust and efficiency, which could drive more enterprise-level adoption. Economically, there are meaningful supply-side tailwinds. The block reward schedule is designed to decline over time, and a portion of circulating FIL may become deflationary due to network sinks and locking mechanisms.) At the same time, more FIL is being locked by storage providers as collateral, which reduces active supply and supports token value.
AndrewsMarket-Mastery
موج صعودی قدرتمند SCRT آغاز شد؟ رازهای پشت رشد قیمت Secret
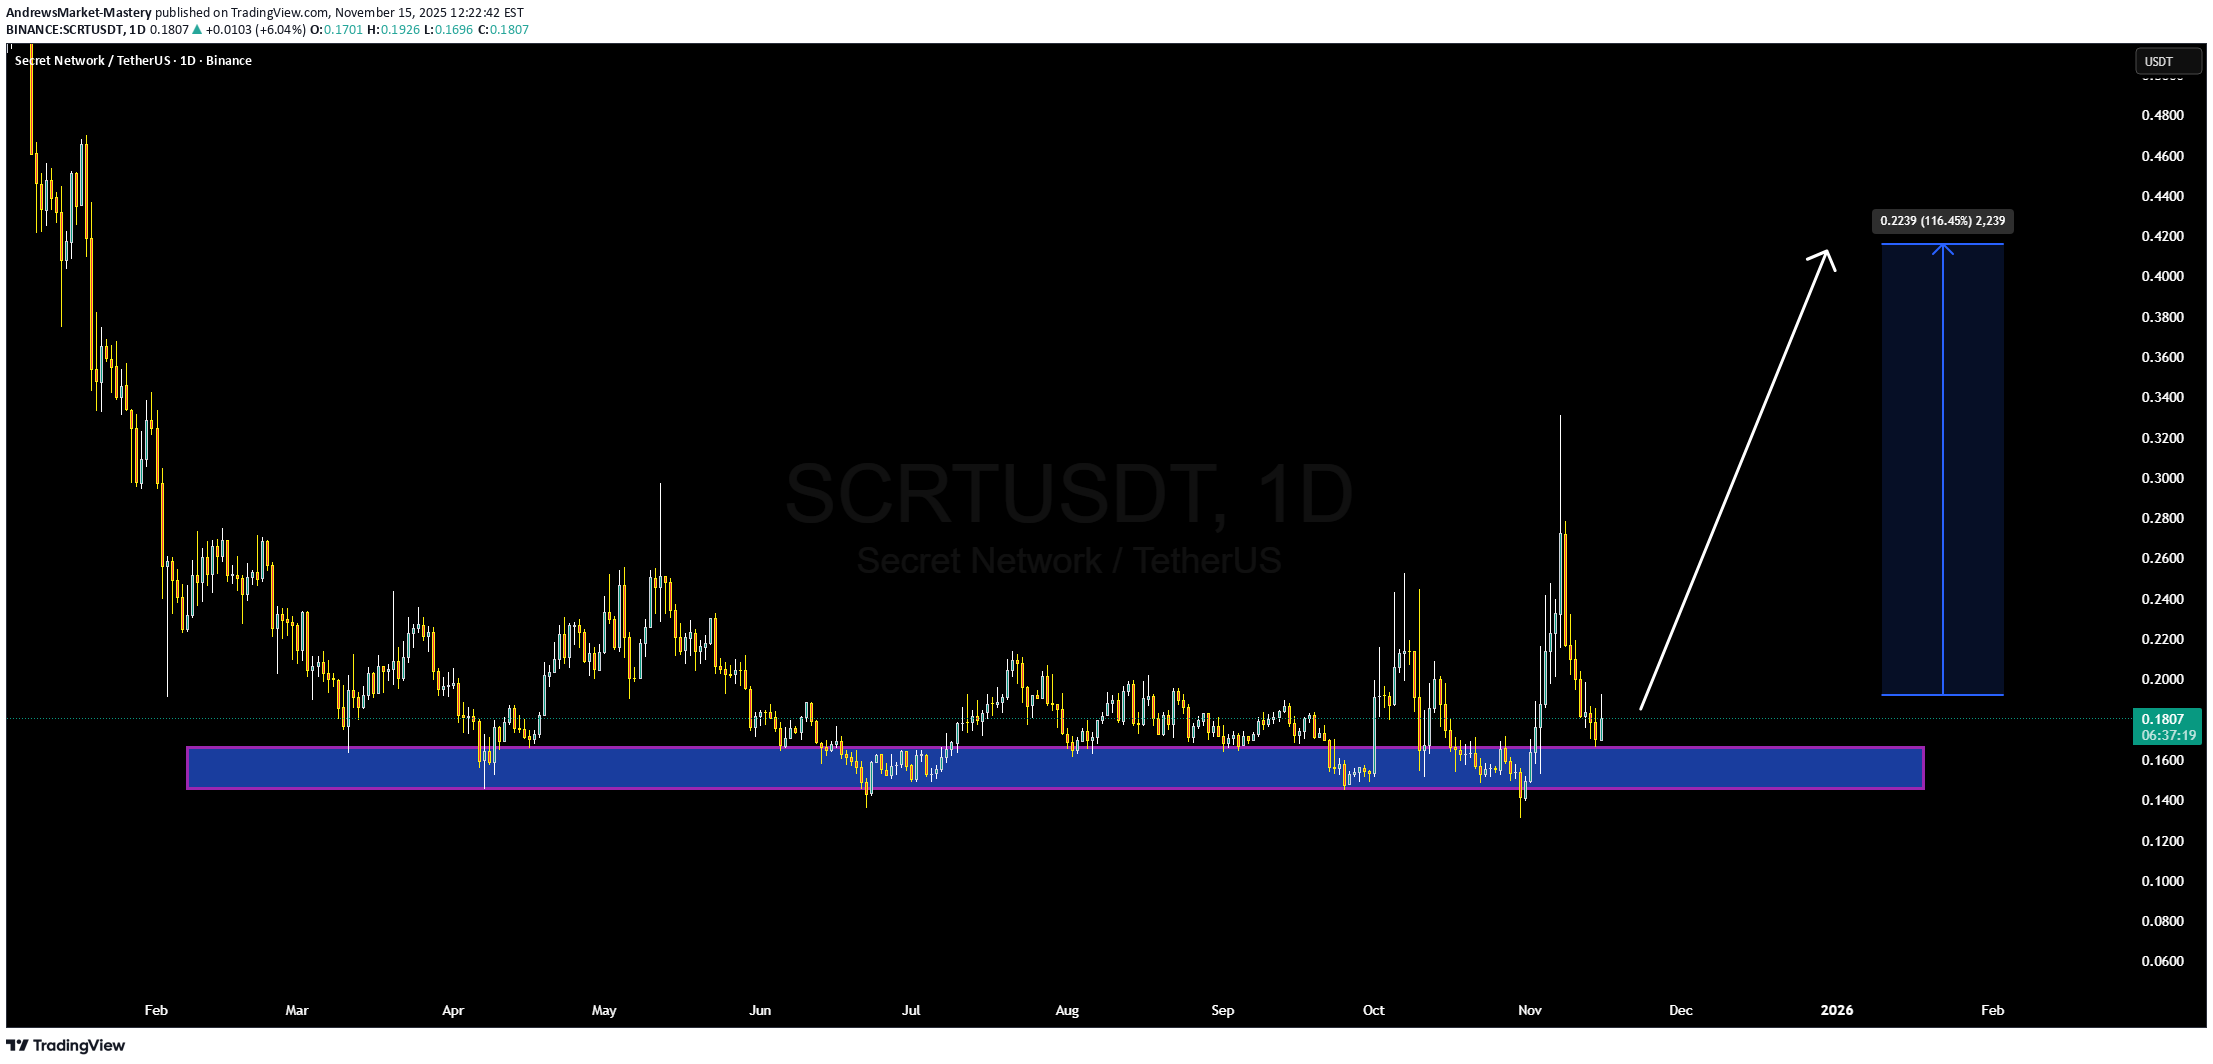
SCRT USDT is beginning to display significant bullish momentum, indicating that Secret (SCRT) could be gearing up for a meaningful move. On‑chain metrics suggest that price has held recent support zones and volume has begun to improve—this combination often signals that accumulation may be underway and a breakout could be in the offing. From a fundamental standpoint SCRT is the native token of Secret Network, a privacy‑first layer‑1 blockchain focused on confidential computation via encrypted smart contracts. This aligns with several high‑search keywords right now such as privacy blockchain, confidential computing, Web3 infrastructure, and data sovereignty. With rising demand for private smart contract platforms and solid ecosystem engagement, SCRT is in the right narrative zone. Technically the price structure supports the thesis: after a period of consolidation, SCRT has begun breaking past prior short‑term resistance levels while volume is trending modestly higher. For traders the key will be to watch for a confirmed breakout and sustained follow‑through, ideally accompanied by retest of breakout zone acting as support. Risk management would dictate placing a stop below recent swing low to keep the risk defined.
AndrewsMarket-Mastery
تحلیل تکنیکال ROSE/USDT: آیا الگوی گُوِه نزولی نویدبخش انفجار صعودی است؟
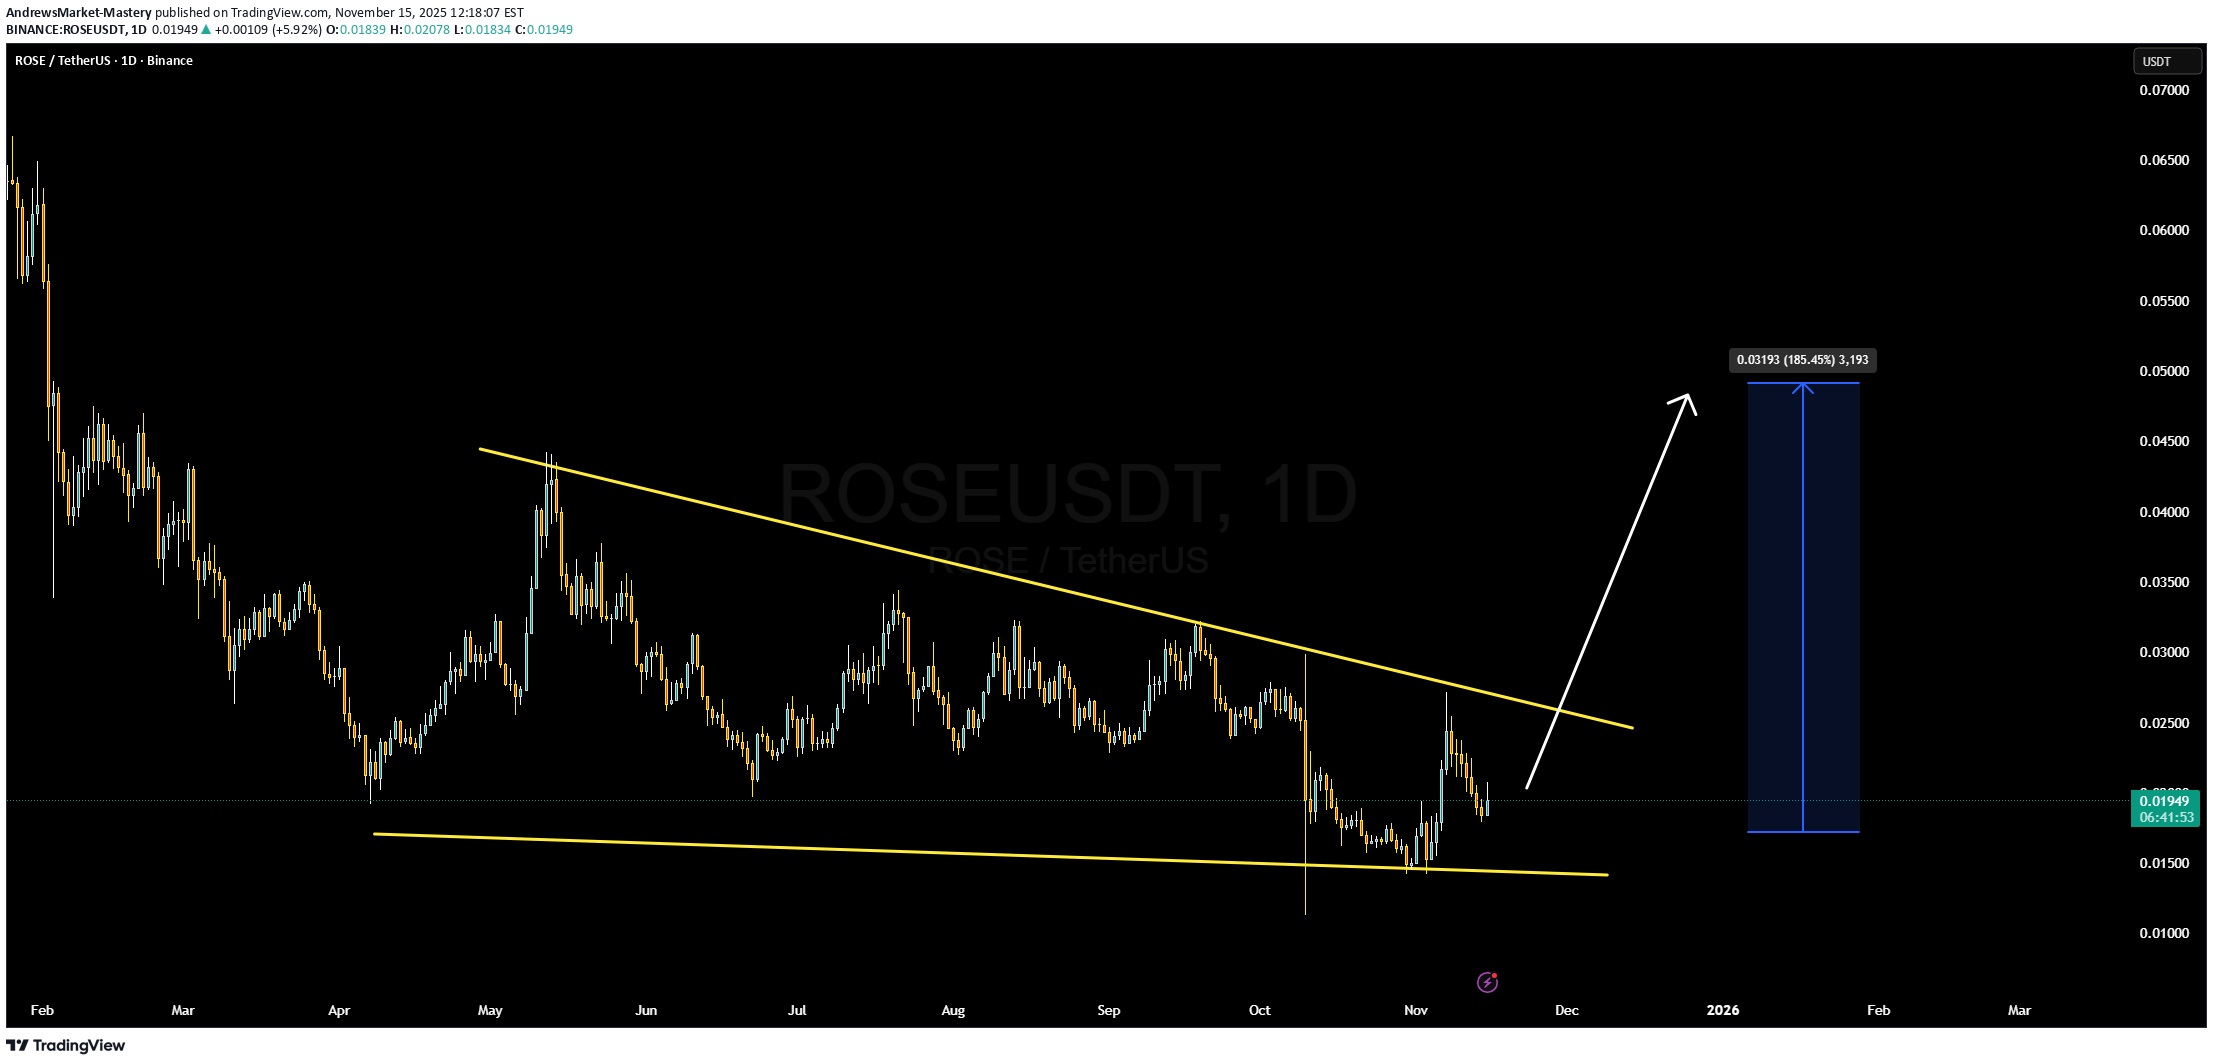
ROSE/USDT is showing a very promising setup right now, with price action squeezing into what appears to be a falling wedge — a classic bullish reversal pattern. The narrowing range suggests that sellers are losing conviction and buyers are gradually stepping in, especially as volume begins to pick up. If ROSE breaks above the upper trendline with conviction, we could see a significant shift in momentum. On the fundamentals side, ROSE is the native token of the Oasis Network, a privacy-first, scalable layer-1 blockchain built for confidential compute. ROSE powers transaction fees, staking, and delegation both at the consensus layer and in ParaTime environments. Its capped supply of 10 billion tokens and a dedicated allocation of staking rewards are designed to align long-term network participation with token scarcity. Staking ROSE is a key part of its value proposition — holders can delegate tokens to validators, help secure the network, and earn rewards in return. Some estimates suggest staking yields can range quite broadly depending on how long the token is staked. Meanwhile, its ParaTime layer supports private smart contracts via secure enclaves, making ROSE relevant for privacy-sensitive Web3 use cases.
AndrewsMarket-Mastery
احتمال انفجار قیمت مانتا (MANTA/USDT): راز الگوی گوه نزولی و زمان خرید طلایی!
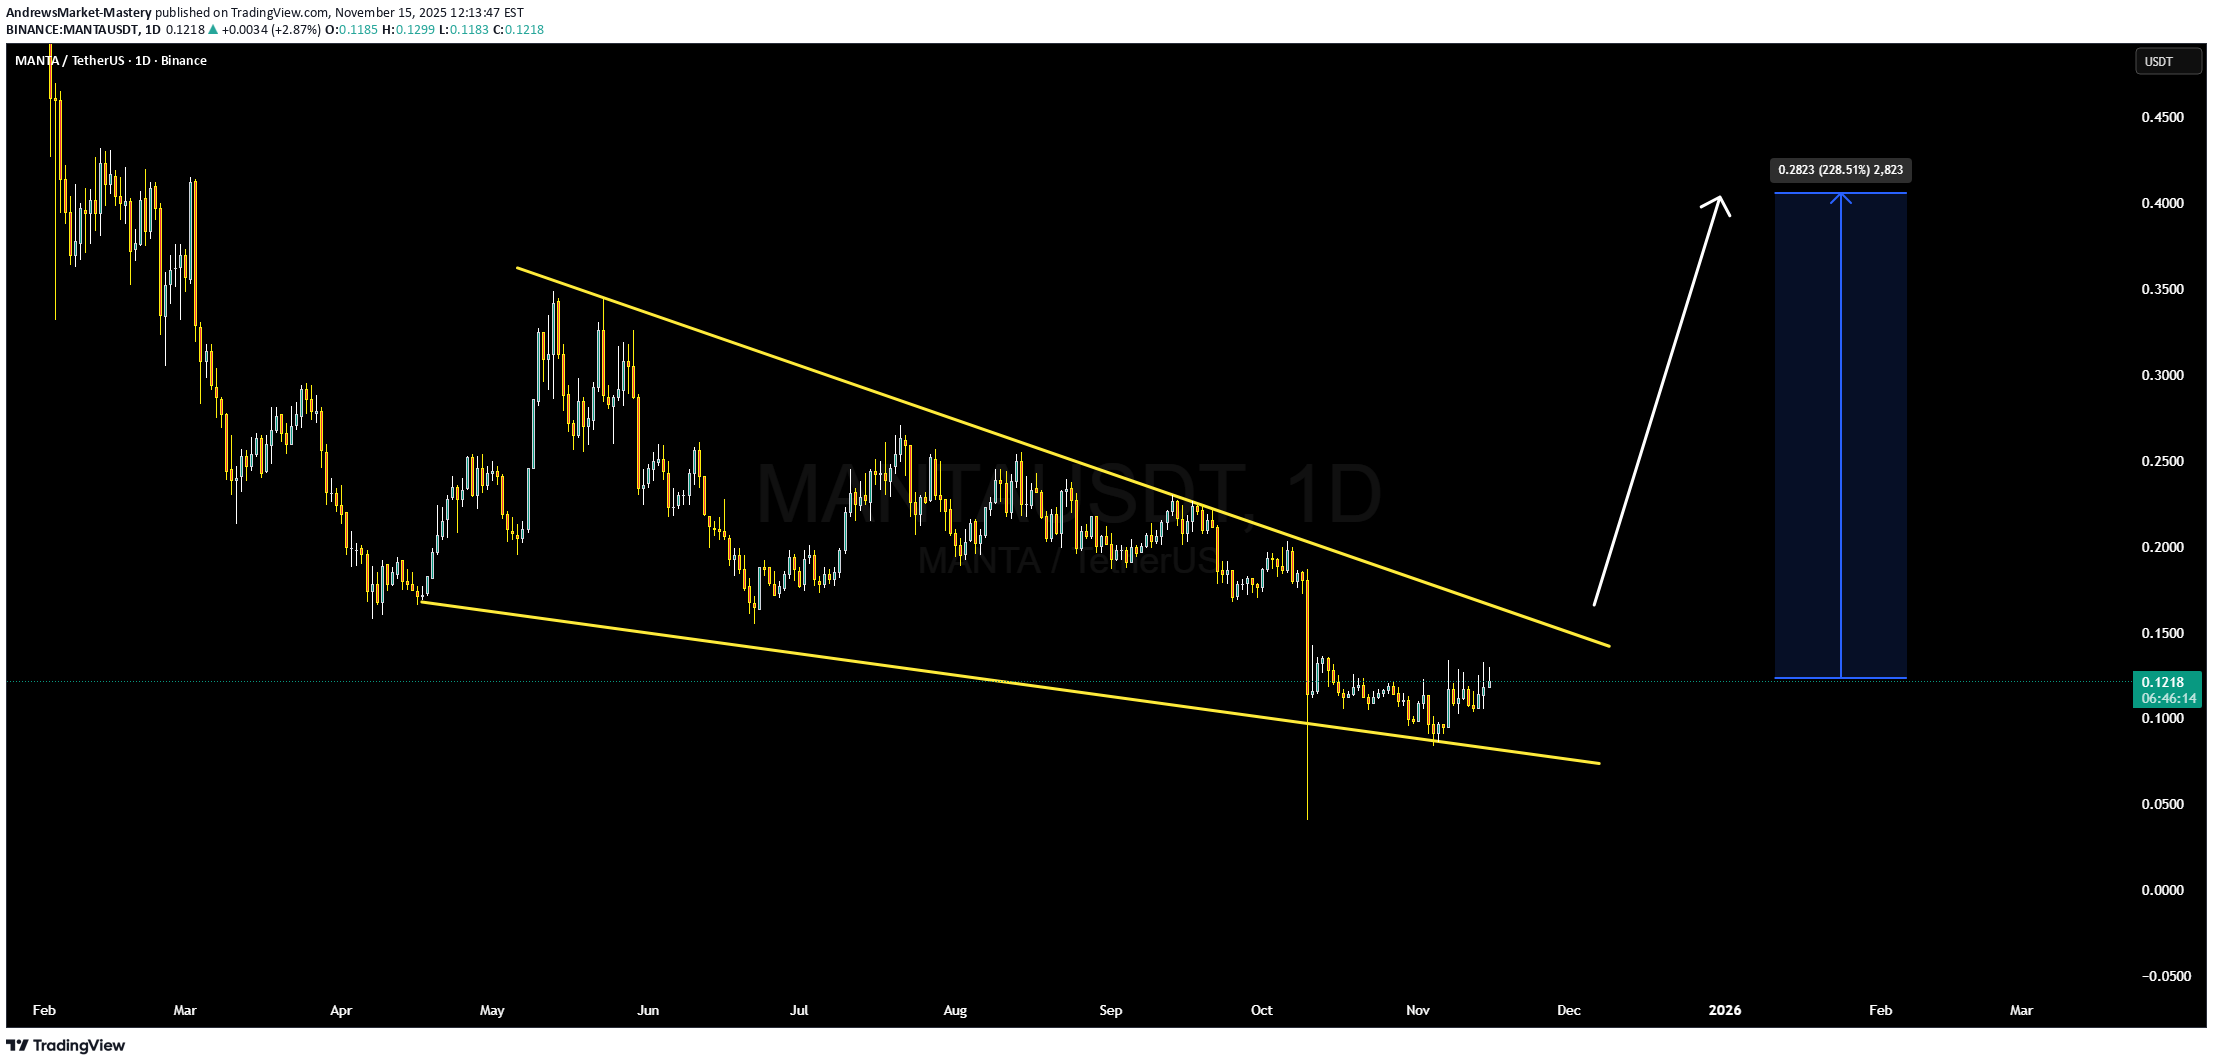
MANTA/USDT is setting up a very interesting technical picture — price is contracting into what looks like a falling-wedge formation, which often signals a potential bullish reversal. The tightening range, combined with volume that’s beginning to pick back up, suggests that accumulation could be building and a breakout to the upside may be imminent. If the wedge’s upper trendline gives way with strength, we could see MANTA run significantly higher. On the fundamentals side, Manta Network is a multi-modular blockchain ecosystem focused on zero-knowledge (ZK) applications. It has two main chains: Manta Pacific (a Layer 2 chain optimized for EVM-native ZK apps) and Manta Atlantic (a privacy-centric Layer 1). This dual-chain architecture allows for both composability and data privacy, making Manta especially relevant in today’s Web3 infrastructure space. Tokenomics also support the trade thesis: MANTA has a total supply of 1 billion tokens, with roughly ~449 million circulating currently, and MANTA is used for staking, governance, and network fees.On top of that, a recent partnership with Symbiotic brings “fast finality” to Manta Pacific via restaking mechanics, which could further incentivize users and operators to lock in their MANTA.
AndrewsMarket-Mastery
مومنتوم انفجاری دکر (DCR)؛ آیا آماده جهش بزرگ است؟

DCR/USDT is starting to show very encouraging bullish momentum, suggesting that Decred (DCR) could be gearing up for a meaningful move. On-chain, price has held up after recent consolidation, and trading volume is climbing — signs that accumulation may be occurring and that bullish participants are stepping back in. This shift could set the stage for a breakout if DCR can push past its near-term resistance levels with strength. From a fundamental standpoint, Decred is a deeply ambitious project. It’s built on a hybrid consensus model that combines proof-of-work with proof-of-stake, giving both miners and stakers a meaningful role in governance. This governance by stake model is central to its value, as holders can vote on protocol changes and budget allocations, making the network highly decentralized and community-driven. The supply dynamics also work in its favor: Decred has a capped maximum supply of 21 million DCR, with roughly 17 million currently in circulation, which supports scarcity. Strategically, the key will be to watch for a clean breakout above consolidation. If DCR breaks higher on strong volume and holds that level, it would confirm genuine bullish conviction. A pullback to retest this breakout could offer an ideal risk-reward entry. On the downside, placing a stop just below the recent support zone would provide a defined invalidation point. Given the fundamentals and structural setup, the upside potential is compelling if the momentum continues to build.
Disclaimer
Any content and materials included in Sahmeto's website and official communication channels are a compilation of personal opinions and analyses and are not binding. They do not constitute any recommendation for buying, selling, entering or exiting the stock market and cryptocurrency market. Also, all news and analyses included in the website and channels are merely republished information from official and unofficial domestic and foreign sources, and it is obvious that users of the said content are responsible for following up and ensuring the authenticity and accuracy of the materials. Therefore, while disclaiming responsibility, it is declared that the responsibility for any decision-making, action, and potential profit and loss in the capital market and cryptocurrency market lies with the trader.