
REQ
Request
| تریدر | نوع سیگنال | حد سود/ضرر | زمان انتشار | مشاهده پیام |
|---|---|---|---|---|
No results found. | ||||
Price Chart of Request
سود 3 Months :
سیگنالهای Request
Filter
Sort messages by
Trader Type
Time Frame

BandForBands
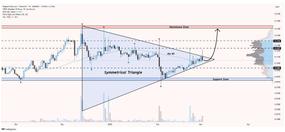
پیشبینی شگفتانگیز: سود 112 درصدی REQ در 250 روز آینده!
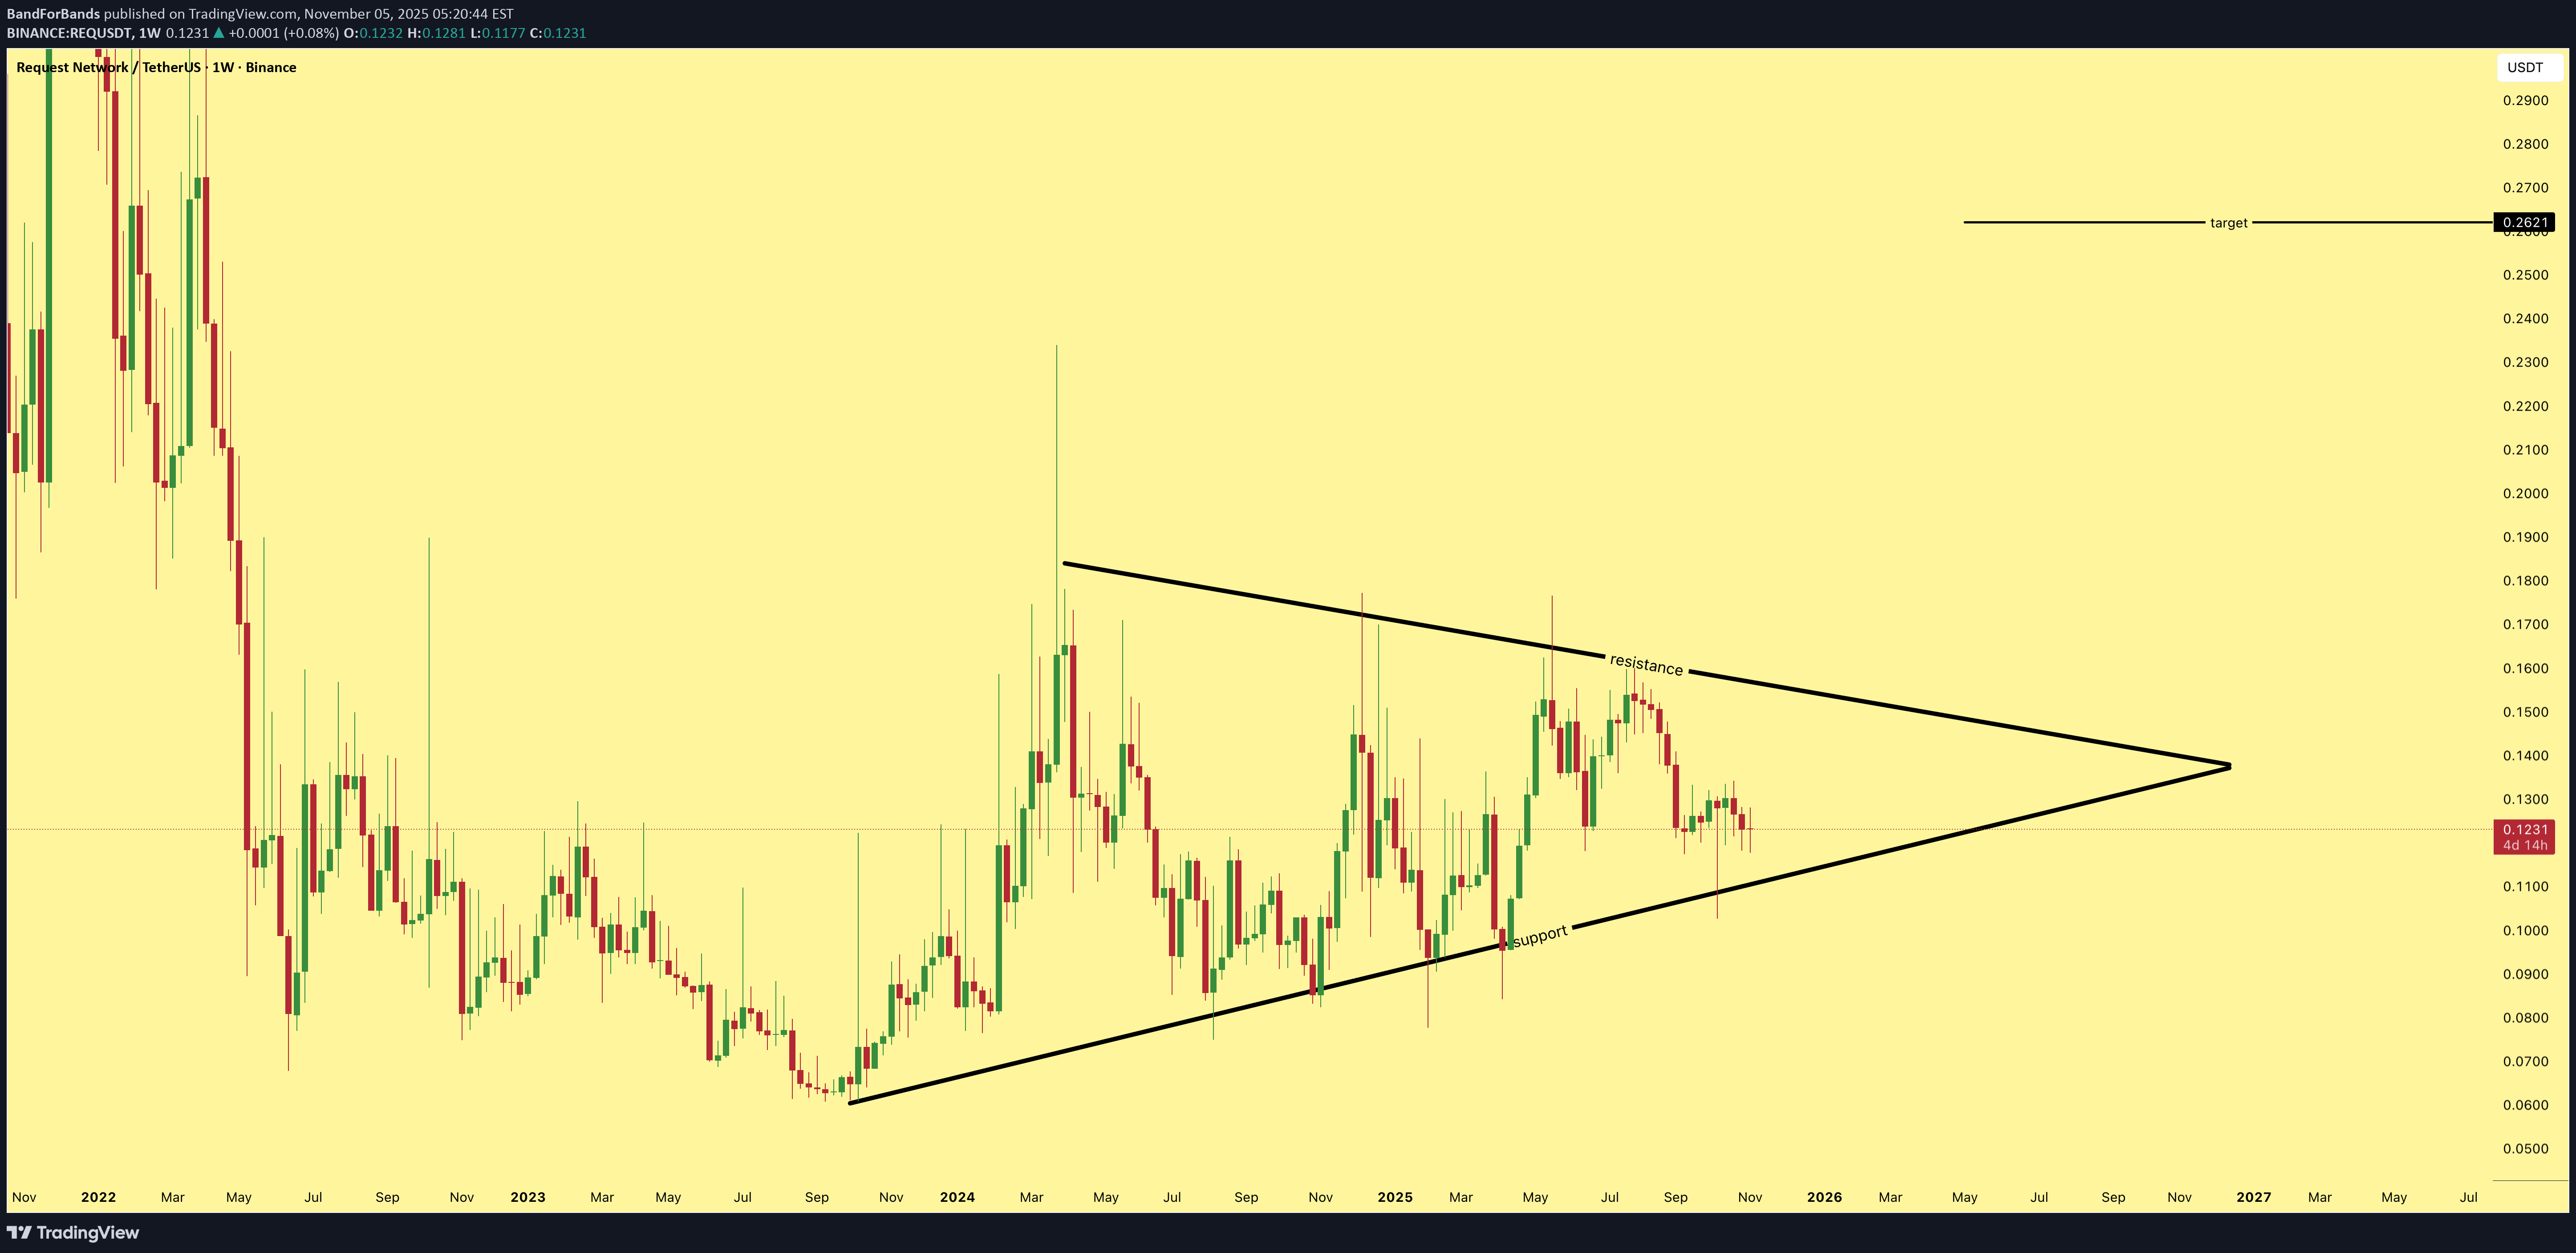
I’m expecting around 112% in gains for $REQ as long as support continues to hold. Price is compressing nicely, and within the next 250 days, a breakout to the target looks likely. Maintaining this support zone is key for the setup to fully play out.

WaveRiders2
REQ Market Update
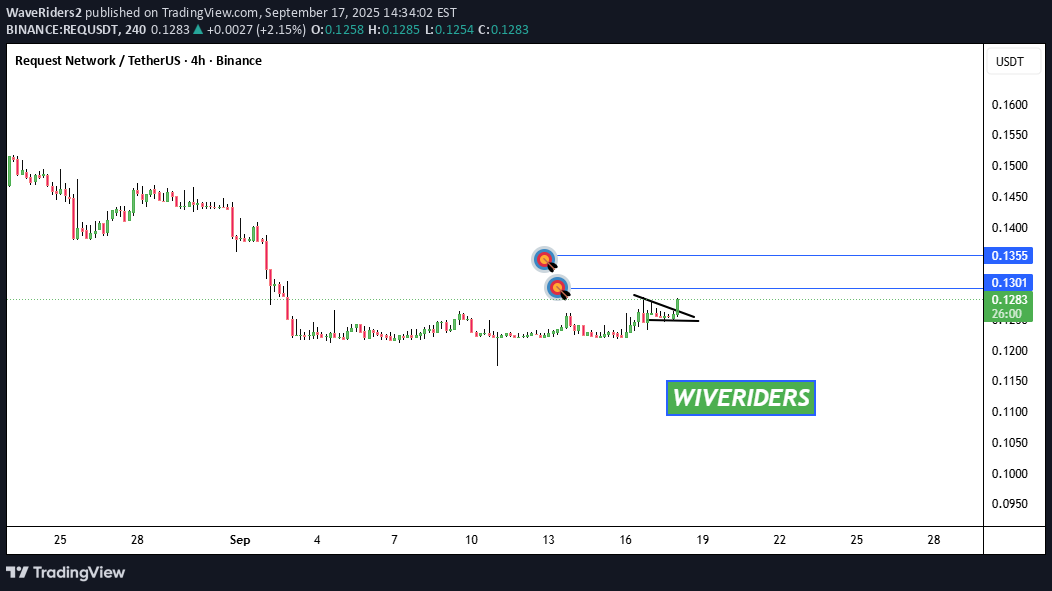
📊 $REQ Market Update $REQ has formed an ascending triangle 🔺 and already broke out ✅ 👉 Next steps: First target: blue line level 🎯 Second target: higher blue line level 🎯 👉 If buyers keep pushing, price could continue its bullish move 🚀 ⚡ Manage your trade — trail stop-loss as price moves.

ozantasdan49
Requsdt
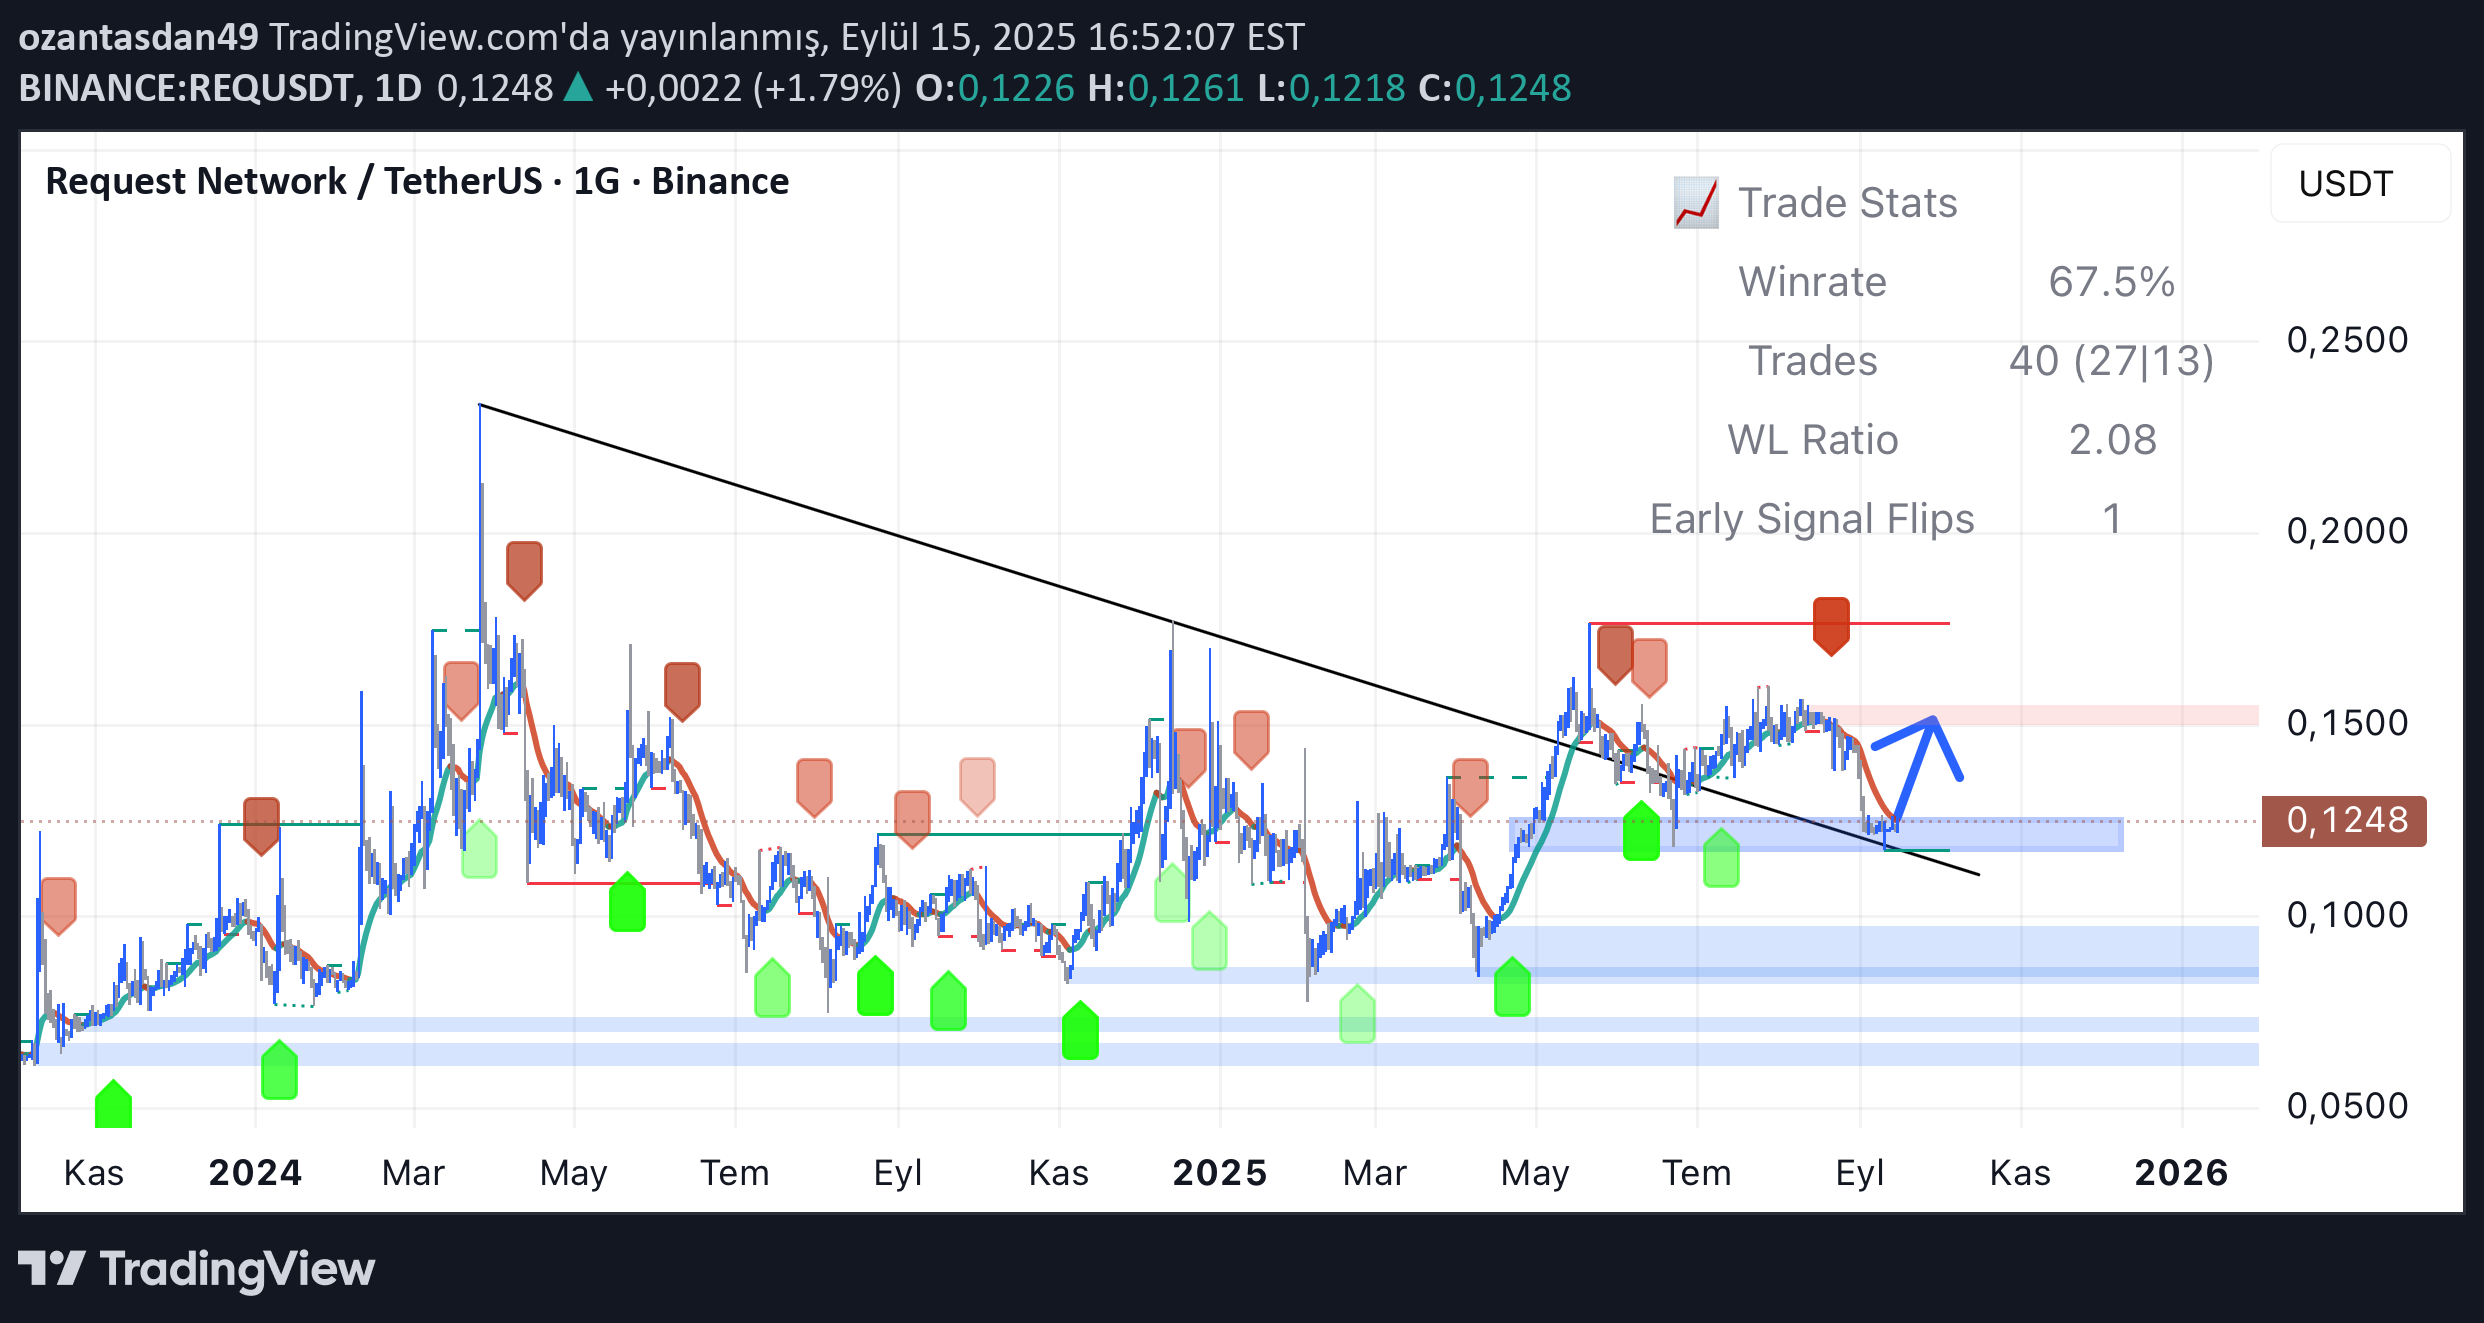
If the blue zone has broken the part and has come back to reset, he wants to try the red zone.

darksignal
Is it a time for REQUSDT? Potential target 0.15 - 16 %

On the Request Network / USDT (4h, Binance) chart, we can see a strong downward move that pushed the price towards the $0.128 area, where a first buying reaction is appearing. This level coincides with a local support zone that has previously stopped declines multiple times. Key points to note: The price has reached the lower boundary of the recent consolidation range, which increases the chances of a rebound. The sell-off was sharp, and markets often see corrective upward moves after such strong drops. Moving averages are still sloping down, but a short-term recovery is possible if buying pressure holds. In summary, there is a probability that in the coming days the price will attempt a rebound towards $0.15, which represents a psychological resistance and a former balance area from August. Potential TP: 0.15 USD

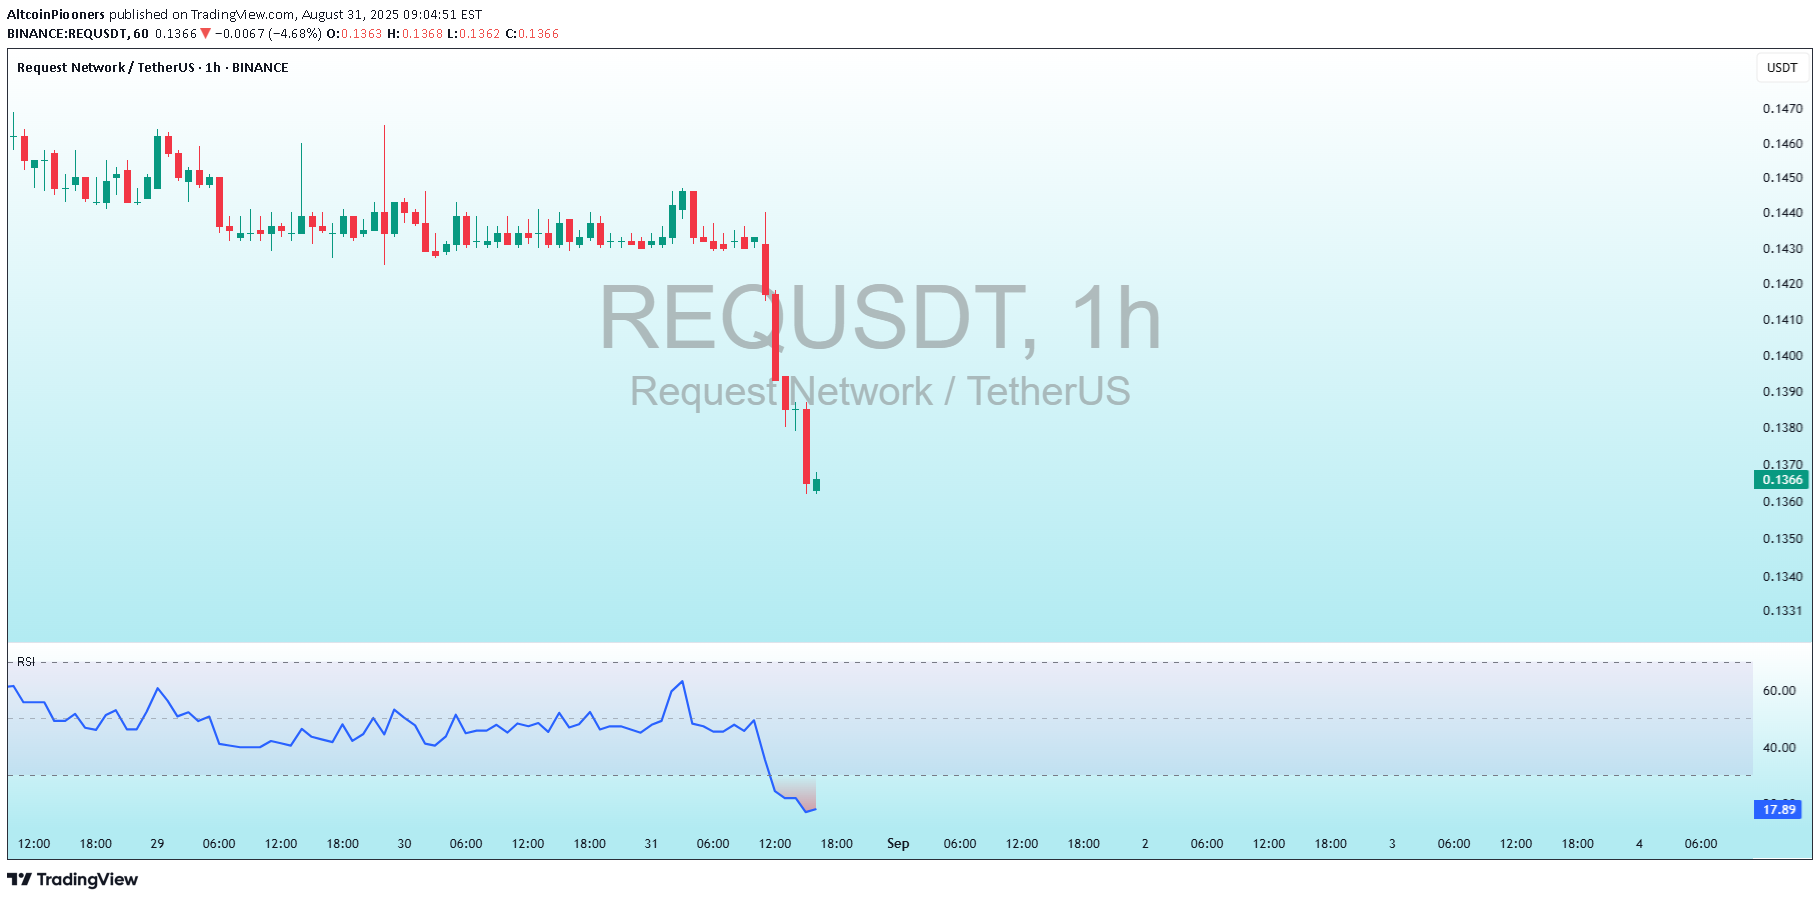
AltcoinPiooners
Seizing the $REQ Turnaround: A Detailed 4-Hour Chart Breakdown

REQUSDT Seizing the $REQ Turnaround: A Detailed 4-Hour Chart Breakdown Price Action Description Historical Trend: The price started around 0.18-0.20 USDT in late August, with a gradual decline punctuated by choppy movements. A sharp drop occurred in early September, pushing it toward 0.12-0.13 USDT, followed by a brief recovery attempt. Recent Movement: A significant red candlestick around September 1 marks a drop from approximately 0.15-0.16 USDT to 0.1297 USDT (current price), suggesting a strong selling pressure or market event. The price has stabilized near this level, with smaller candles indicating potential consolidation. Current Price: Approximately 0.1297 USDT, down about 20-30% from late August highs, hinting at possible oversold conditions. Volatility: Moderate to high, as seen in the long wicks and large candle bodies, especially during the recent drop, though volume data is not visible. Key Technical Levels Entry: Set at 0.1295 USDT, the suggested point to enter a long position, very close to the current price of 0.1297 USDT, indicating an immediate buy opportunity with minimal pullback expected. TP (Take Profit): Targets are 0.1786 USDT for the first profit take, followed by 0.1618 USDT, 0.1431 USDT, and the highest goal at 0.1568 USDT, providing a range of exit points for potential gains. DCA: Positioned at 0.1350 USDT, a level to add to the trade if the price dips slightly, helping to average down the entry cost. SL (Stop Loss): Placed at 0.1272 USDT, the cutoff to exit the trade if the price falls, limiting losses and protecting the position. Fibonacci Context: These levels likely stem from a Fibonacci retracement or extension tool applied to the recent drop from 0.18 USDT to 0.1297 USDT, suggesting a potential reversal zone for a long setup. Risk-Reward: Risk from 0.1295 to 0.1272 is 0.0023 USDT, with rewards to 0.1431 (0.0136, RR 5.9:1) and up to 0.1786 (0.0491, RR ~21.3:1), indicating an exceptionally favorable setup if the bounce materializes. Indicators Analysis RSI (Relative Strength Index): Current value is 19.52, below 30, signaling oversold conditions and a potential rebound. The line has trended downward sharply with the recent drop, showing momentum weakening, but no clear bullish divergence yet. The RSI scale (0-100) marks overbought above 70, not relevant here. Potential Trading Implications and Risks Bullish Case: The setup suggests a bottom-fishing opportunity post-drop, supported by oversold RSI. A rebound to take-profit levels is plausible if the broader crypto market stabilizes (e.g., Bitcoin trends) or if positive news emerges for Request Network (e.g., adoption updates). Bearish Case: The recent sharp decline and lack of immediate recovery indicate ongoing selling pressure. Breaking below 0.1272 (SL) could lead to further declines toward 0.12 USDT or lower. Market Context: As of 11:11 PM CEST on September 1, 2025, check for recent developments—e.g., network upgrades, partnerships, or macro factors like interest rate shifts affecting altcoins. Risks: Moderate altcoin volatility, lack of volume data (limiting liquidity insight), and subjective Fib levels. Use risk management (e.g., 1-2% account risk). Suggestions: Confirm with bullish patterns (e.g., hammer) at 0.1295 or RSI crossing above 30.
AltcoinPiooners
#REQ Possibile Mega Bullish
REQUSDT #REQUSDT 🟢 Long (1H) ➡️ RSI 14: 16.89 💵 Entry Price: 0.1365$ 📉 DCA Price: 0.1297$ 🛑 Stop Loss: 0.1232$ 🎯 Take Profit: 0.1502$ (+10.0%) ⚡ Scalp Target: 0.1433$ (+5.0%) ⏰ Updated: 2025-08-31 16:00

MasterAnanda
Request Network Has 1,800% Potential for Growth (Lev. Setup)
This is a chart setup that I am opening with leverage. It is not available on many exchanges and this reduces risk for swings and shakeouts. The action has been strong. Request Network (REQUSDT) produced a strong higher low in June compared to February and April this year. Many pairs produced double-bottoms or even a lower low in June. A higher low definitely reveals strength. This is what we have here. The consolidation period has been going for 1,169 days. This is the exact same number we found on the DigiByte chart, more than three years. Three years of consolidation can lead to a very strong bullish cycle. So strong that it is hard to visualize but it will happen. I am mapping a 1,800% target but just to be safe, I also have the 2,400%. Again, when the market lasts this long in the accumulation phase, it is because it is preparing for something great. The action is about to start within weeks or days. The last barrier is the long-term resistance (orange) line on the chart. Once this level breaks, immediately you can expect +300% to 500%. After this initial boom, you can enjoy slow and steady growth for months. That's where we are headed. This will not only happen to Request Network but for most of the altcoins, Bitcoin is already up. Retraces and corrections should be considered an opportunity to buy-in, rebuy and reload. Namaste.

CryptoAnalystSignal
#REQ/USDT

#REQThe price is moving within a descending channel on the 1-hour frame, adhering well to it, and is heading for a strong breakout and retest.We are seeing a bounce from the lower boundary of the descending channel, which is support at 0.1367.We have a downtrend on the RSI indicator that is about to break and retest, supporting the upward trend.We are looking for stability above the 100 Moving Average.Entry price: 0.1386First target: 0.1400Second target: 0.1420Third target: 0.1440
MasterAnanda
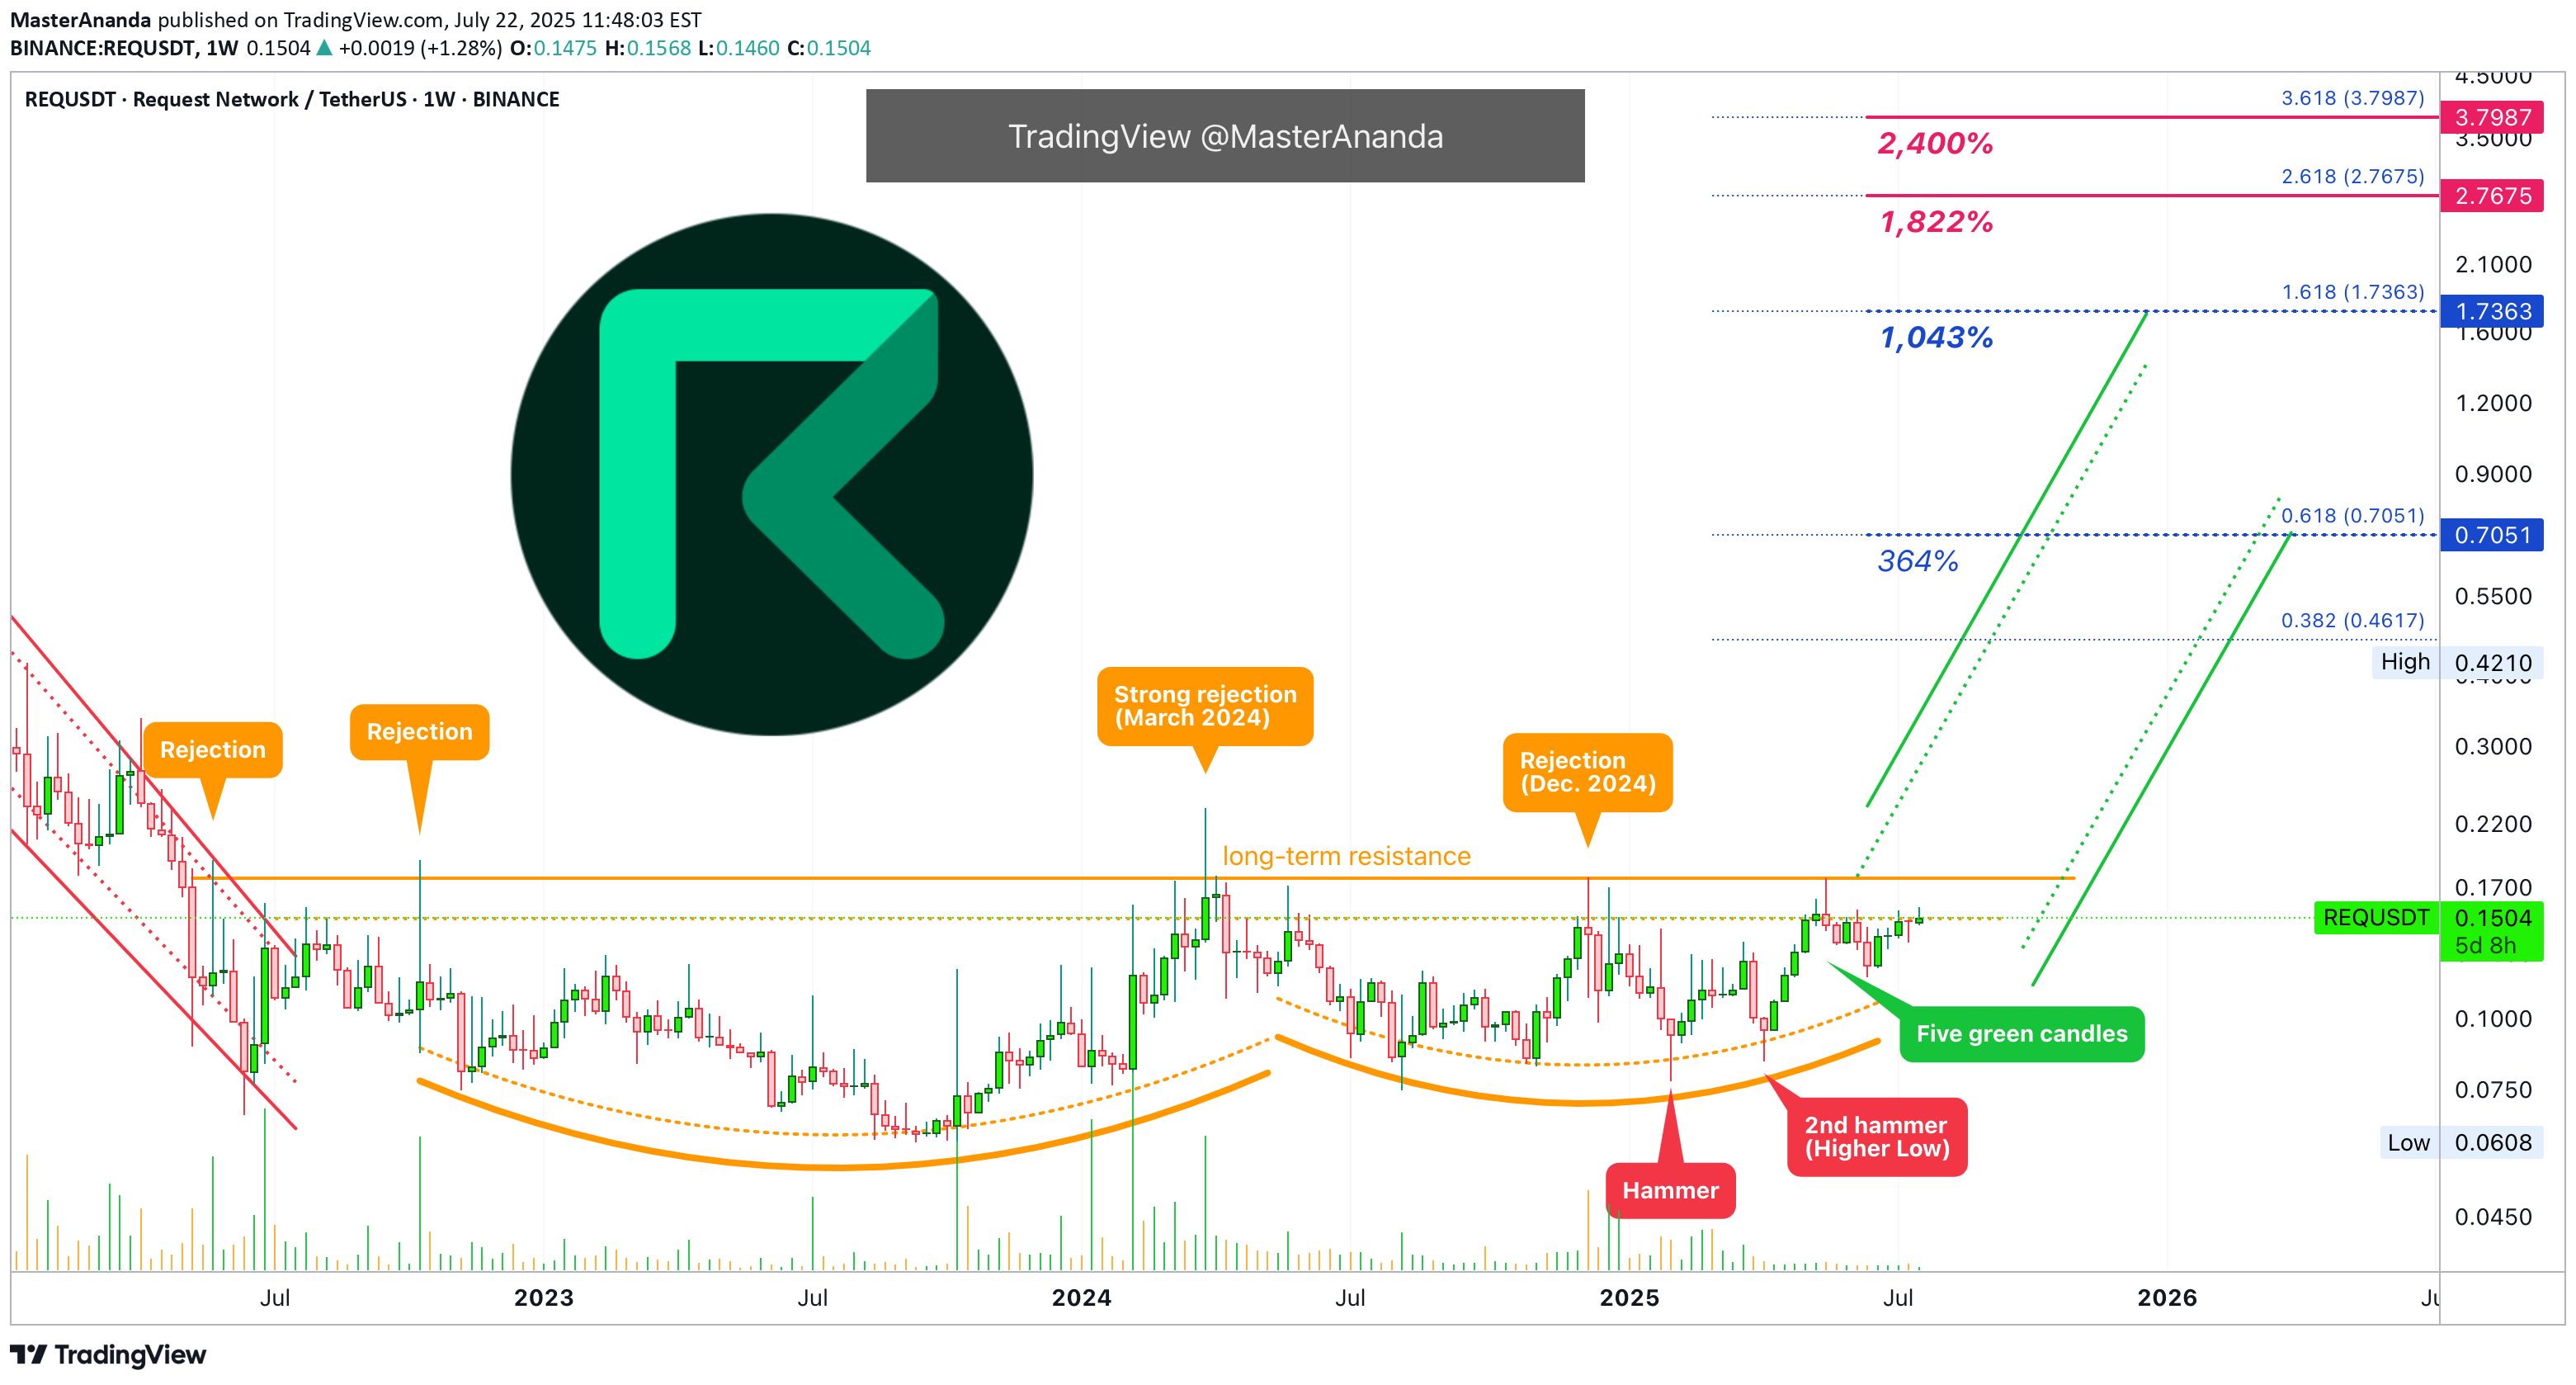
Request Network Long-Term Resistance & New ATH (PP: 1195%)

The previous three weeks all closed green and were perfect full bodied candles. This is a strong signal on its own. But REQUSDT (Request Network) didn't print this signal in isolation, it is coming after a hammer candlestick pattern which is also a short-term and long-term higher low. Makes sense?The market bottom was hit in September 2023. The three white soldiers, as it is called in candlestick reading, is an action signal. It confirms an advance will happen and the hammer candlestick pattern is a reversal signal. The long-term higher lows is a chart structure signal and it can help us project how the pair in question will behave in the future.With a strong chart structure, we can predict a strong bull market for this pair.With the action and reversal signal, we can predict the start of the next bullish wave within days. It is already happening because three weeks closing green is a decent amount of time.The resistance zone on this chart is well established. This resistance was confirmed in May 2022 with a full rejection on a candle. The again in October 2022 there was a strong attempt by the bulls to push prices higher but another failure it seems.In March 2024 there was another rejection, a strong one because this one cancelled a bullish wave. The final rejection at this long-term resistance zone happened in December 2024. While the resistance range stays the same, the support zone has been growing from its base (higher lows).Ok, I will make my prediction now.» On the next advance, which is part of the current bullish wave, REQUSDT will break this long-term resistance and challenge $0.70 as the first strong target. After this level is challenged there will be a correction followed by additional growth. This additional growth will lead to a new All-Time High as part of the 2025 bull market bull run.Thank you for reading and for your continued support.Namaste.

Bitcoin & Altcoins Signals
Disclaimer
Any content and materials included in Sahmeto's website and official communication channels are a compilation of personal opinions and analyses and are not binding. They do not constitute any recommendation for buying, selling, entering or exiting the stock market and cryptocurrency market. Also, all news and analyses included in the website and channels are merely republished information from official and unofficial domestic and foreign sources, and it is obvious that users of the said content are responsible for following up and ensuring the authenticity and accuracy of the materials. Therefore, while disclaiming responsibility, it is declared that the responsibility for any decision-making, action, and potential profit and loss in the capital market and cryptocurrency market lies with the trader.