
RENDER
Render
| تریدر | نوع سیگنال | حد سود/ضرر | زمان انتشار | مشاهده پیام |
|---|---|---|---|---|
No results found. | ||||
Price Chart of Render
سود 3 Months :
سیگنالهای Render
Filter
Sort messages by
Trader Type
Time Frame

MyCryptoParadise
رندر (RENDER) از اینجا صعود میکند یا سقوط؟ نشانههای حیاتی بازار
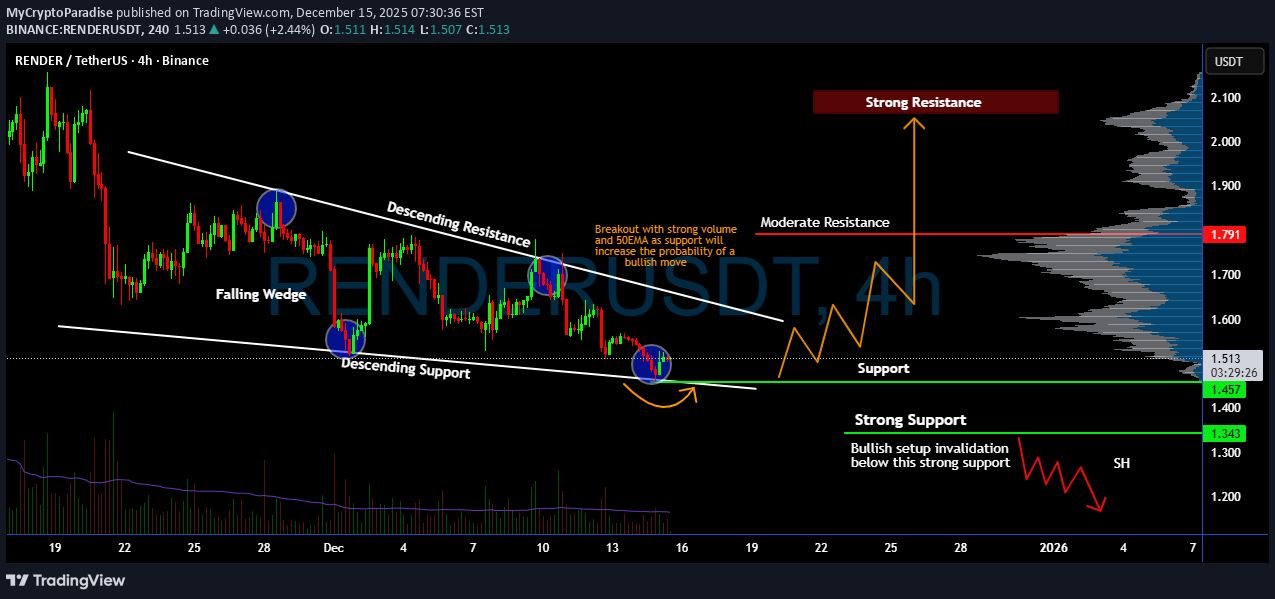
Yello, Paradiser! Are you watching how #RENDERUSDT is respecting this falling wedge structure? Is a recovery on the horizon? Let's view the #Render setup: 💎#RENDERUSD is currently sitting right at the wedge's descending support after multiple rejections from the upper resistance trendline. Each touch of this support has triggered buyer interest, and if we see a breakout with strong volume, especially reclaiming the 50EMA, it could confirm a bullish shift. 💎This exact price action setup, a falling wedge paired with volume contraction, is a classic pre-breakout scenario. If the price pushes above the descending resistance with strength, it opens the path toward the moderate resistance around $1.79, with a potential continuation toward the strong resistance zone near $2.10. 💎On the downside, the strong support at $1.34 is critical. If we see a clean breakdown below that level with no recovery, it would invalidate this bullish setup and open the door for a deeper retracement into the low $1.20s. So far, however, buyers are stepping in aggressively whenever price dips into this support range — a sign of ongoing accumulation. 💎The next 1-2 candles will be crucial. A breakout above the wedge with volume confirmation could trigger a fast squeeze as short positions unwind and momentum buyers rush in. But patience is key, wait for the breakout and retest for the highest probability setup. Trade smart, Paradisers. This setup will reward only the disciplined. MyCryptoParadise iFeel the success🌴

CobraVanguard
زمان خرید مجدد رندر (RNDR) فرا رسیده است؟ مثلث صعودی در کمین!
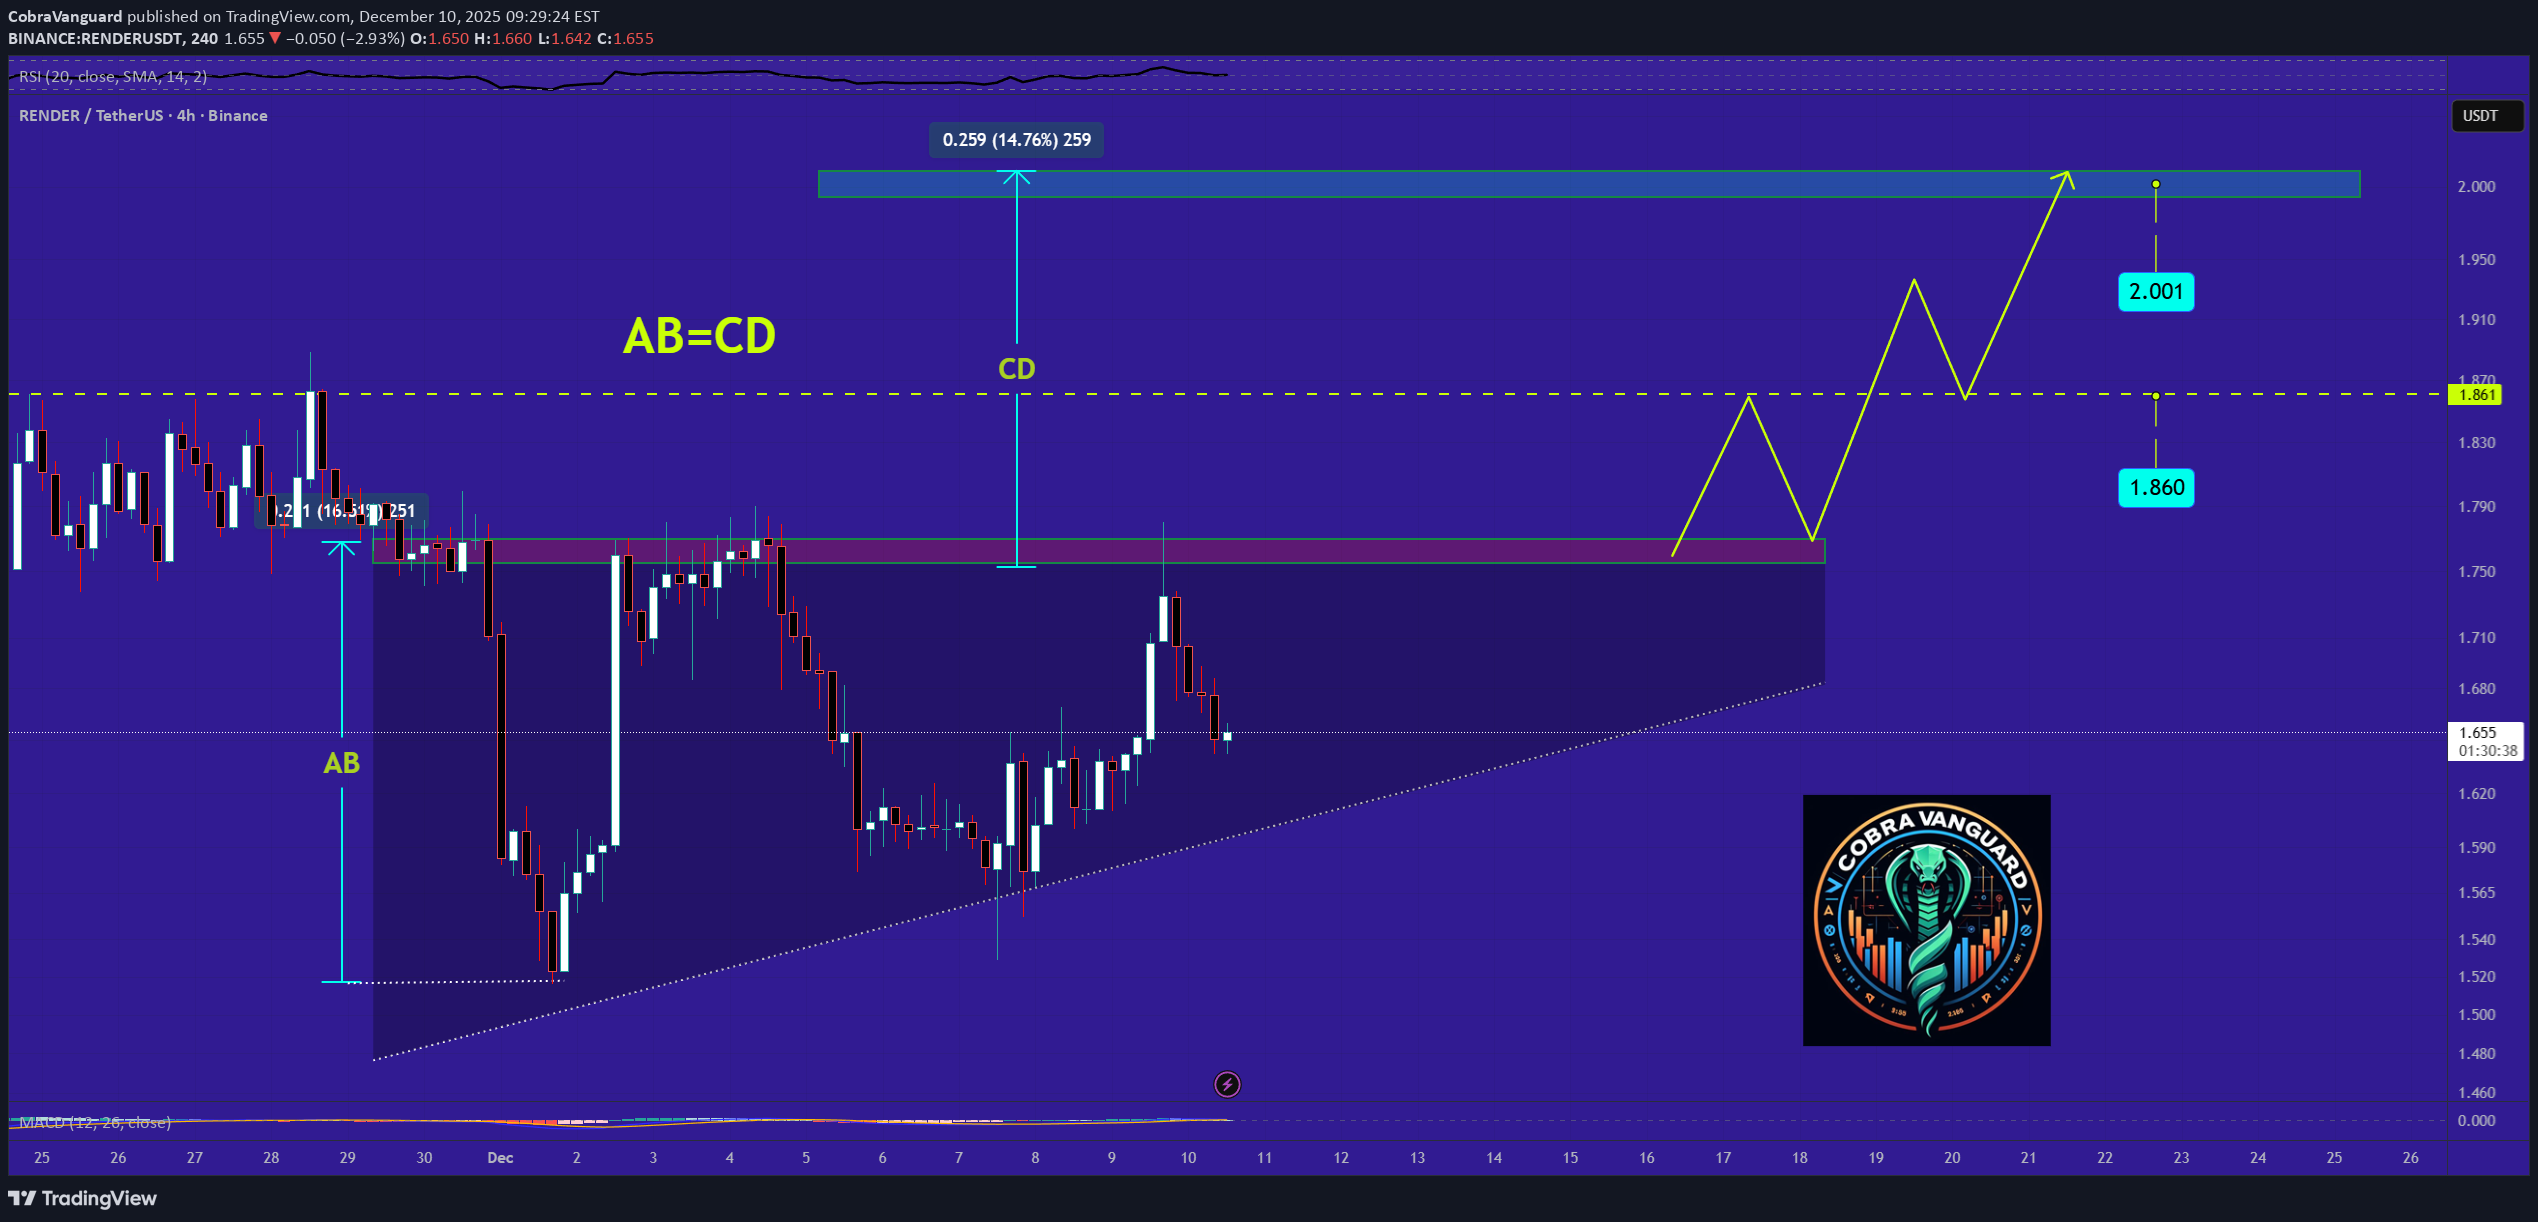
The price on the 4h timeframe is within an ascending triangle, which can be promising. If the price breaks this pattern with bullish candles, it could easily rise by the distance of AB=CD.

TheHunters_Company
تحلیل تکنیکال RENDER/USDT: بهترین نقاط فروش محدود (Sell Limit) در بازار نزولی
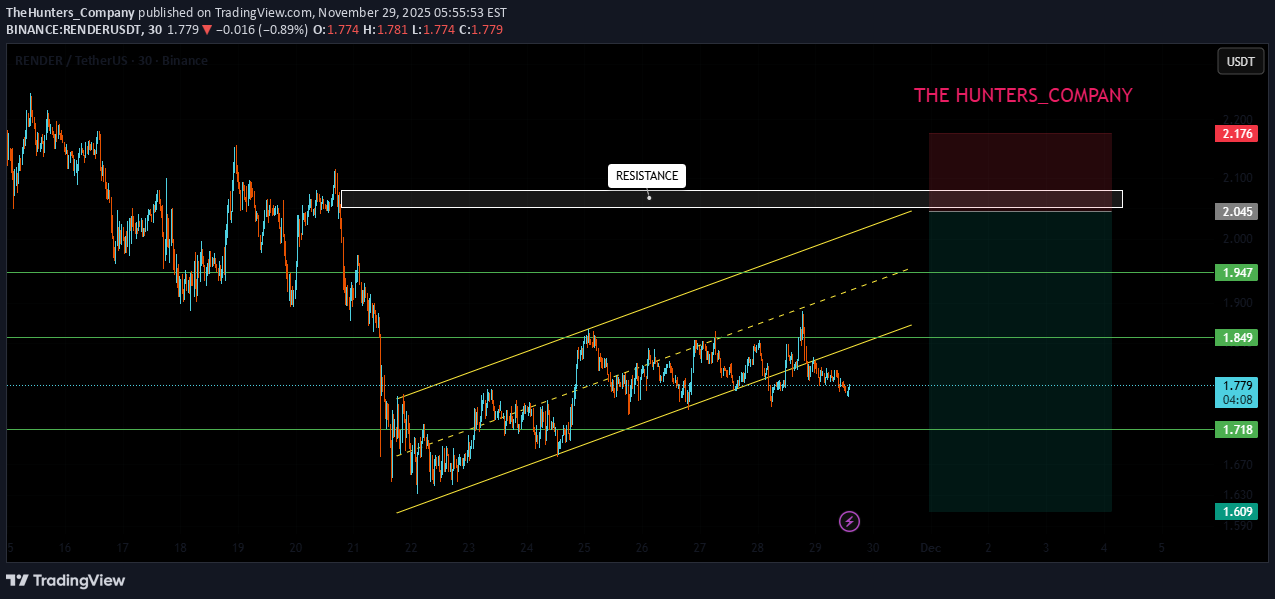
Hello friends Given the downward trend we are having, you can see that the power is in the hands of the sellers. Now, if the price reaches the resistance areas, it is a good opportunity to sell. Be careful that if the structure breaks, it is no longer logical to sell. So we should see the power of the buyers in the resistance area, but most likely we will see a price correction. This analysis is purely technically reviewed and is not a buy or sell recommendation, so do not act emotionally and observe capital management. *Trade safely with us*

BandForBands
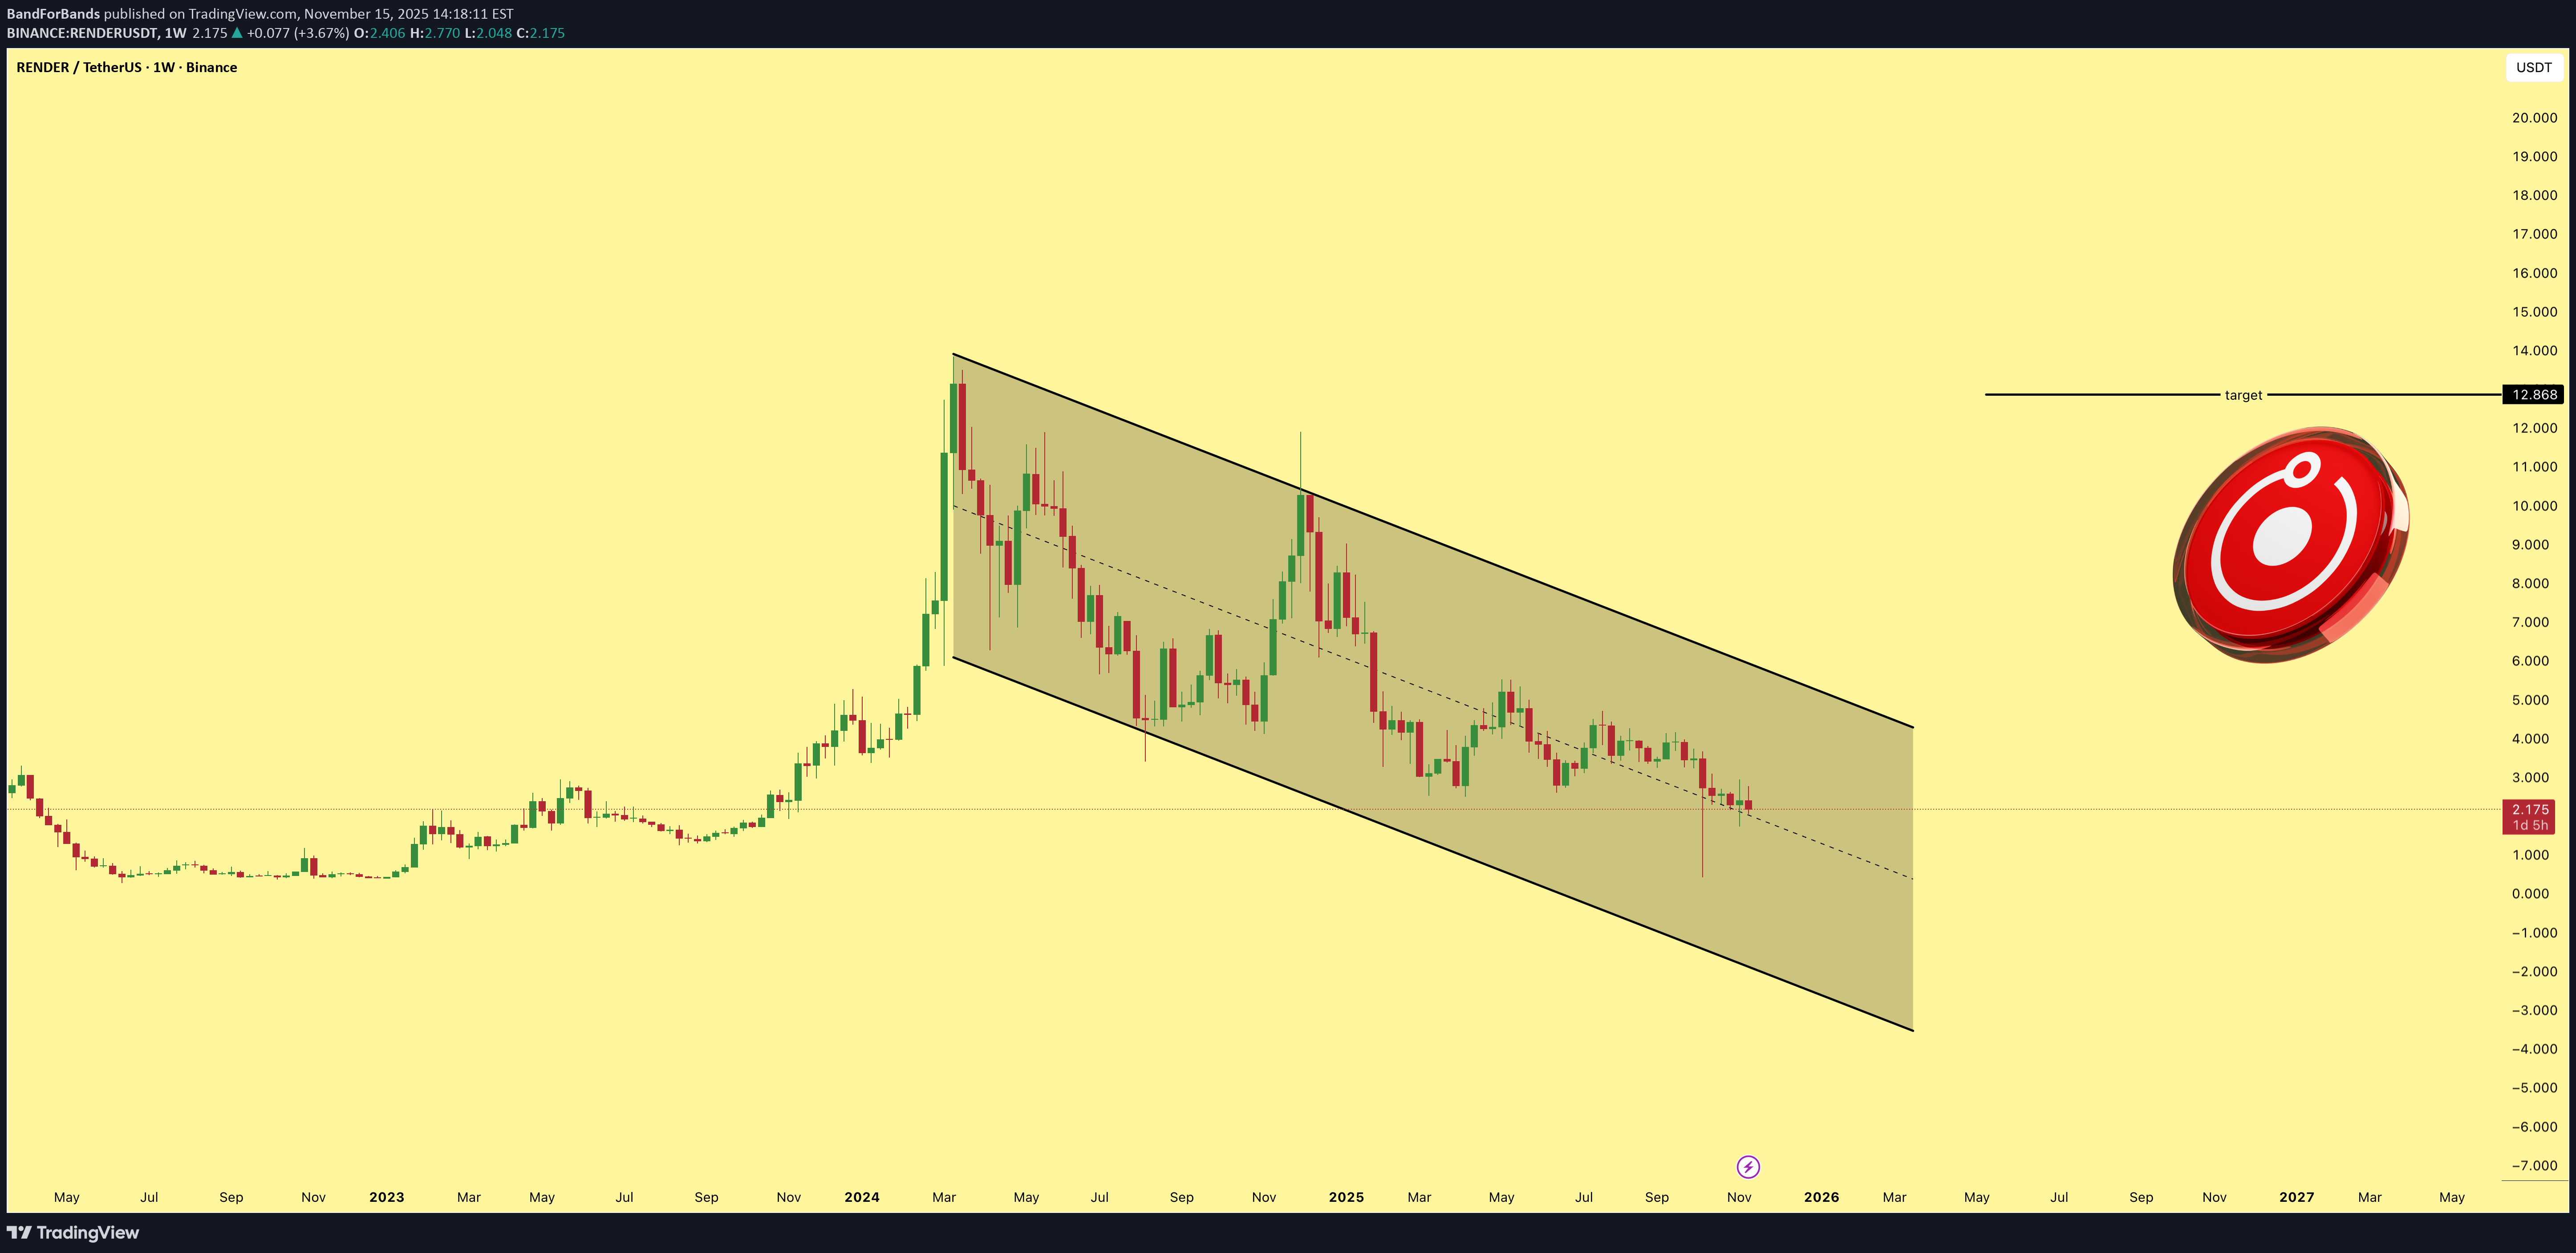
رندر (RENDER): آماده انفجار ۸۰۰ درصدی؟ راز نهفته در کانال نزولی!
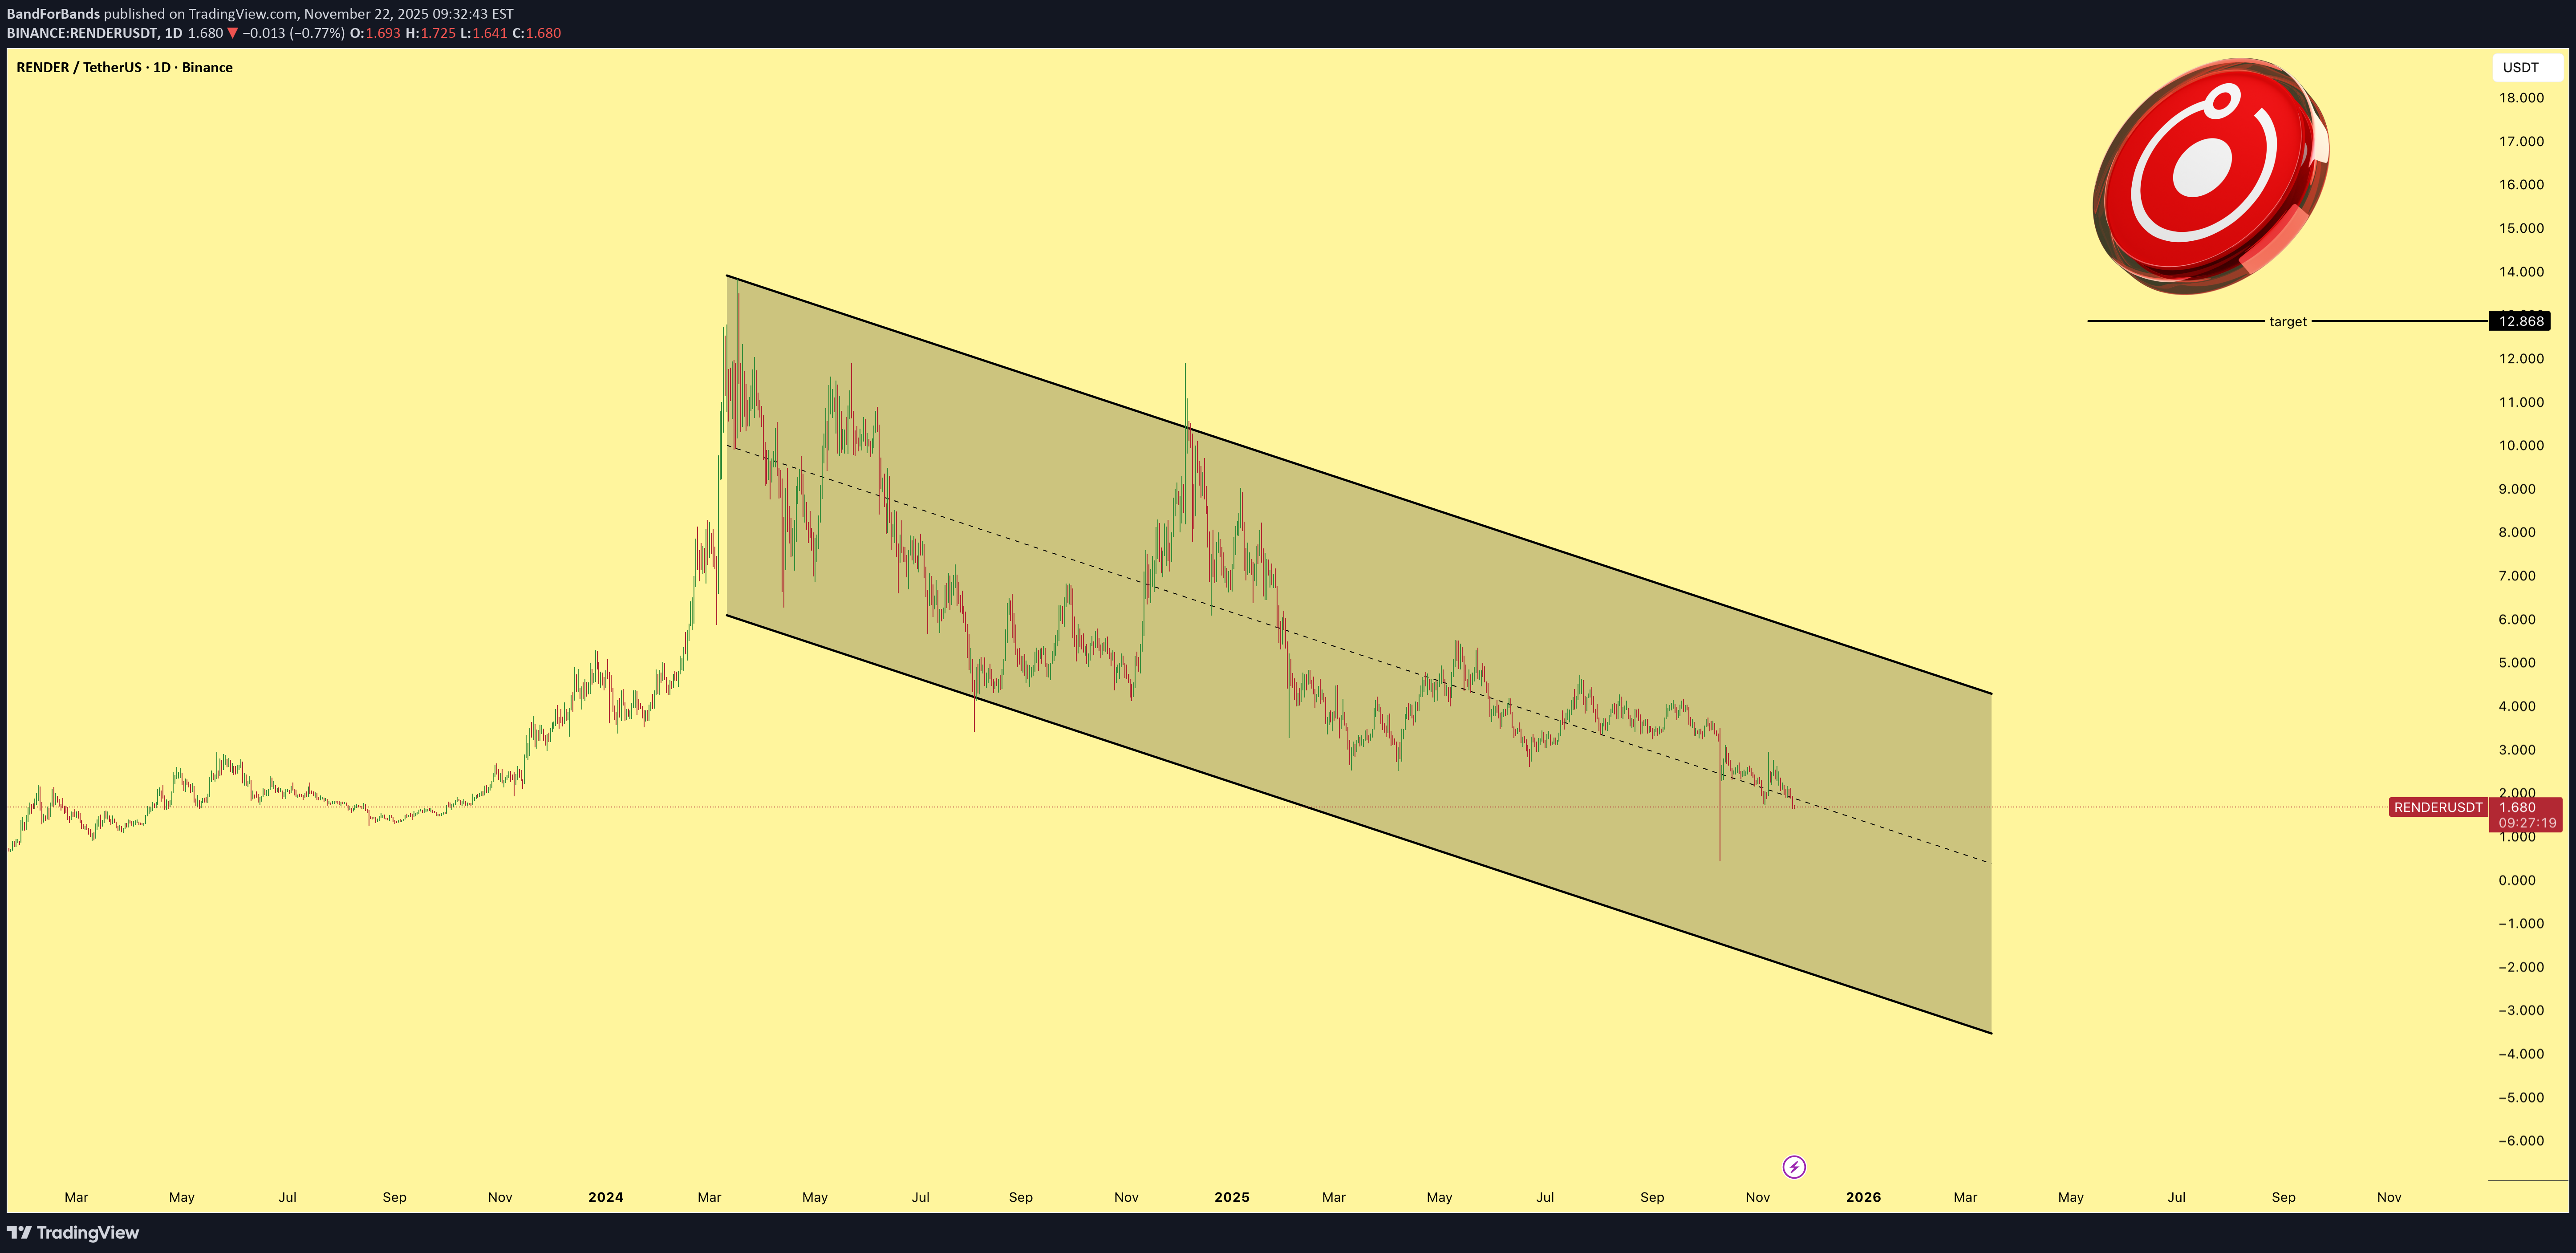
RENDER is trading inside a clean descending channel pattern and building pressure for a reversal. Once it breaks out, the measured target supports more than 800 percent in potential gains from the current price. This is a high conviction setup.

VIPCryptoVault
رشد 30 درصدی رندر (RENDER): استراتژی خرید، فروش و حد ضرر تضمینی!
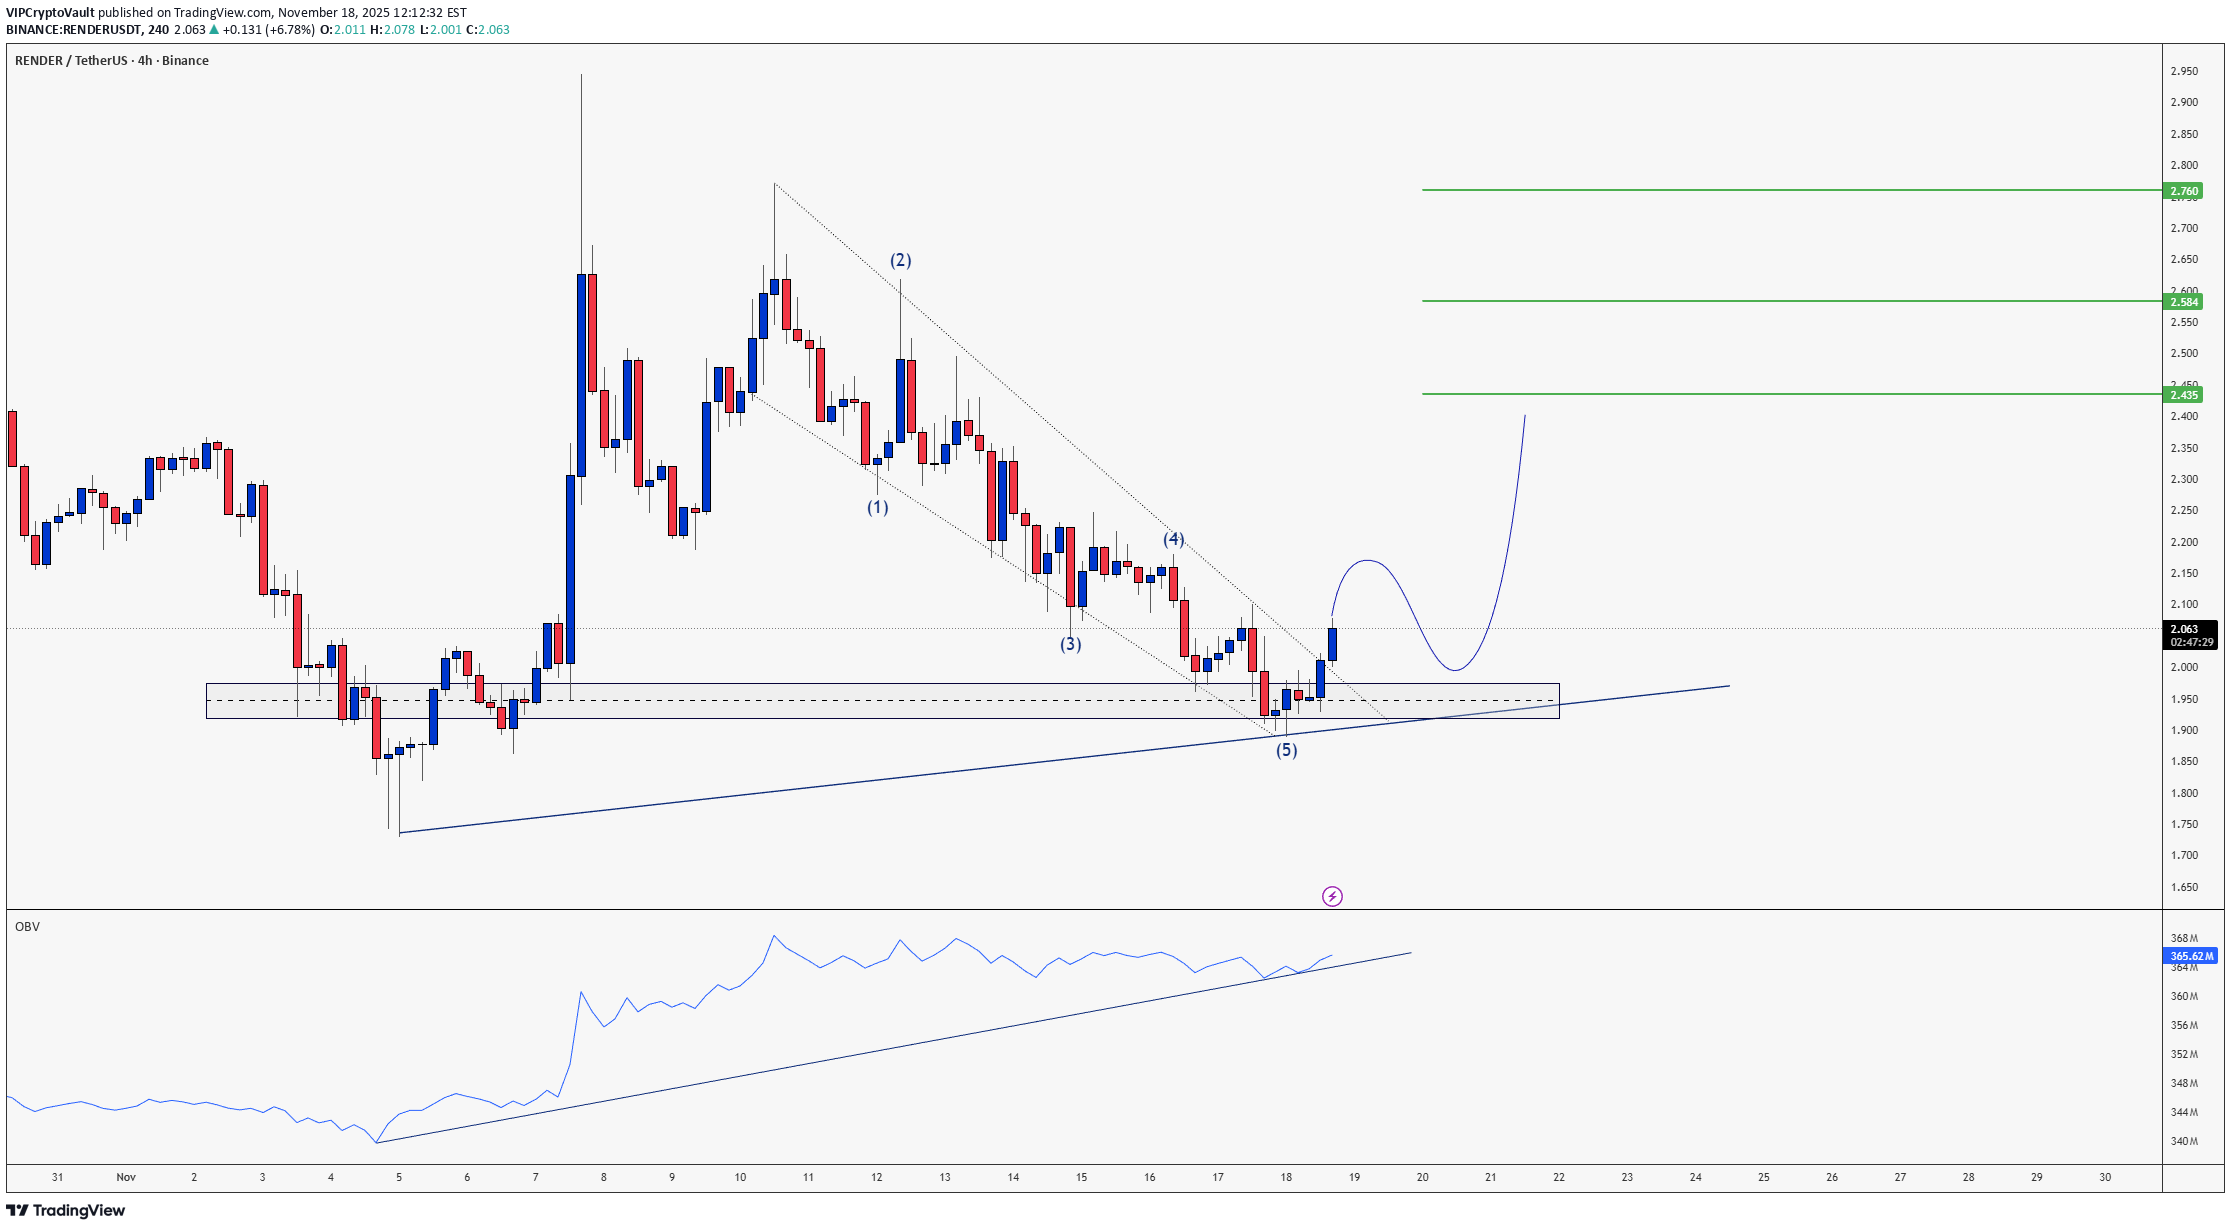
This one is pretty simple and self explanatory. Buy from current price. • TP1: $2.435 • TP1: $2.584 • TP1: $2.760 Stop Loss: Close below $1.84
BandForBands
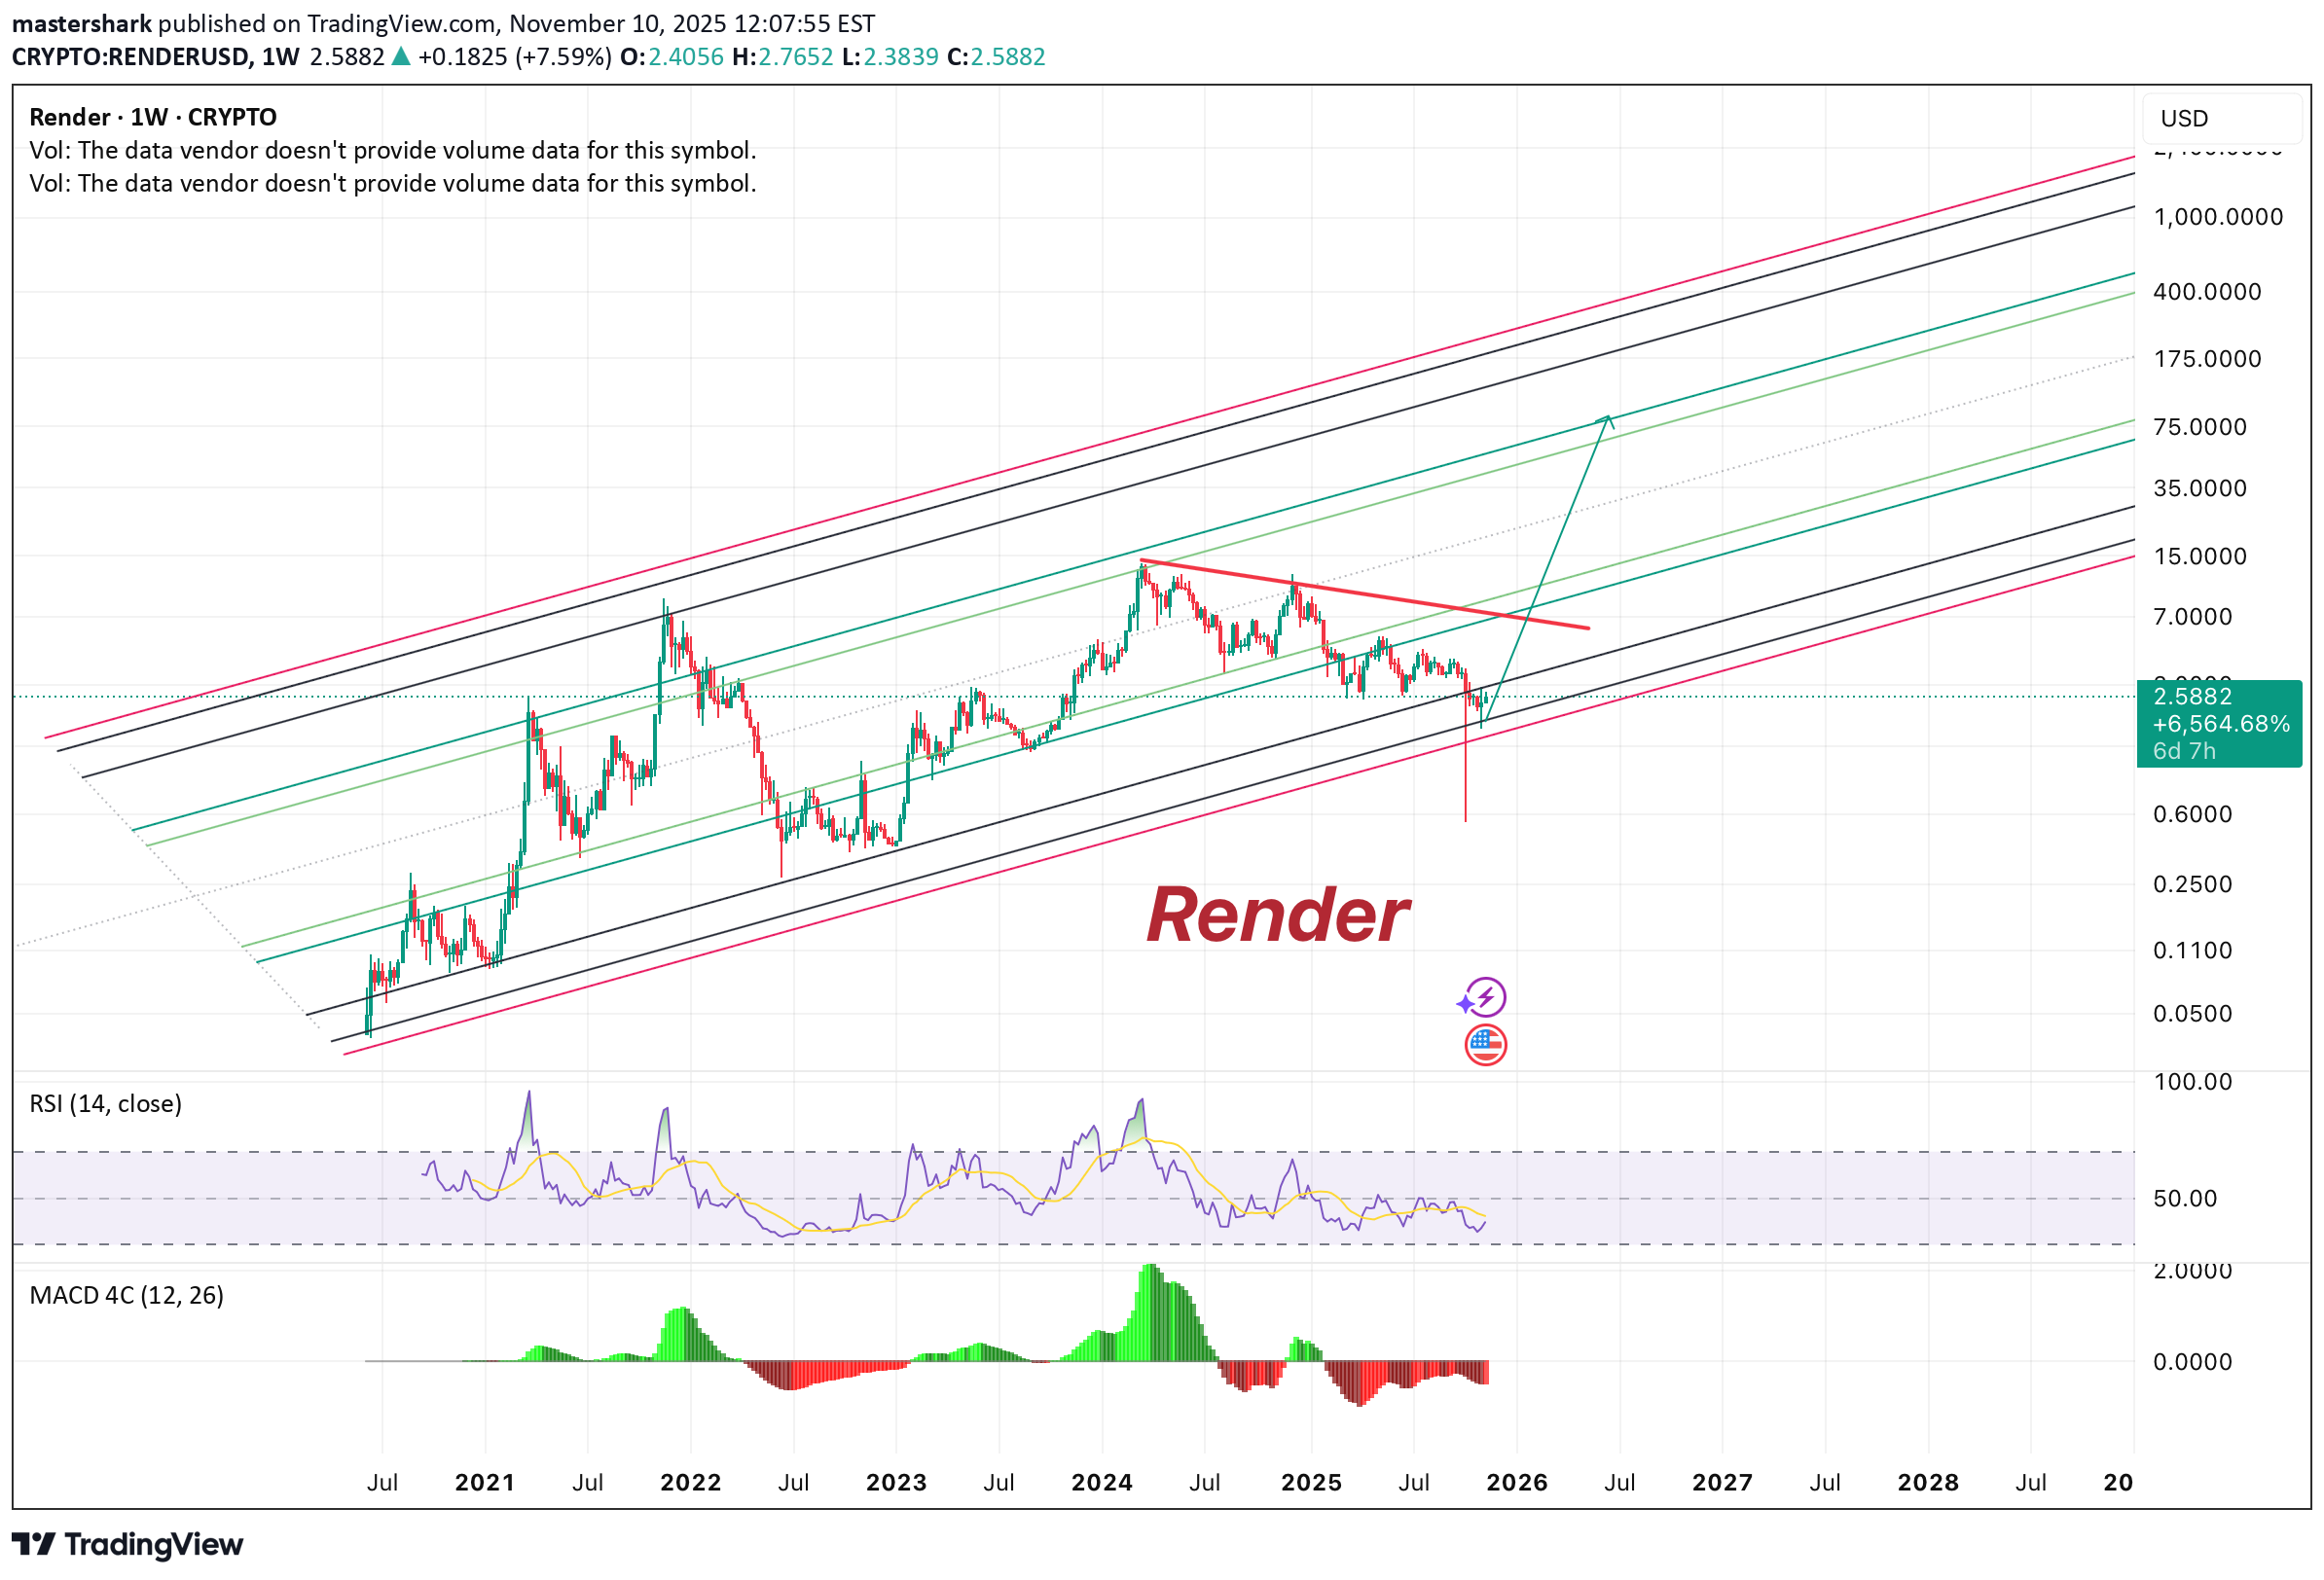
رندر (RENDER): فرصت 500 درصدی در کانال نزولی - استراتژی DCA برای سود کلان!
RENDER is trading inside a descending channel pattern, giving plenty of room to DCA into the position. From the current price to the target, there is a potential 500 percent gain. The structure looks clean and the long term setup is strong.

MarketIntel


davidjulien369
تحلیل کامل معامله خرید RENDERUSDT: استراتژی ورود کمریسک با پاداش 12.8 برابری
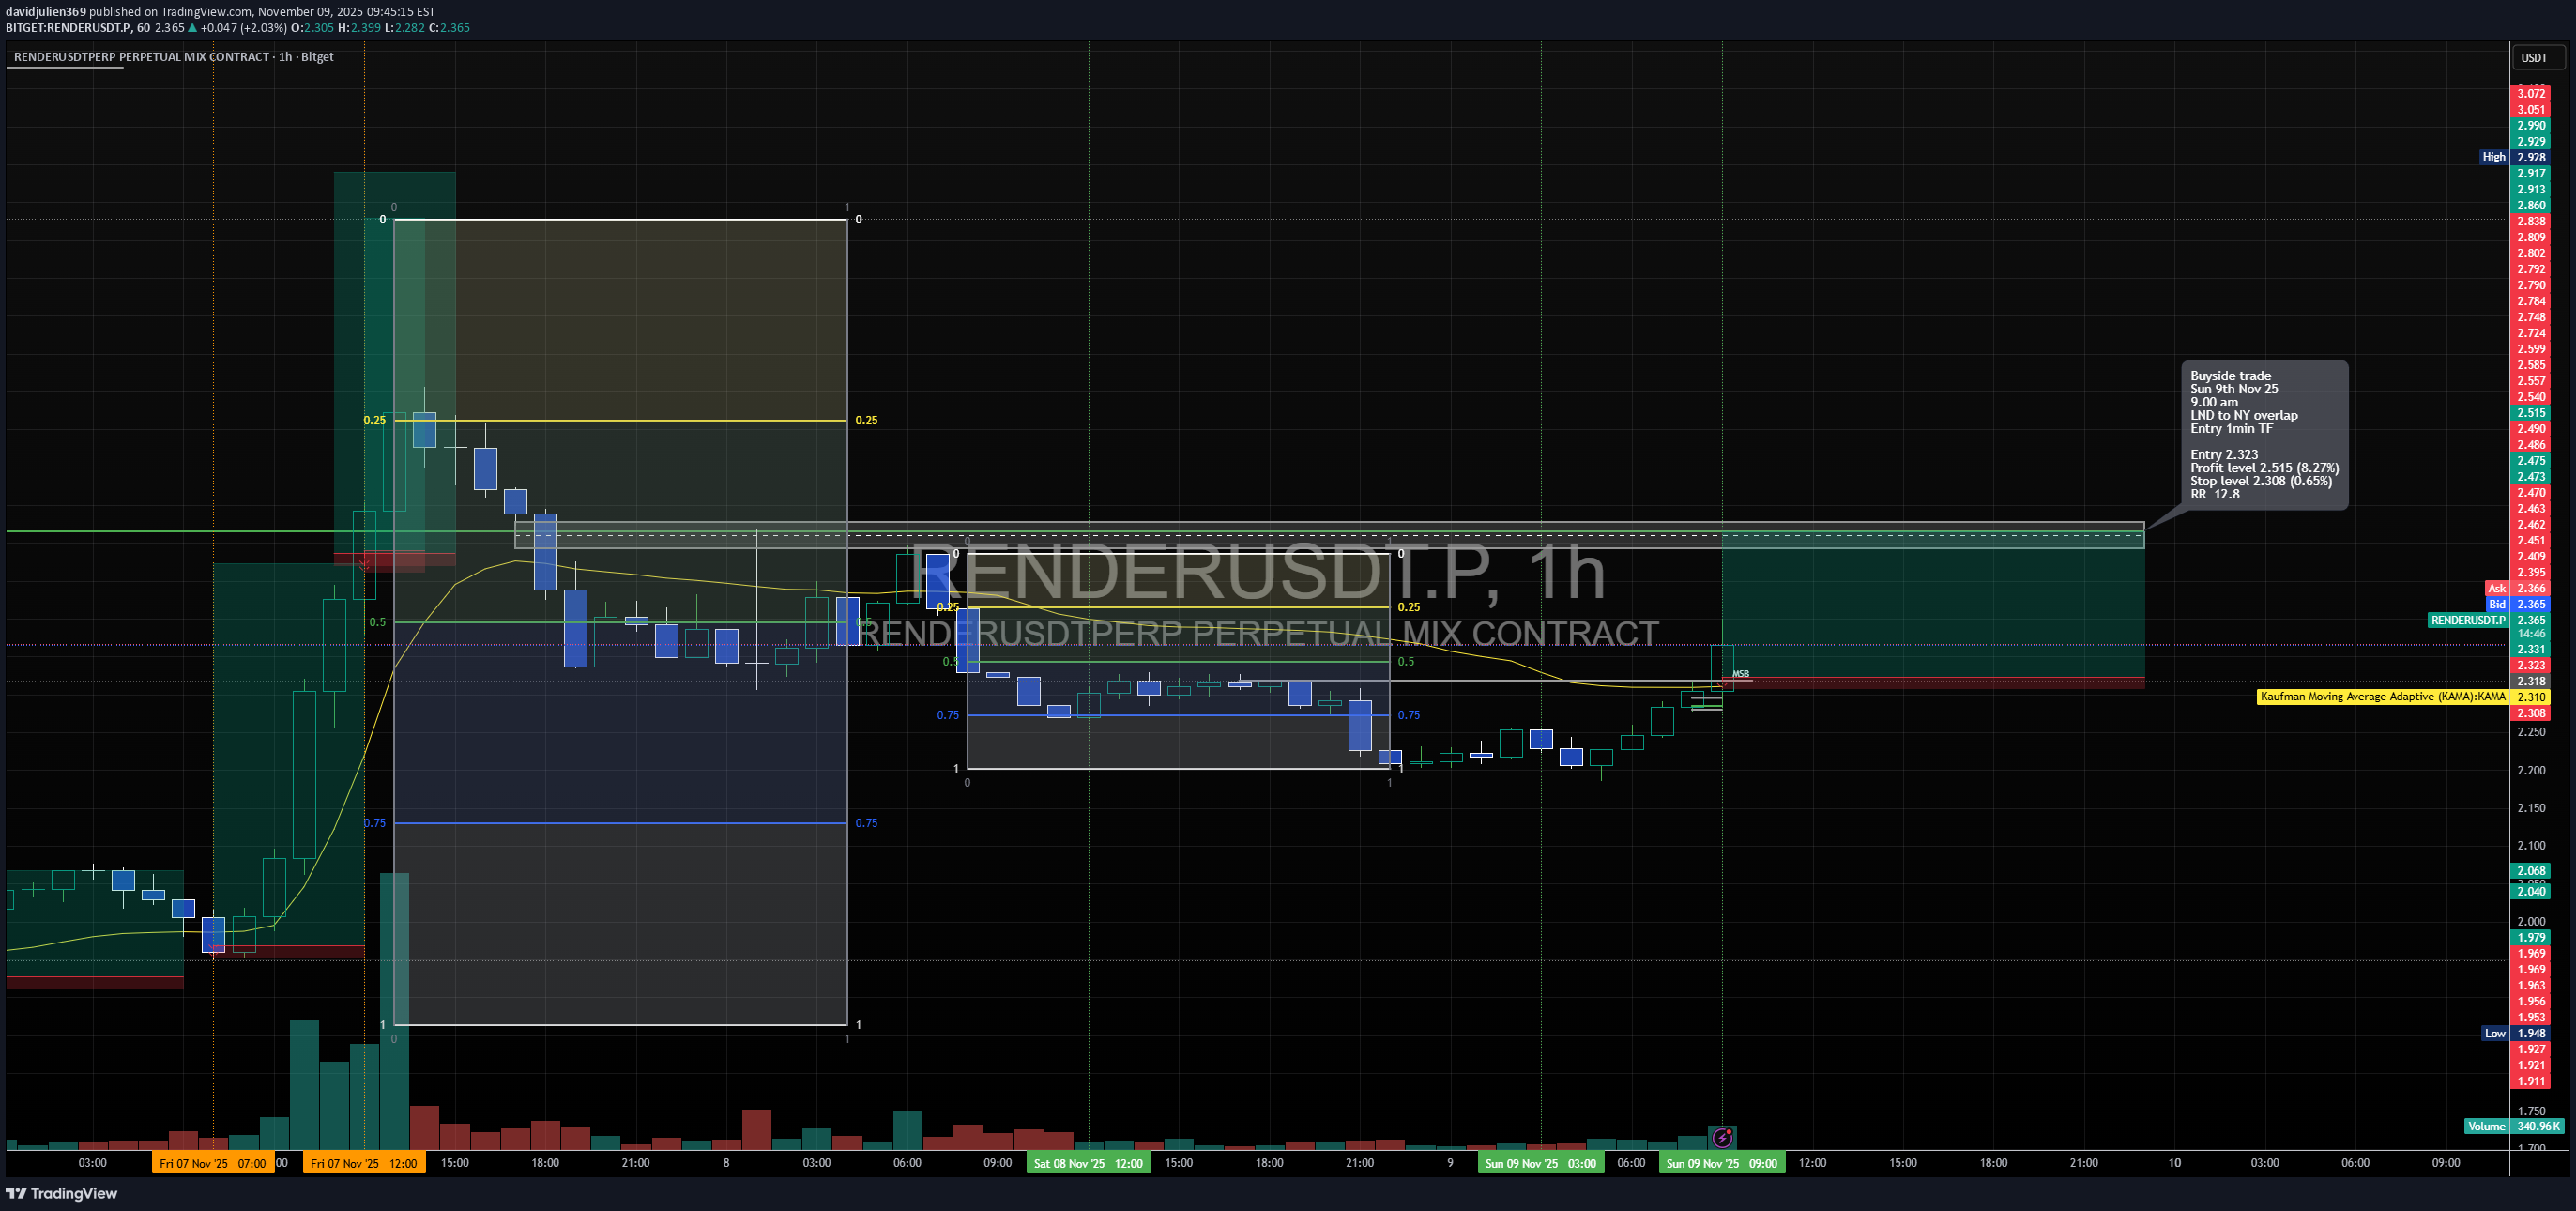
1Ht TF overview 📘 Trade Journal Entry Pair: RENDERUSDT.P Date: Sun 9 Nov 2025 Session: London → New York Overlap Direction: Buy-side Trade Timeframe: 1 Hour (Entry refined on 1-min TF) 🔹 Trade Details Entry: 2.323 Take Profit (TP): 2.515 (+8.27 %) Stop Loss (SL): 2.308 (–0.65 %) Risk / Reward (RR): 12.8 R 🔹 Market Context 🧾Following an aggressive markup leg on Nov 7, the price entered a retracement phase that mitigated the previous bullish FVG. 🧾The discount region (0.75 Fib) aligned with the KAMA dynamic support (≈ 2.31), forming a low-risk accumulation zone. 🧾Volume contraction and the formation of a mini-range indicated absorption of residual supply. 🧾Break above micro-breaker (2.33) confirmed a structural CHOCH on the lower TF, setting up a potential continuation toward 2.51 liquidity. 🔹 Model Type Re-accumulation → Breaker Block → Continuation Model A corrective decline retraced into prior OB support; bulls defended it. Entry executed on confirmation of bullish displacement through intraday structure. Target aims for upper inefficiency fill near 2.50–2.52 range, aligning with HTF imbalance. 1min Tf overview 📈 Execution Notes Entry triggered immediately after bullish MSB on 1-min TF. SL is placed below reactive OB at 2.308 to maintain tight risk. TP is positioned just under the premium Fib extension, (0.25 zone ≈ 2.515) to secure profits before the major liquidity pool. Volume signature: buying pressure returned with a mid-range engulfing candle — institutional buying confirmed. 🔹 Trade Narrative This RENDER setup highlights a refined continuation entry within a developing bullish expansion. After the Nov 7 impulse, market structure rotated into a controlled pullback; the reaction from the discount zone confirmed the re-accumulation phase. The buyside trade leverages momentum alignment on KAMA and volume acceleration during session overlap, projecting a measured move toward 2.5 premium liquidity for an approximate 12 R return. 5min TF (Sweep/trigger/model 010)Stop level moved (5.55%)

suleymankumyol
تحلیل تکنیکال RENDERUSDT: آیا فرصت خرید جدیدی در راه است؟
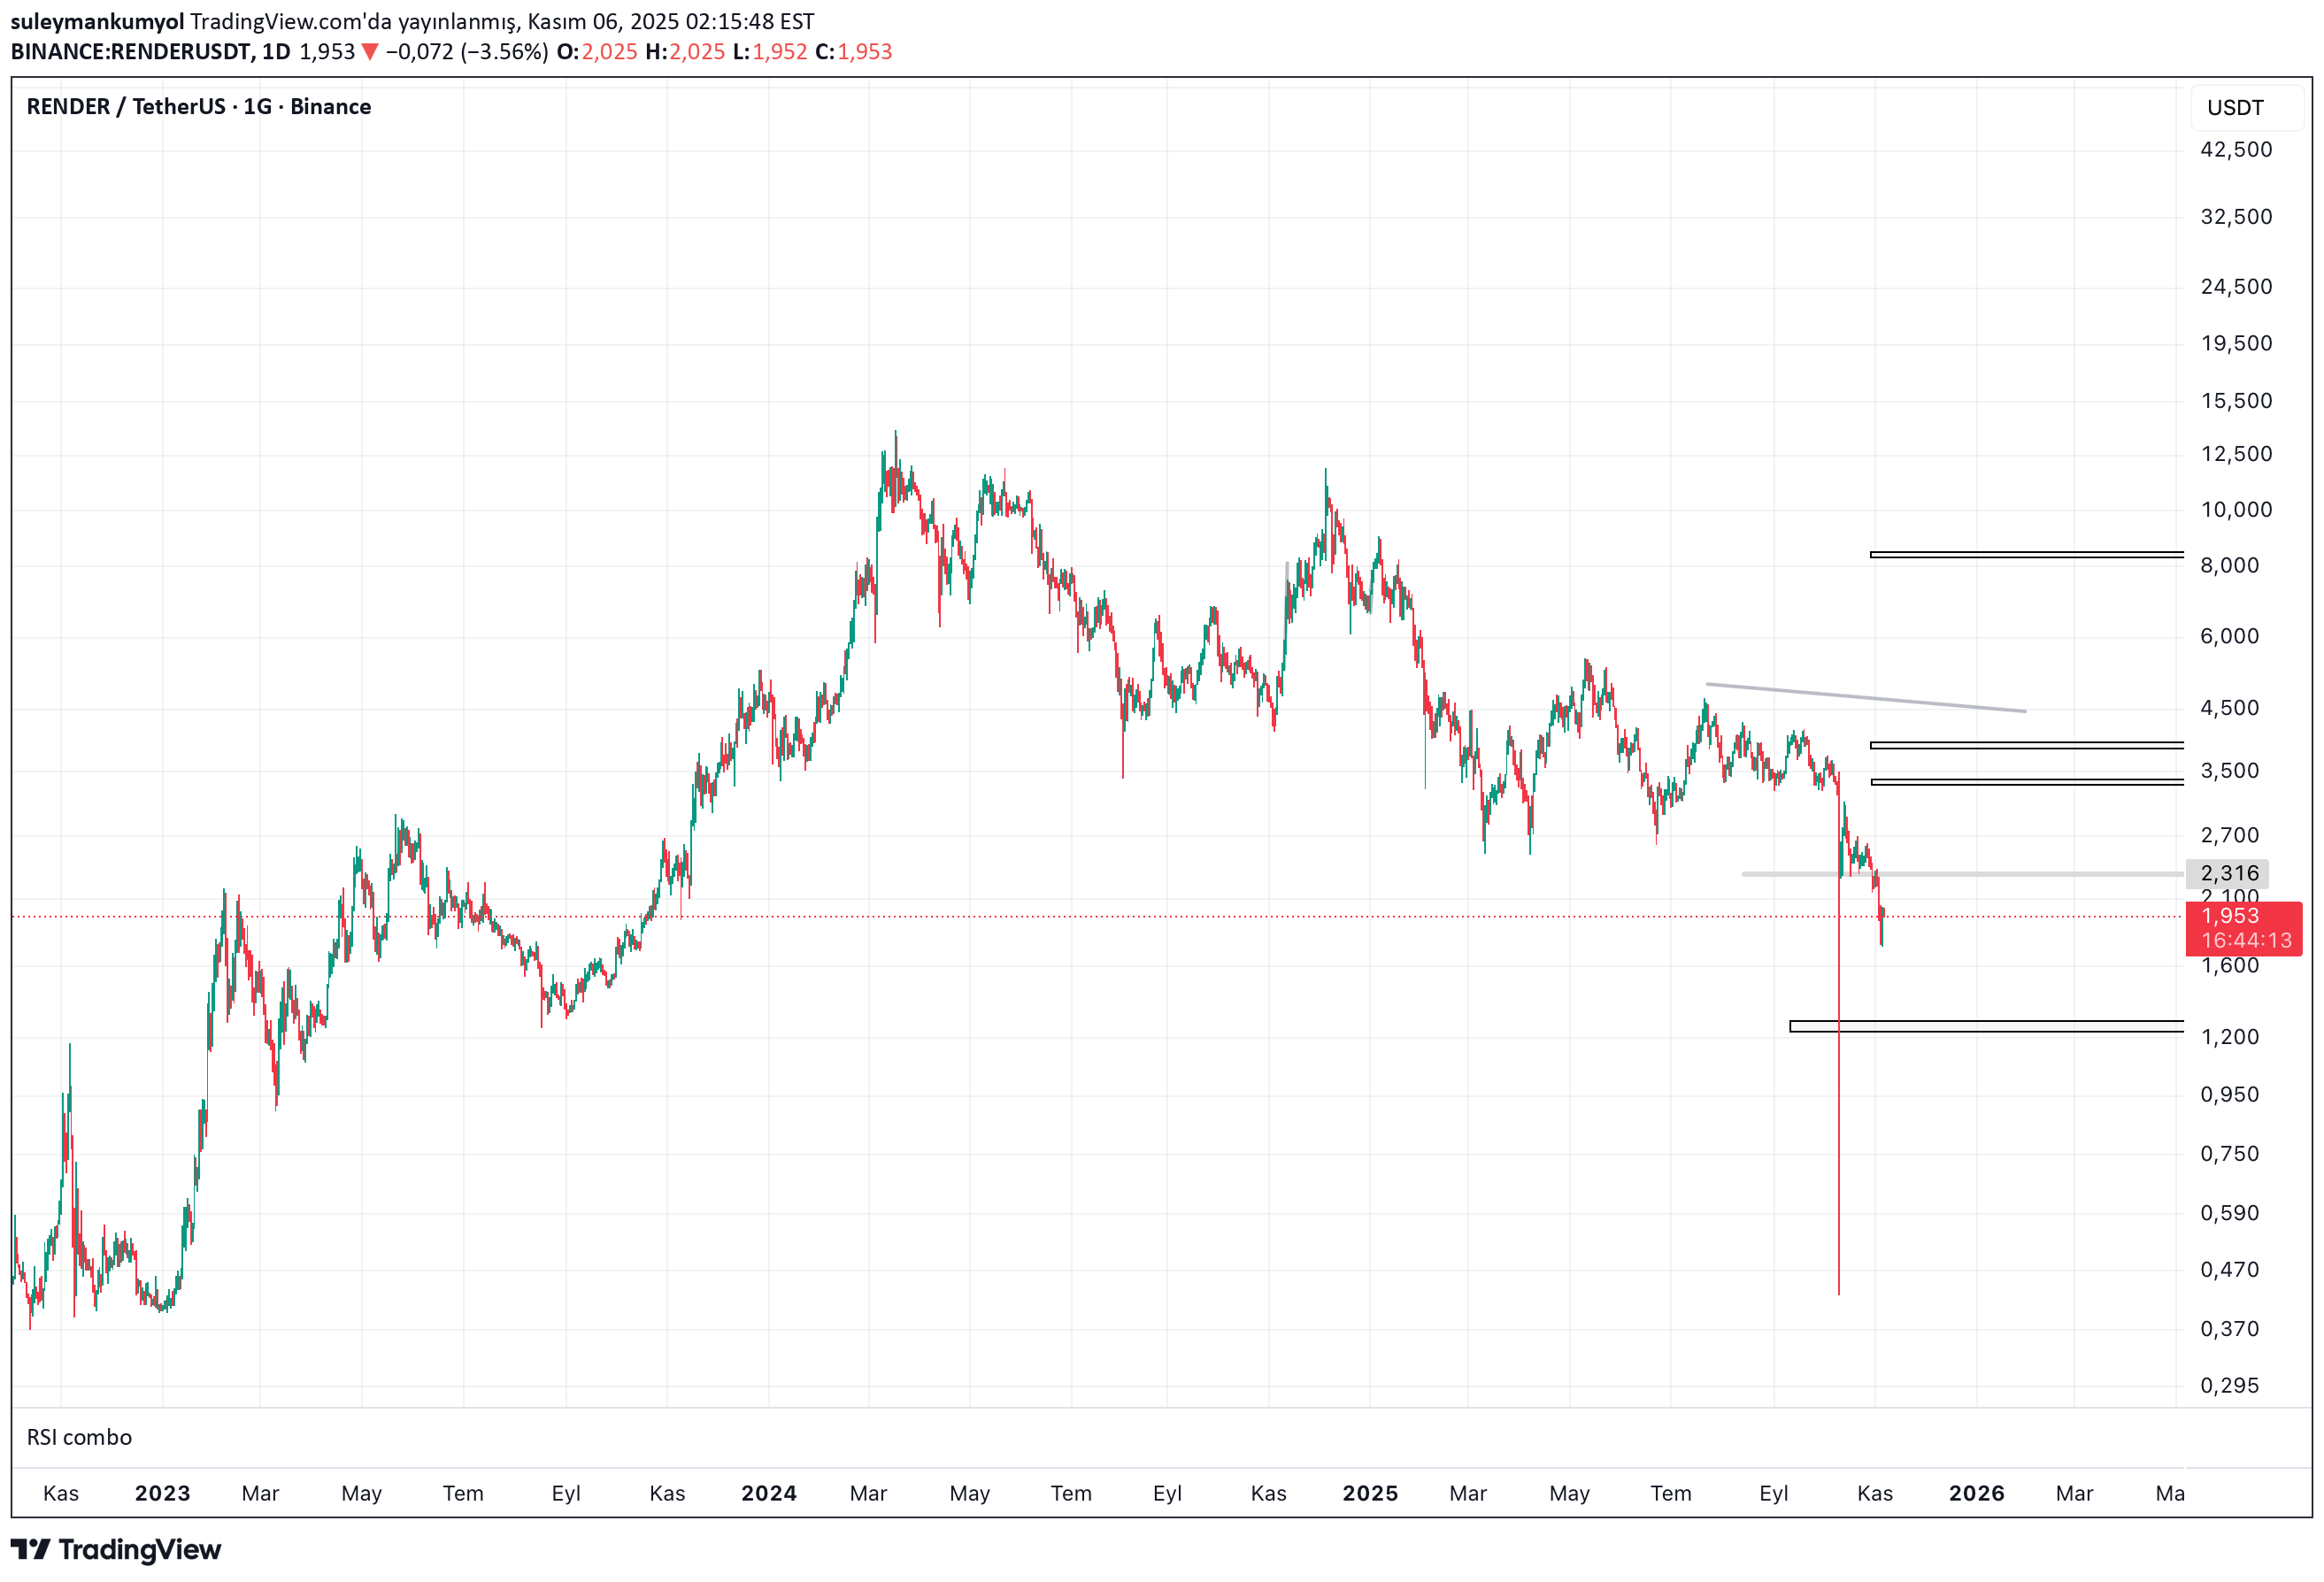
RENDERUSDT Chart Commentary Render is a coin that has provided very good profits to its investors, especially in the period until last New Year's Eve. For now, it is possible to say that it has lost its energy. However, this situation does not require pessimism because it is not independent from the general market. Since they all fell, Render also fell. If we interpret the chart, there is a bottom area in the $ 1.30 band. It may not go this far. However, it needs to rest horizontally for a bit for upward movement. Daily SMA20 is present in the $2.3 band. Sequential day closes above this level quickly send RENDERUSDT to the $3.4 band. But it is not right to wait for that momentum right now. It is necessary to follow the market when it recovers. I marked the sequential targets on the chart. When it starts to move horizontally, it will become suitable for futures transactions. I wouldn't prefer to keep it in a portfolio, but it can be traded very well. It is not investment advice. Stay away from leveraged transactions. When the market crashed, I started writing comments again. Please take a look at them all. I wish you good luck and have a good day.
Disclaimer
Any content and materials included in Sahmeto's website and official communication channels are a compilation of personal opinions and analyses and are not binding. They do not constitute any recommendation for buying, selling, entering or exiting the stock market and cryptocurrency market. Also, all news and analyses included in the website and channels are merely republished information from official and unofficial domestic and foreign sources, and it is obvious that users of the said content are responsible for following up and ensuring the authenticity and accuracy of the materials. Therefore, while disclaiming responsibility, it is declared that the responsibility for any decision-making, action, and potential profit and loss in the capital market and cryptocurrency market lies with the trader.