
RAY
Raydium
| تریدر | نوع سیگنال | حد سود/ضرر | زمان انتشار | مشاهده پیام |
|---|---|---|---|---|
No results found. | ||||
Price Chart of Raydium
سود 3 Months :
سیگنالهای Raydium
Filter
Sort messages by
Trader Type
Time Frame

Crypto-Quantum-Fox
RAY RAY 'cause one day you gonna be right'

RAY kinda fizzled after hitting stride. It certainly produced some decent gains, close to BTC or a bit more even at times. ie. if you had of timed a decent exit. Showing strength here. Trick with this one is to get out in time. Its very volatile and moves down as fast if not faster than up! With that volatility and popularity comes risk and potential reward. Does a lot of swap volume on SOL. consistently. shovels and all that. threw a few red lines on this bad boy for good measure. gl

Bithereum_io
RAYUSDT 1D
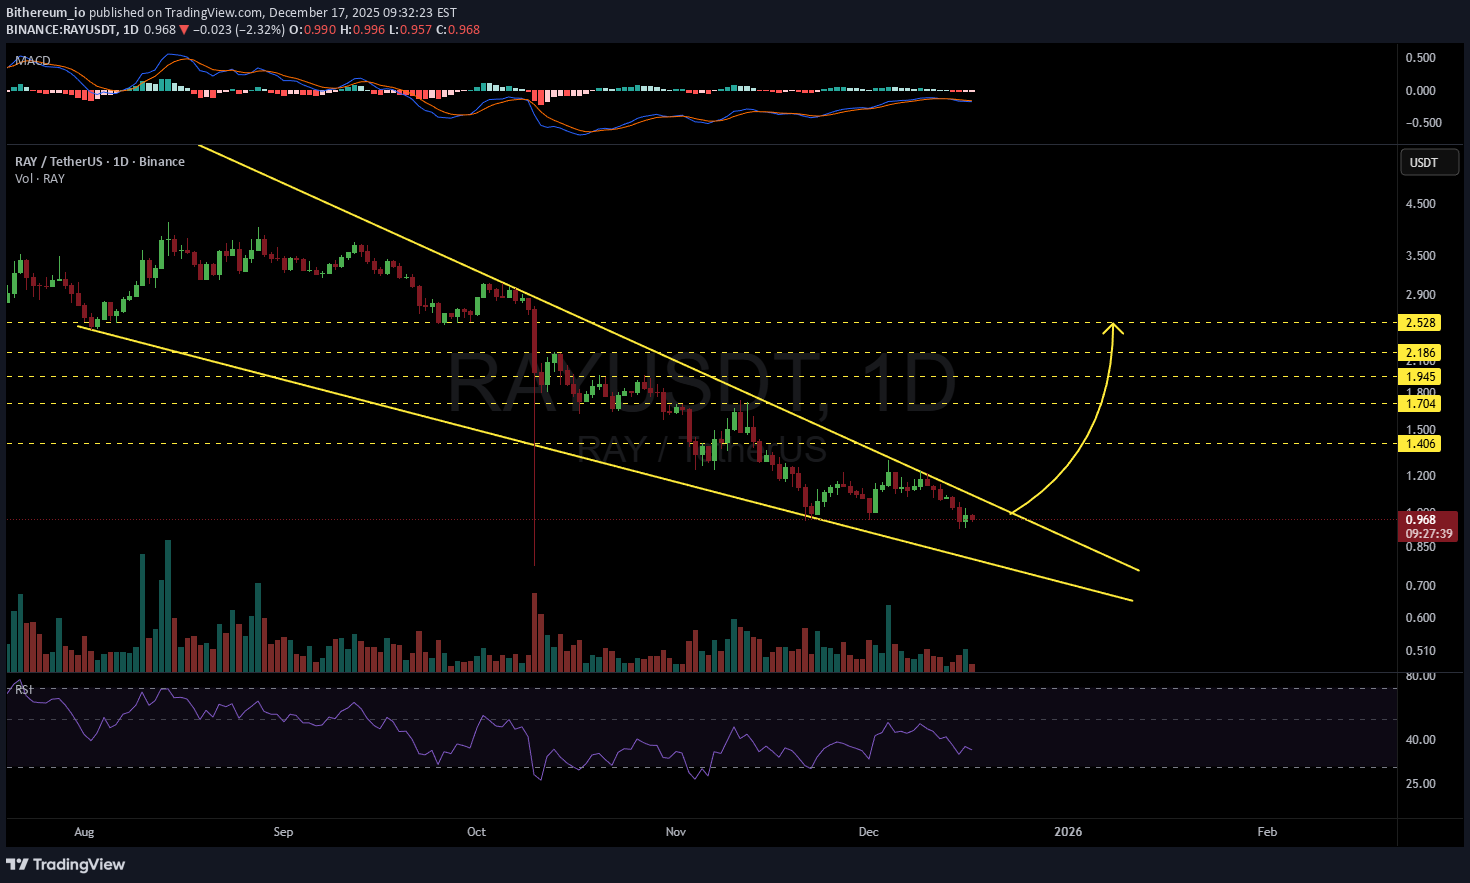
#RAY is moving inside a falling wedge pattern on the daily chart. Enter this coin only after a clean breakout above the wedge. In that case, the potential targets are: 🎯 $1.406 🎯 $1.704 🎯 $1.945 🎯 $2.186 🎯 $2.528 ⚠️ Always remember to use a tight stop-loss and maintain proper risk management.
Bithereum_io
تحلیل قوی: آیا رِی (RAY) آماده پرش بزرگ است؟ اهداف قیمتی هیجانانگیز در تایم فریم 12 ساعته!
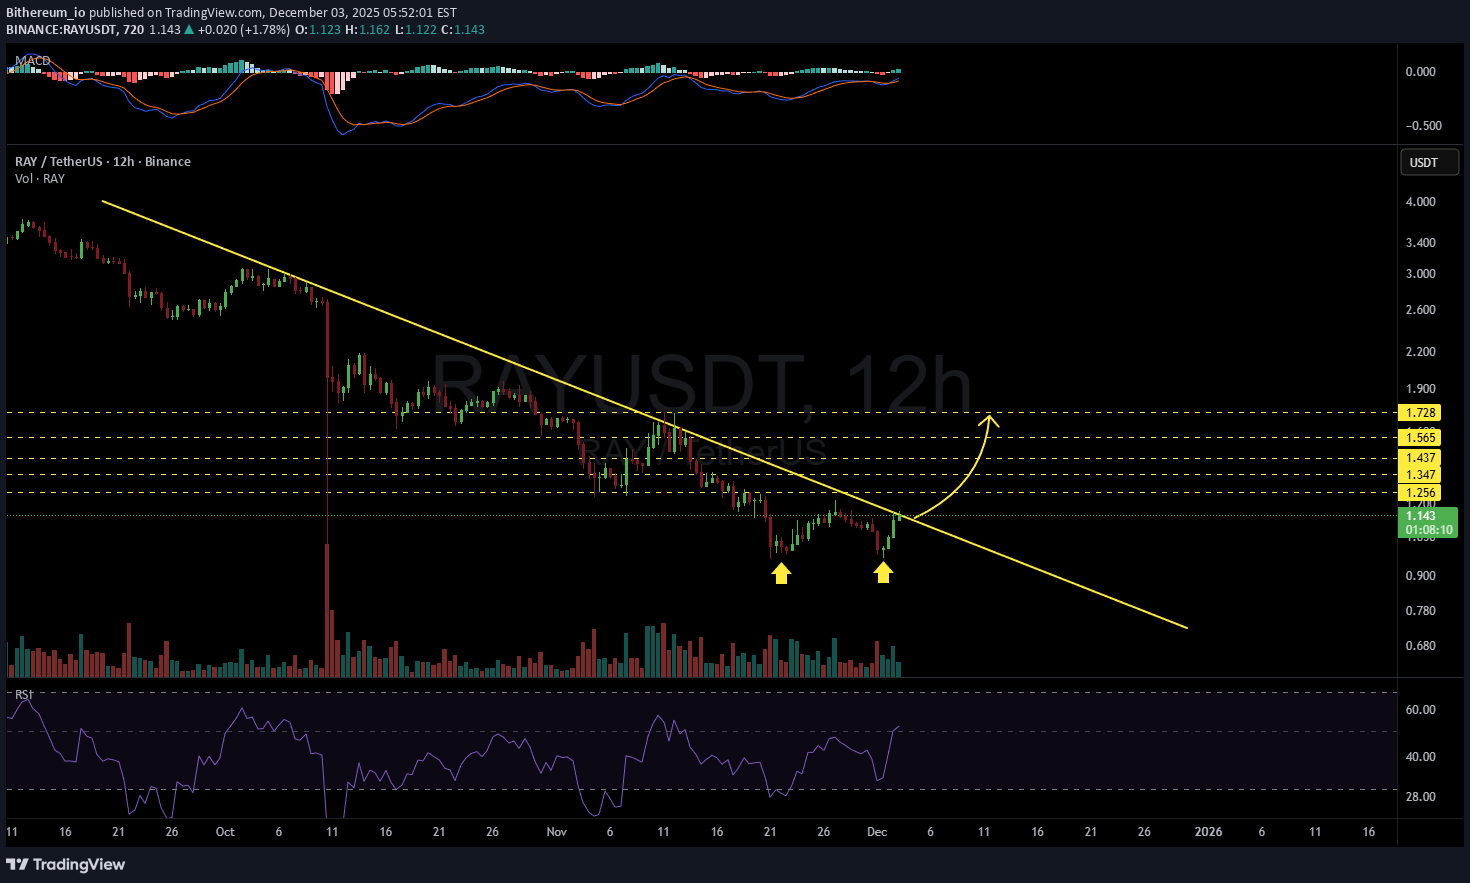
#RAY is pressing the descending resistance on the 12H chart, and it has even formed a double-bottom pattern. Both the RSI and MACD are bullish as well. With all these factors combined, the probability of breaking above the descending resistance has increased. So keep an eye on it. In case of a breakout, the targets are: 🎯 $1.256 🎯 $1.347 🎯 $1.437 🎯 $1.565 🎯 $1.728 ⚠️ Always remember to use a tight stop-loss and maintain proper risk management.

CryptoNuclear
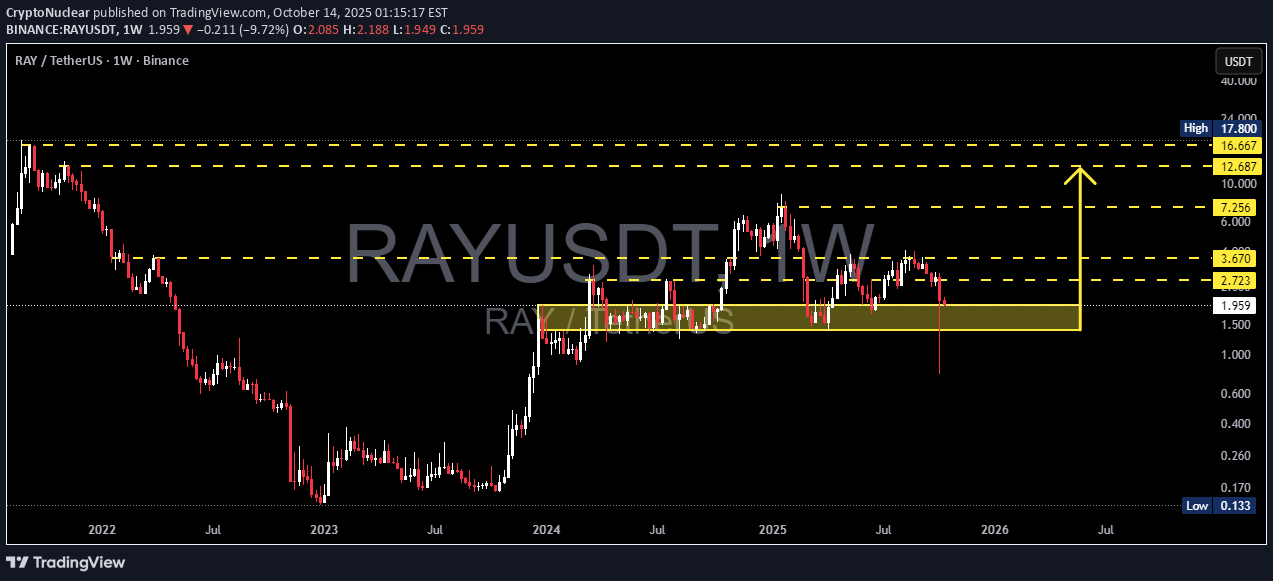
رمز ارز RAY در نقطهی سرنوشت: آیا ریزش ادامه دارد یا شروع یک رالی بزرگ است؟
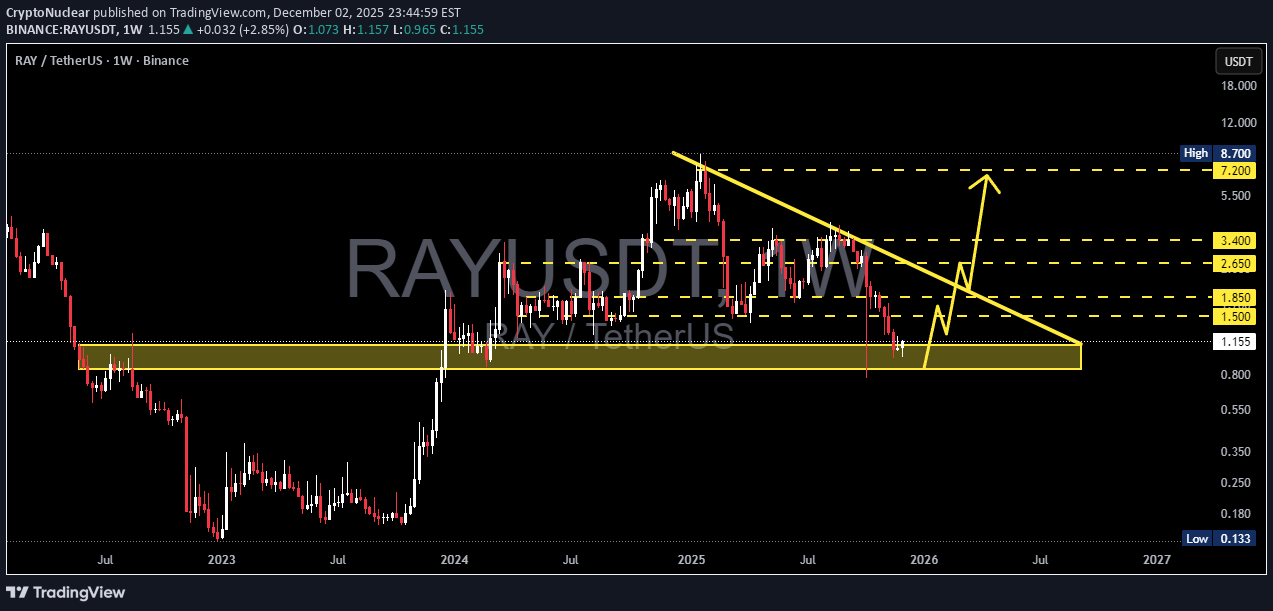
RAY has returned to the same demand zone that triggered every major rally over the past 2 years. Hold this zone = potential multi-month reversal. Lose this zone = structural breakdown.” --- Pattern & Market Structure Explanation The weekly chart of RAY/USDT is showing one of the clearest macro setups: 1. Multi-Month Descending Triangle (Strong Bearish Pressure) A clean series of lower highs forming a dominant descending trendline. This trendline has rejected every bullish attempt since mid-2024 — clear seller dominance. 2. Titanium Demand Zone: $0.85–$1.10 This zone has been the launchpad of every major RAY rally in 2022, 2023, and 2024. Every touch of this area resulted in strong upside acceleration. Price is now retesting it again… This is the most important test for RAY’s macro trend heading into 2025–2026. 3. Liquidity Sweeps Are Appearing Sharp wicks below the zone followed by rapid rejections upward. This behavior is typical before a major direction shift — markets clean liquidity first. Suggests big positions are being prepared beneath the surface. --- Bullish Scenario – If This Zone Holds, a Major Reversal Can Begin Bullish Confirmation Triggers: Weekly close back above $1.15–$1.20. Breakout above the descending trendline (major signal). Increasing buying volume during the breakout. Upside Targets: 1. $1.50 – Early resistance & first momentum checkpoint. 2. $1.85 – Trend structure recovery. 3. $2.65 – Mid-range target if momentum sustains. 4. $3.40 – Strong resistance where larger moves often stall. 5. $7.20–$8.70 – Long-term targets if a macro breakout unfolds. Bullish Narrative: If this demand zone holds, we might not be looking at a minor bounce — this could be the beginning of a fresh multi-month bullish impulse. --- Bearish Scenario – If Support Breaks, the Structure Shifts Completely Bearish Confirmation Triggers: Weekly close below $0.85. No quick reclaim on the following weekly candle. Strong selling volume on the breakdown. Downside Targets: $0.55 – First structural support. $0.35 – High liquidity area. $0.133 – Historical low (capitulation zone). Bearish Narrative: If this long-term support finally breaks, RAY enters a new phase of macro weakness. Demand is absorbed, and price enters an extended redistribution cycle. --- Core Insight: “The Last Support” The $0.85–$1.10 zone is not just a level — it is the foundation of RAY’s macro structure. At this zone: Smart money typically positions Liquidity concentrates Market sentiment is tested Breakdown = major shift in long-term trend. Hold + trendline breakout = potential start of a new bullish cycle. This is why this zone is the single most important area on RAY’s chart in the past 2 years. --- #RAY #RAYUSDT #CryptoAnalysis #CryptoOutlook #TechnicalAnalysis #DescendingTriangle #DemandZone #Altcoins #PriceAction #CryptoTrading

AndrewsMarket-Mastery
آینده RAY/USDT: رمزگشایی از الگوی گوه نزولی و فرصت انفجار قیمت!

RAY/USDT looks like it’s entering a pivotal phase right now. Technically, the price has been consolidating after a corrective pull-back, and what I’m watching is whether RAY can break above its recent consolidation high with volume supporting the move. The project sits within a high-visibility niche—decentralized exchange infrastructure on the Solana chain—where AMM + order book, deep liquidity, and protocol buy-backs are high-search keywords. On the fundamentals, RAY is benefiting from renewed interest thanks to increased token staking, reduced circulating supply via buy-backs, and a strong ecosystem growth posture. From a strategic viewpoint, a clean breakout above resistance and confirmation with volume would be the trigger for me. If RAY closes above resistance and holds it, the next move could carry upside momentum. The reward potential looks favorable given the combination of structural base plus thematic strength in the Solana-DeFi space. Risk control is essential, so placing a stop just below the recent consolidation low or major support would allow a defined risk-to-reward. Fundamentally, the token maps into current crypto market themes that are heavily trafficked: DEX dominance, Solana ecosystem expansion, tokenomics with buy-back, and staking rewards. Investors appear to be increasingly interested again, as on-chain metrics and trading volume suggest increased engagement. That alignment between narrative and structure adds weight to the bullish thesis.
Bithereum_io
خرید رِی (RAY) در کف مثلث نزولی: فرصتهای طلایی و اهداف قیمتی هیجانانگیز!
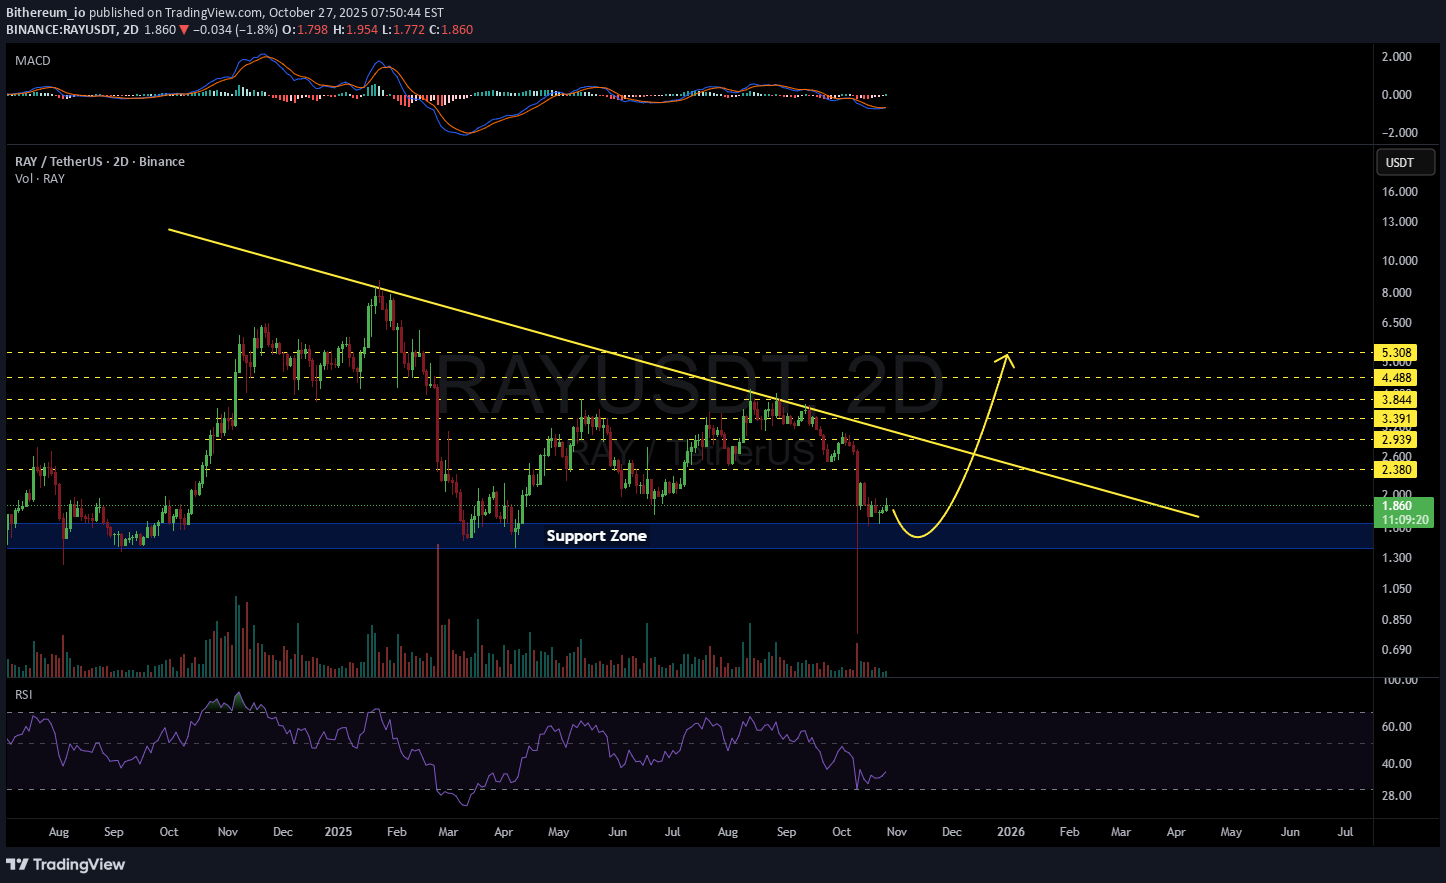
#RAY is moving inside a descending triangle on the 2-day chart. Consider buying here and on the support zone. In case of a bounce, the potential targets are: 🎯 $2.380 🎯 $2.939 🎯 $3.391 🎯 $3.844 🎯 $4.488 🎯 $5.308 ⚠️ Always remember to use a tight stop-loss and maintain proper risk management.

سولانا کجا میرود؟ گام بعدی چه خواهد بود؟
Could this be his next move? I can't wait.
CryptoNuclear
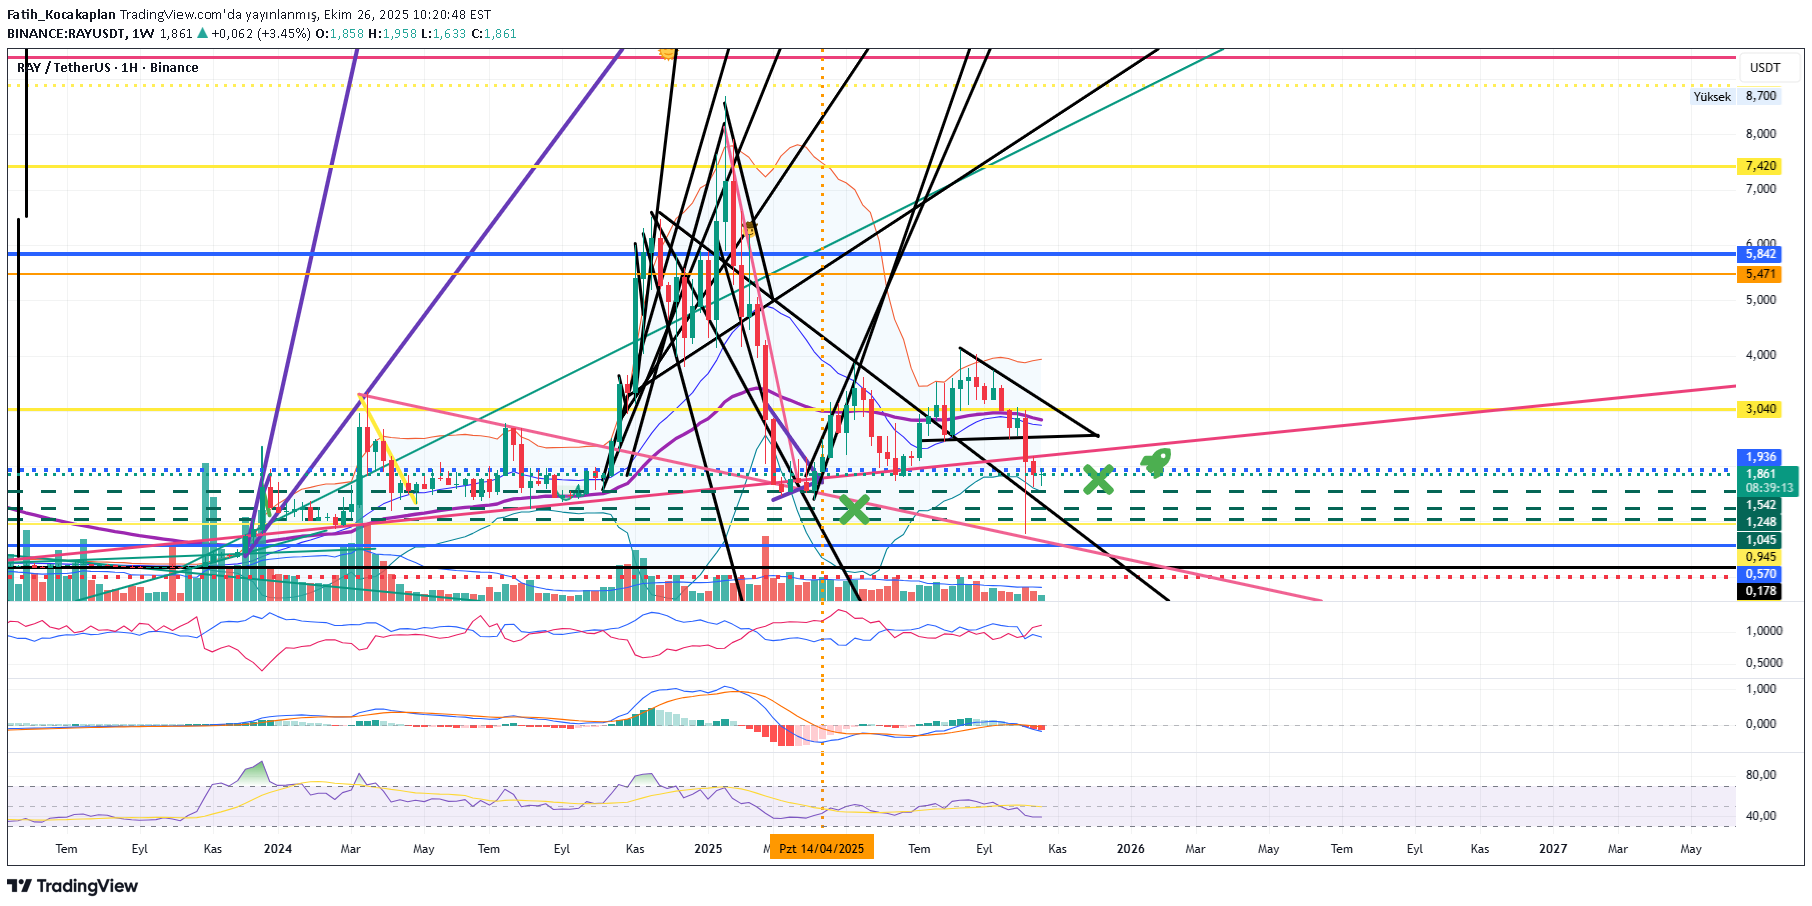
آینده رِی (RAY/USDT): آیا زمان انباشت فرا رسیده یا سقوط به کفهای جدید؟
RAY is currently sitting at one of the most crucial structural zones, around the major support area of $1.50 – $1.96 (yellow box). This area has acted as a key price pivot since mid-2024, where buyers and sellers have continuously battled for control. After a sharp correction from the 2025 peak, price managed to hold above the main demand zone, with a long downside wick signaling liquidation or stop-hunt followed by immediate buying pressure. This kind of reaction often represents a potential spring phase before a major trend reversal — if confirmed by a strong weekly close above support. --- Structure & Pattern Analysis Range Base / Accumulation Zone: The yellow block ($1.5 – $1.96) acts as a potential accumulation base, resembling a Wyckoff Accumulation pattern, where the spring phase (wick below support) might have just occurred. Lower High Structure: The current structure still shows lower highs, but a confirmed higher low above $1.9 could signal a major trend reversal. Key Resistance Levels: 2.72 – 3.67 – 7.25 – 12.68 – 16.66 – 17.80 → These are progressive resistance targets for any mid-term bullish move. --- Bullish Scenario If RAY manages to close the weekly candle above $1.96 and hold, it would confirm: A reclaim of the major demand zone. Validation of the Wyckoff spring phase (accumulation completed). The beginning of a mid-term trend reversal toward higher targets. Bullish Targets: 1️⃣ $2.72 → First resistance / breakout trigger. 2️⃣ $3.67 → Range breakout confirmation. 3️⃣ $7.25 → Mid-term target zone (previous supply level). A breakout with strong volume above $3.67 would likely trigger a larger markup phase, indicating the start of a new bullish cycle. --- Bearish Scenario If price fails to hold and closes weekly below $1.50, it would mean: The main structural support has broken down. Selling pressure could intensify toward $1.00 – $0.60. In an extreme case, price might revisit its historical liquidity zone around $0.13. Bearish Confirmation Signs: Weekly close < $1.50. Consecutive lower closes without recovery. High-volume red candle (true capitulation, not just a sweep). --- Technical Summary RAY is standing at a macro decision zone — every upcoming weekly close will define whether: The market is building a new base for the next bullish cycle, or Entering a continued bearish leg toward historical lows. The area between $1.5–$1.9 is the “make or break zone.” As long as the price doesn’t close below it, the mid-term bullish structure remains valid. --- Trading Notes Strong rejection candles within support = potential swing-buy opportunities (tight SL below wick). Breakout above 2.72 with strong volume = confirmation for mid-term re-entry. Be cautious of fakeouts — always wait for weekly candle closes before confirming bias. --- #RAYUSDT #Raydium #CryptoAnalysis #WeeklyChart #MarketStructure #CryptoTechnical #SwingTrade #Wyckoff #DeFi #SupportZone #PriceAction #TrendReversal #AltcoinSetup #TradingViewAnalysis

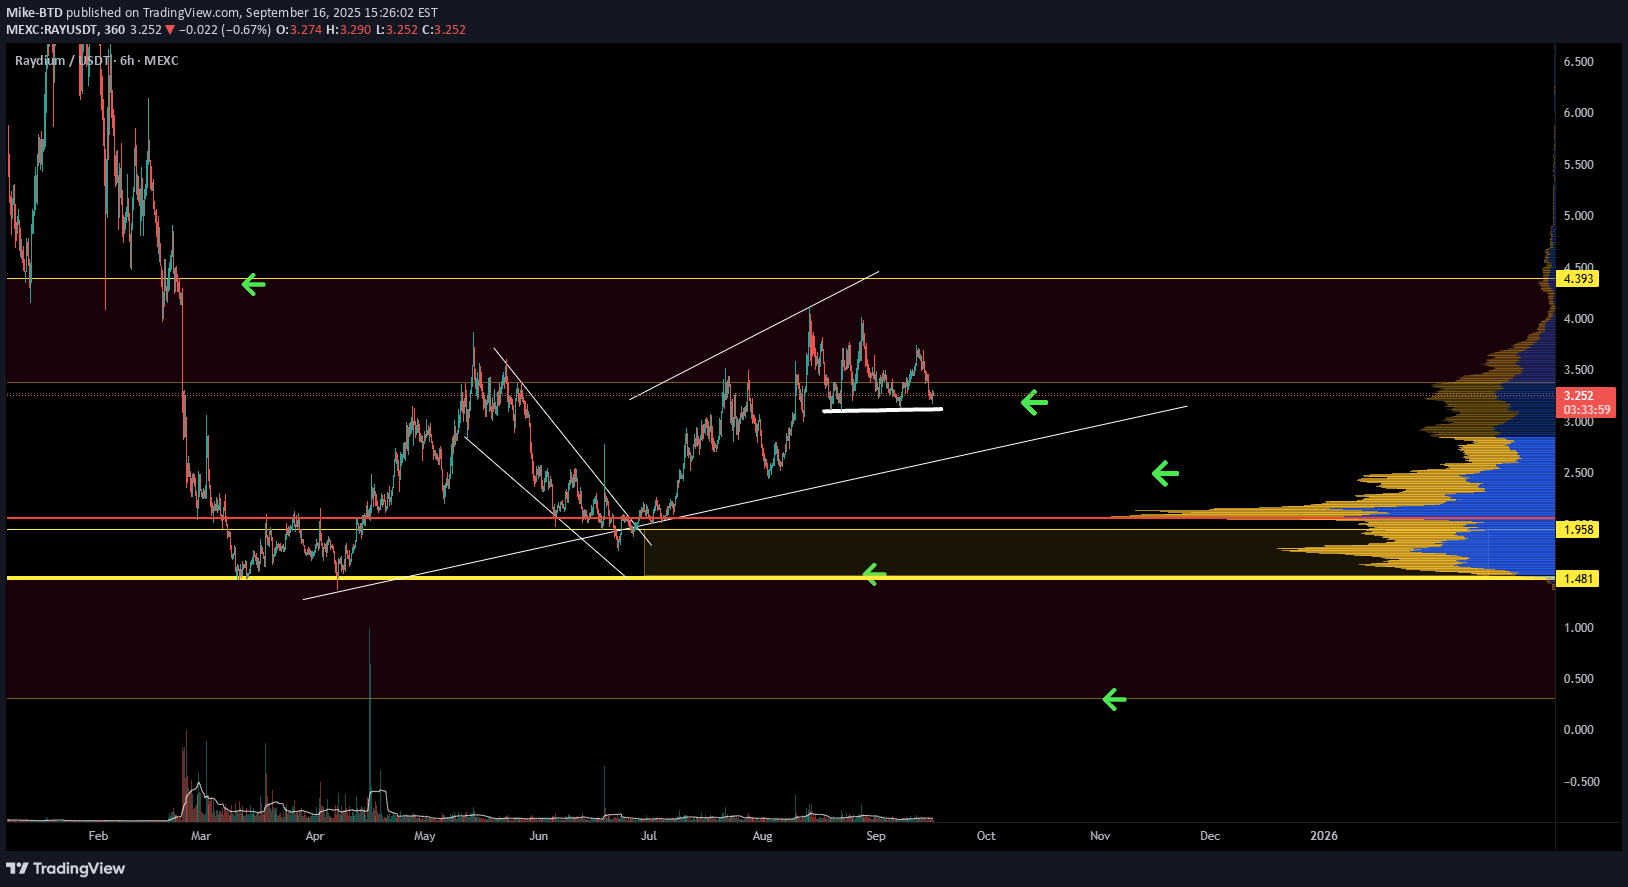
Mike-BTD

CryptoWithJames
RAYUSDT UPDATE
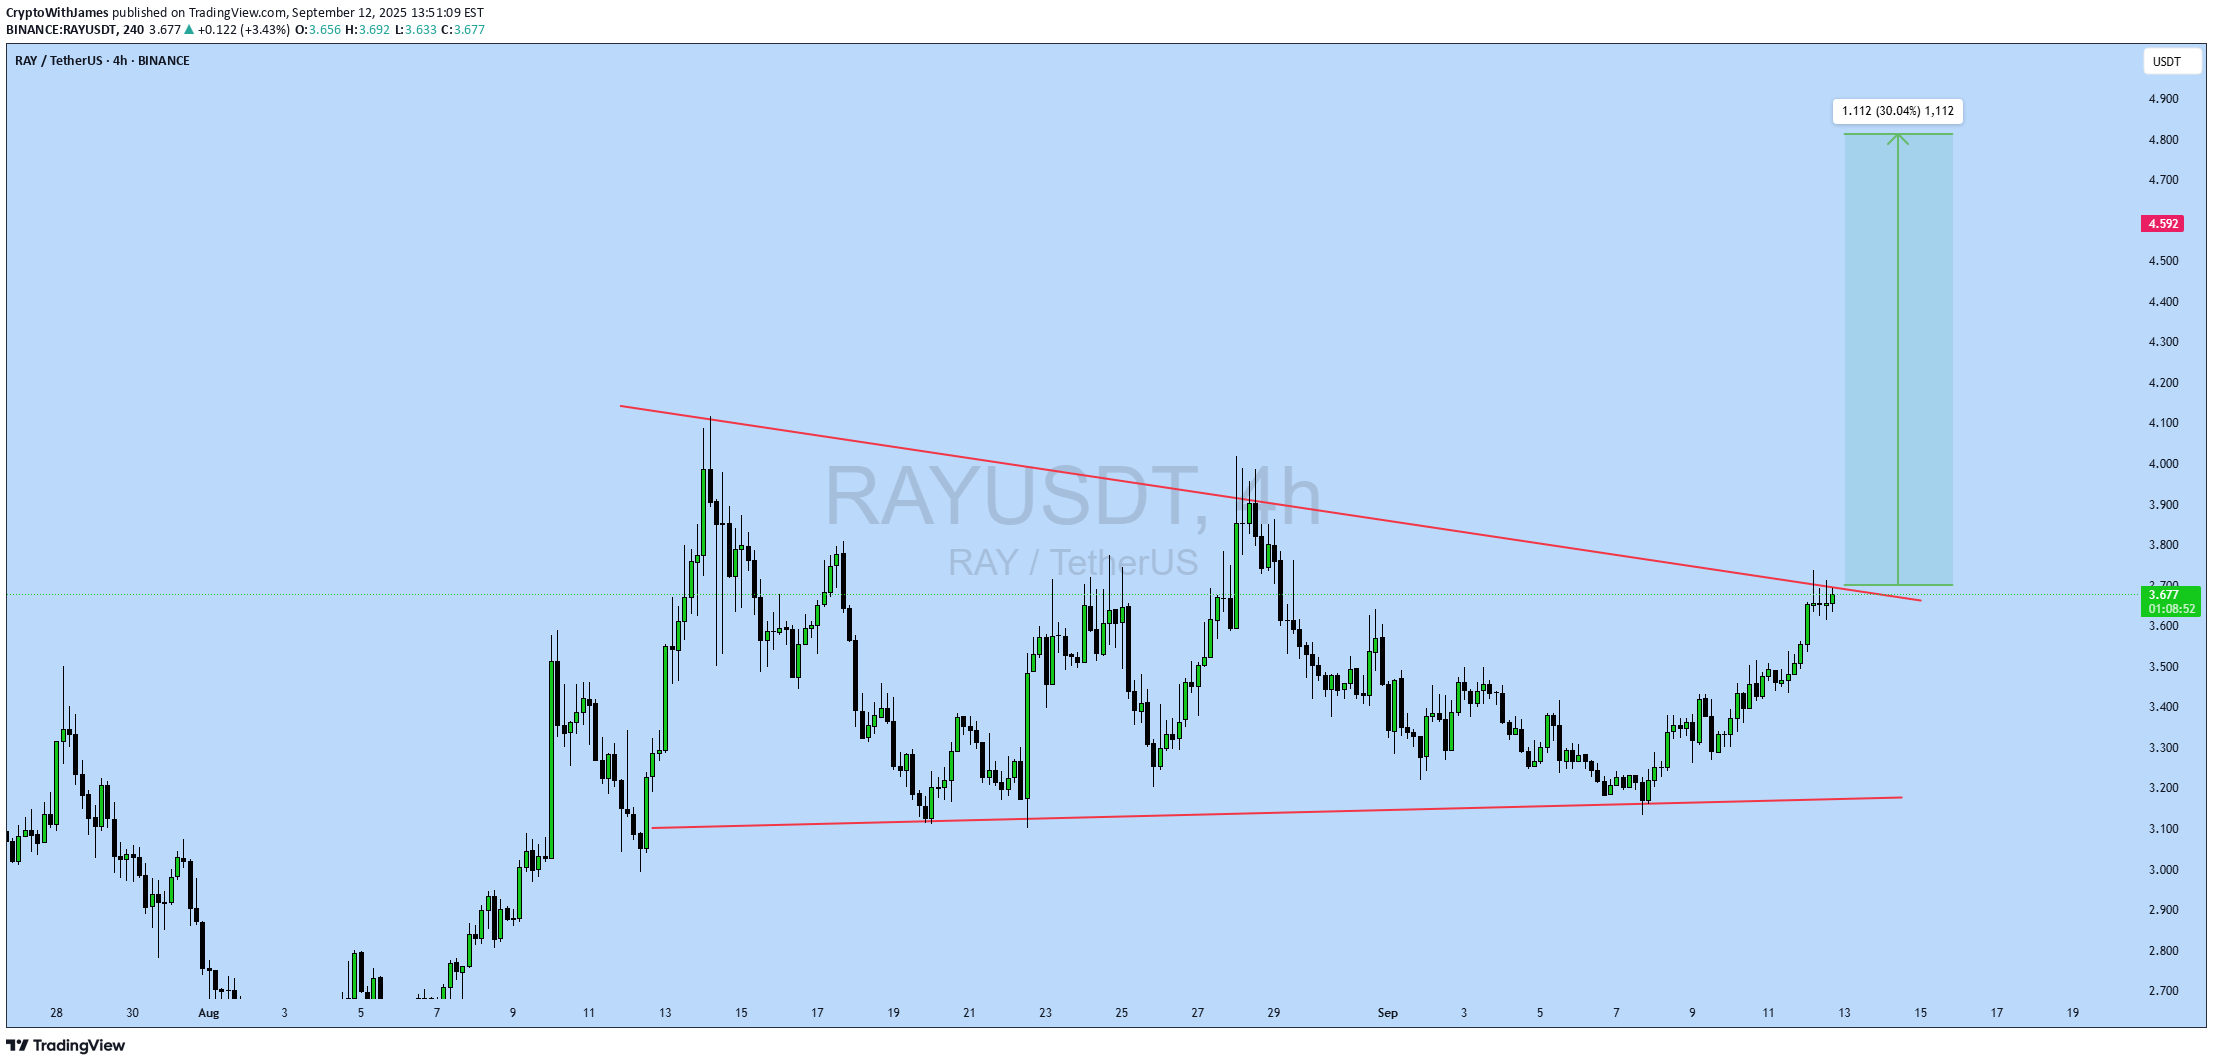
#RAY UPDATE RAY Technical Setup Pattern : Bullish Falling Wedge Breakout Current Price: $3.68 Target Price: $4.59 Target % Gain: 30.04% Technical Analysis: RAY has broken its falling wedge resistance on the 4H chart, showing bullish momentum and continuation potential. The breakout is backed by higher lows, rising volume, and a strong push above the trendline, with upside projection toward $4.59. Time Frame: 4H Risk Management Tip: Always use proper risk management.
Disclaimer
Any content and materials included in Sahmeto's website and official communication channels are a compilation of personal opinions and analyses and are not binding. They do not constitute any recommendation for buying, selling, entering or exiting the stock market and cryptocurrency market. Also, all news and analyses included in the website and channels are merely republished information from official and unofficial domestic and foreign sources, and it is obvious that users of the said content are responsible for following up and ensuring the authenticity and accuracy of the materials. Therefore, while disclaiming responsibility, it is declared that the responsibility for any decision-making, action, and potential profit and loss in the capital market and cryptocurrency market lies with the trader.