Technical analysis by CryptoNuclear about Symbol RAY: Buy recommendation (12/3/2025)

CryptoNuclear
رمز ارز RAY در نقطهی سرنوشت: آیا ریزش ادامه دارد یا شروع یک رالی بزرگ است؟
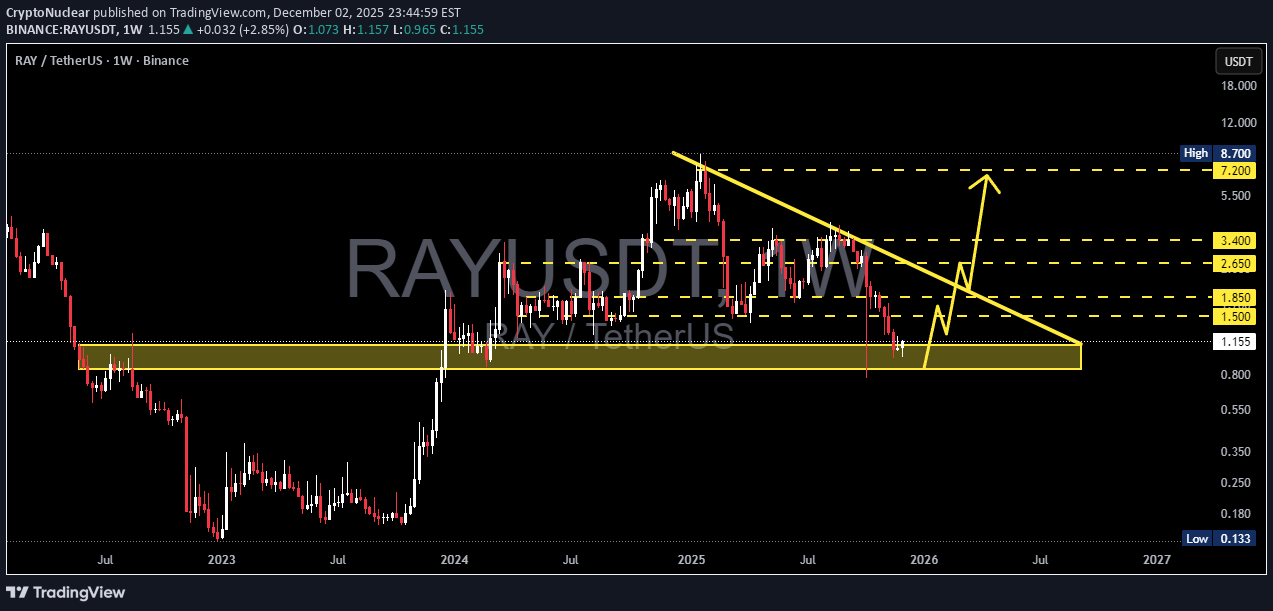
RAY has returned to the same demand zone that triggered every major rally over the past 2 years. Hold this zone = potential multi-month reversal. Lose this zone = structural breakdown.” --- Pattern & Market Structure Explanation The weekly chart of RAY/USDT is showing one of the clearest macro setups: 1. Multi-Month Descending Triangle (Strong Bearish Pressure) A clean series of lower highs forming a dominant descending trendline. This trendline has rejected every bullish attempt since mid-2024 — clear seller dominance. 2. Titanium Demand Zone: $0.85–$1.10 This zone has been the launchpad of every major RAY rally in 2022, 2023, and 2024. Every touch of this area resulted in strong upside acceleration. Price is now retesting it again… This is the most important test for RAY’s macro trend heading into 2025–2026. 3. Liquidity Sweeps Are Appearing Sharp wicks below the zone followed by rapid rejections upward. This behavior is typical before a major direction shift — markets clean liquidity first. Suggests big positions are being prepared beneath the surface. --- Bullish Scenario – If This Zone Holds, a Major Reversal Can Begin Bullish Confirmation Triggers: Weekly close back above $1.15–$1.20. Breakout above the descending trendline (major signal). Increasing buying volume during the breakout. Upside Targets: 1. $1.50 – Early resistance & first momentum checkpoint. 2. $1.85 – Trend structure recovery. 3. $2.65 – Mid-range target if momentum sustains. 4. $3.40 – Strong resistance where larger moves often stall. 5. $7.20–$8.70 – Long-term targets if a macro breakout unfolds. Bullish Narrative: If this demand zone holds, we might not be looking at a minor bounce — this could be the beginning of a fresh multi-month bullish impulse. --- Bearish Scenario – If Support Breaks, the Structure Shifts Completely Bearish Confirmation Triggers: Weekly close below $0.85. No quick reclaim on the following weekly candle. Strong selling volume on the breakdown. Downside Targets: $0.55 – First structural support. $0.35 – High liquidity area. $0.133 – Historical low (capitulation zone). Bearish Narrative: If this long-term support finally breaks, RAY enters a new phase of macro weakness. Demand is absorbed, and price enters an extended redistribution cycle. --- Core Insight: “The Last Support” The $0.85–$1.10 zone is not just a level — it is the foundation of RAY’s macro structure. At this zone: Smart money typically positions Liquidity concentrates Market sentiment is tested Breakdown = major shift in long-term trend. Hold + trendline breakout = potential start of a new bullish cycle. This is why this zone is the single most important area on RAY’s chart in the past 2 years. --- #RAY #RAYUSDT #CryptoAnalysis #CryptoOutlook #TechnicalAnalysis #DescendingTriangle #DemandZone #Altcoins #PriceAction #CryptoTrading