
PUNDIX
Pundi X[new]
| تریدر | نوع سیگنال | حد سود/ضرر | زمان انتشار | مشاهده پیام |
|---|---|---|---|---|
No results found. | ||||
Price Chart of Pundi X[new]
سود 3 Months :
سیگنالهای Pundi X[new]
Filter
Sort messages by
Trader Type
Time Frame

Alpha-GoldFX
موج صعودی PUNDIXUSDT: آماده جهش 40 درصدی با این سیگنال قوی!
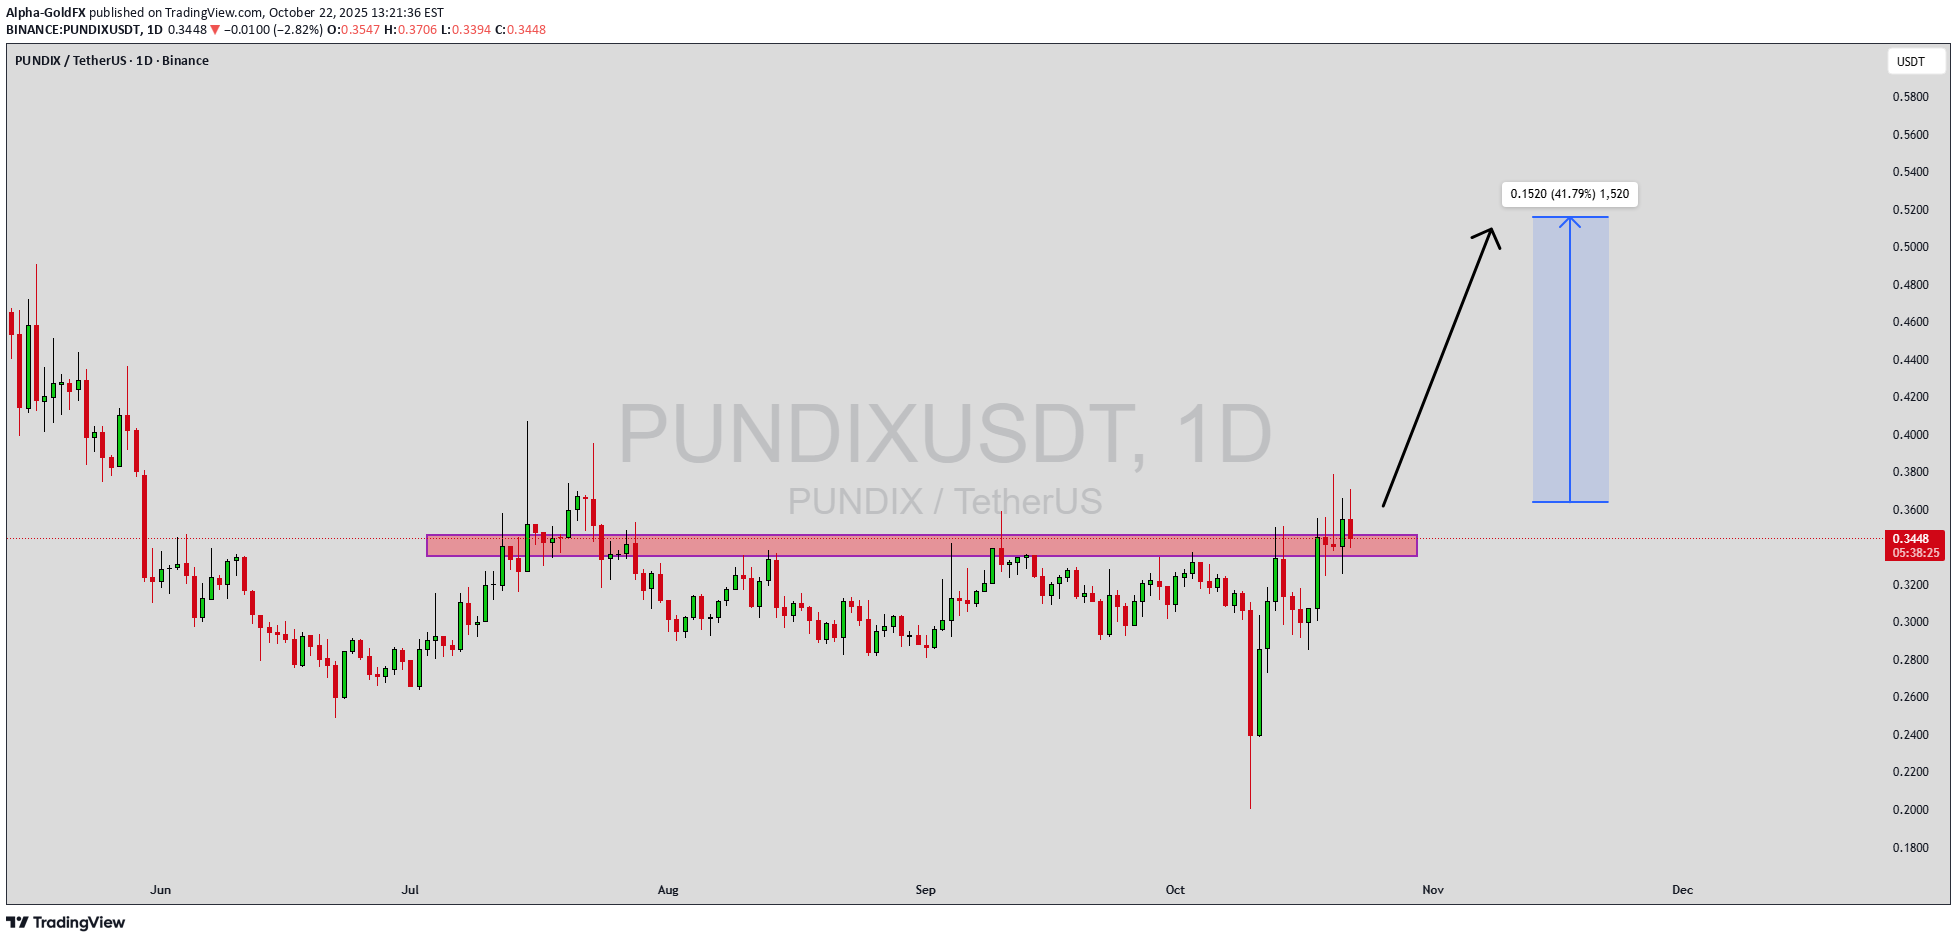
PUNDIXUSDT is displaying a bullish wave pattern, signaling a strong upward continuation phase supported by improving market sentiment. This formation suggests that the coin has successfully completed its accumulation stage and is preparing for a potential surge. The good volume confirms increasing buying pressure, with investors and traders actively positioning themselves in anticipation of a trend expansion. Such bullish wave formations typically indicate healthy momentum and a sustainable rise in price over the coming sessions. With an expected gain of 30% to 40%+, PUNDIXUSDT shows promising upside potential as it rides on this bullish structure. The market appears to be regaining confidence, with traders closely watching for breakouts above key resistance zones. A steady increase in demand and strong participation from buyers may drive the next leg of the rally, potentially pushing the price toward new short-term highs if current momentum persists. Investor interest in PUNDIXUSDT continues to grow as the project gains more traction within the crypto ecosystem. Its steady price structure and supportive technical setup create an ideal environment for bullish traders to capitalize on upcoming moves. If the bullish wave pattern continues to develop as expected, we may see a sustained upward rally supported by solid technical strength and increasing liquidity. ✅ Show your support by hitting the like button and ✅ Leaving a comment below! (What is You opinion about this Coin) Your feedback and engagement keep me inspired to share more insightful market analysis with you!

Bithereum_io
خرید پاندیکس (PUNDIX) زیر حمایت ۰.۳۲۲۶ دلار: اهداف بزرگ سقف کانال!
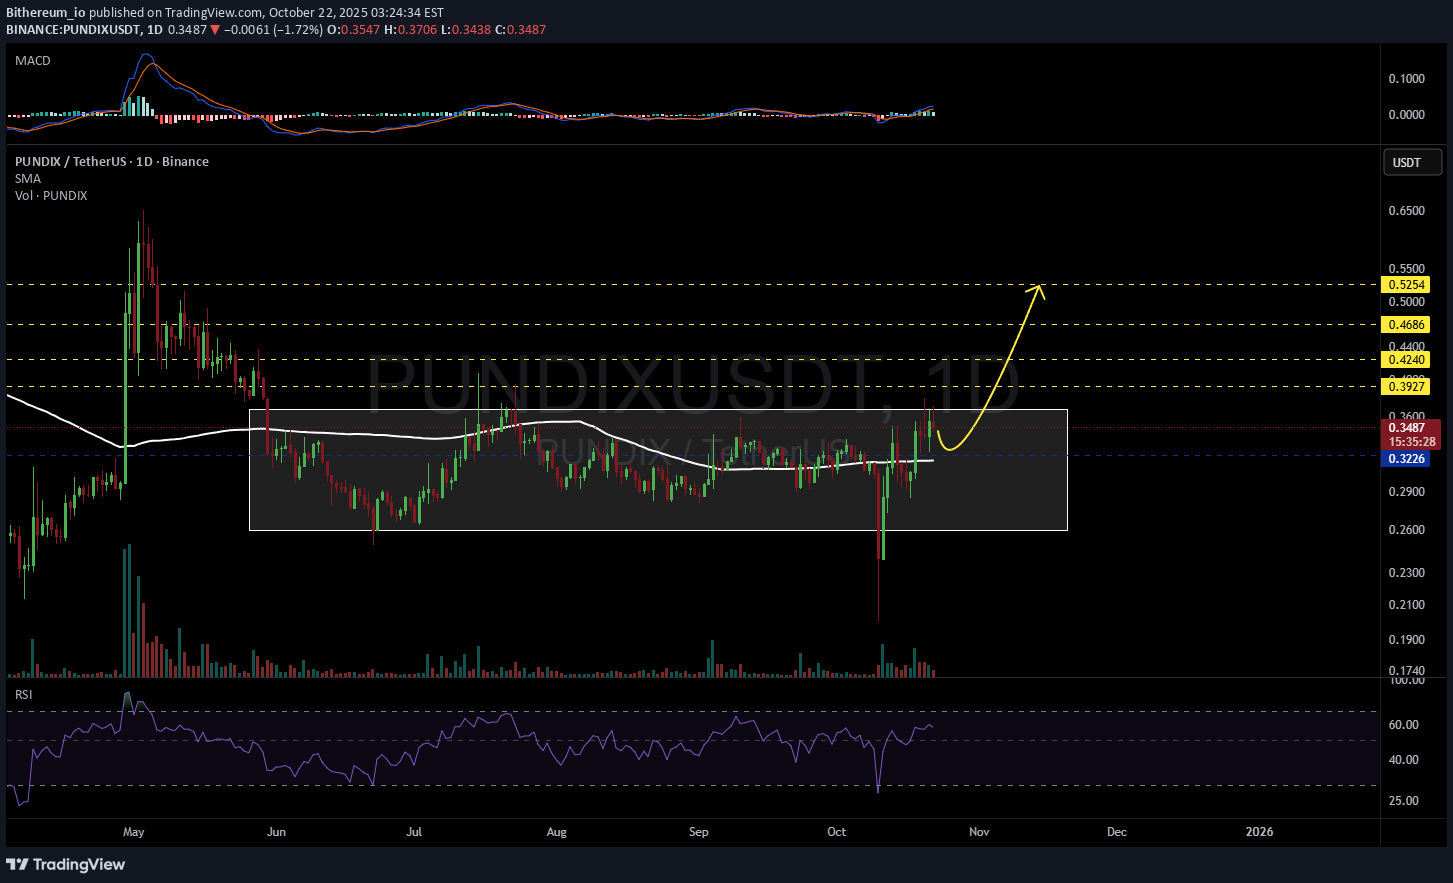
#PUNDIX is accumulating within a range on the daily chart. Consider buying here or near the support level at $0.3226, which aligns with the daily SMA100. In case of a breakout above the range, the potential targets are: 🎯 $0.3927 🎯 $0.4240 🎯 $0.4686 🎯 $0.5254 ⚠️ Always remember to use a tight stop-loss and maintain proper risk management.
Bithereum_io
PUNDIXUSDT 1D

#PUNDIX is moving inside a symmetrical triangle pattern on the daily chart. Enter this coin after a clean breakout above the triangle resistance and the daily EMA100. In this case, the potential targets are: 🎯 $0.3379 🎯 $0.3861 🎯 $0.4251 🎯 $0.4640 🎯 $0.5195 🎯 $0.5901 ⚠️ Always remember to use a tight stop-loss and follow proper risk management.

MasterAnanda
PundiX: Focus on the Win
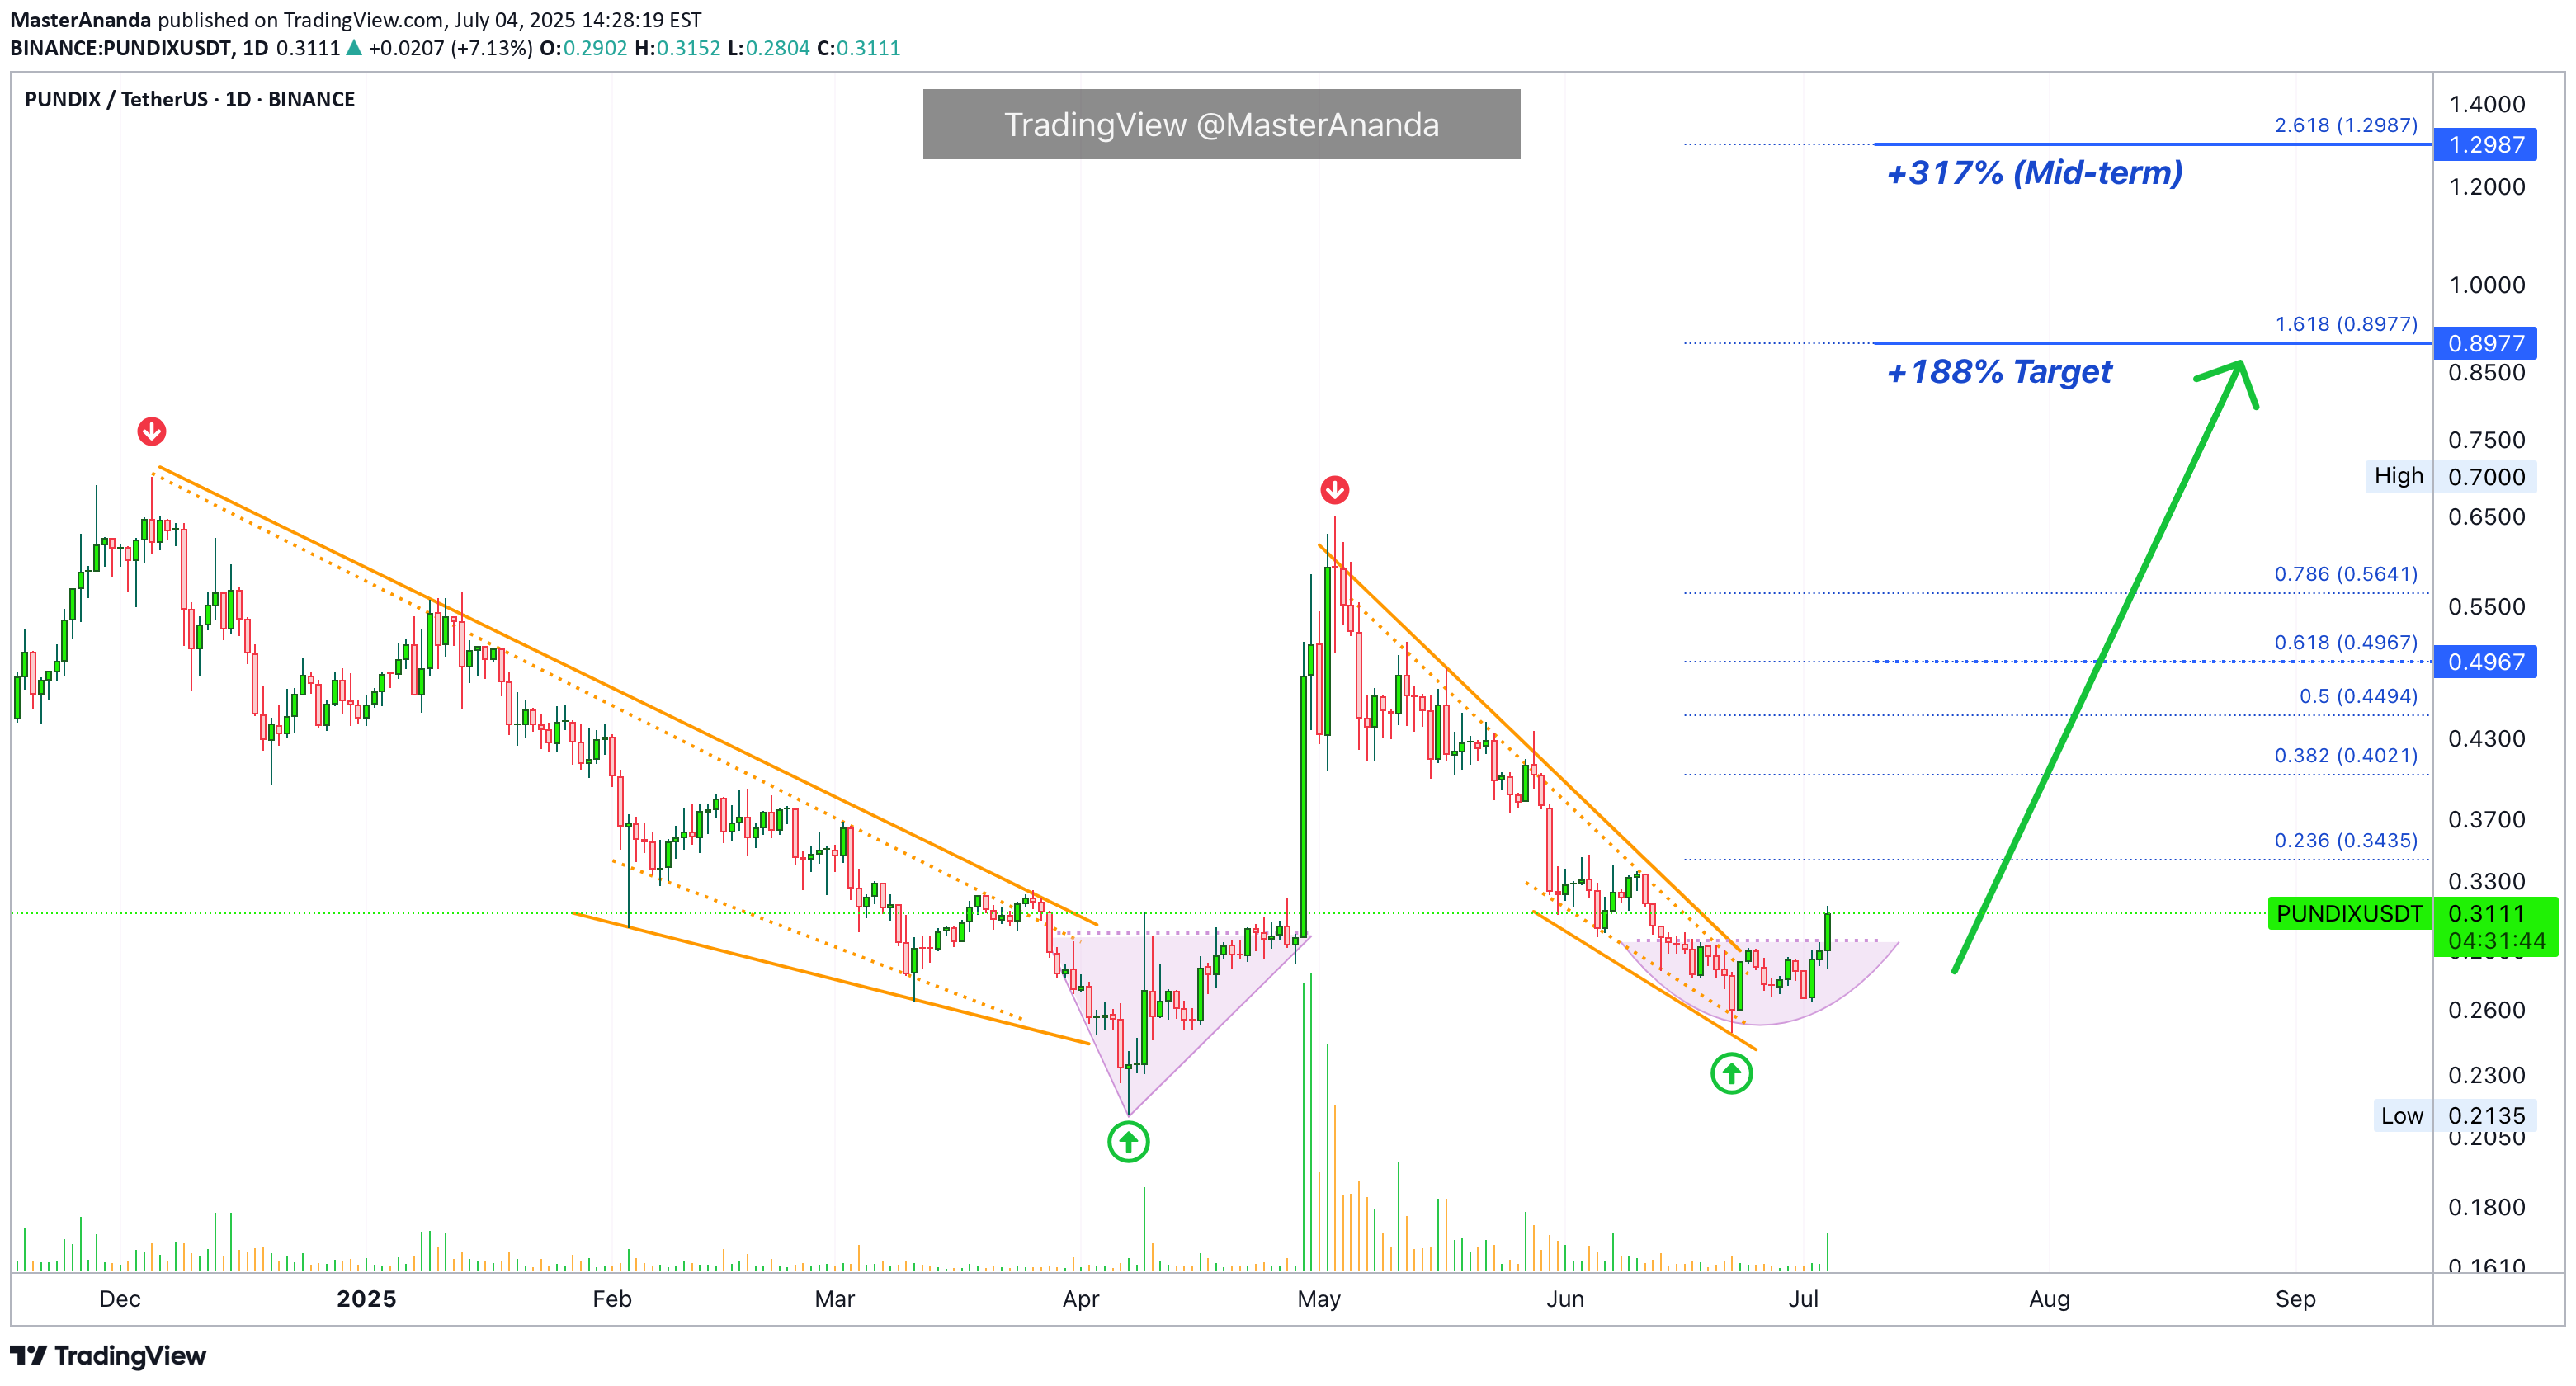
If you had to choose between a pair that is dropping or set to drop vs one that is rising or set to rise, which one would you choose?Looking at the chart, the red arrow shows a peak and subsequent drop; the green arrow shows a bottom. The bottom is followed by a rise.PUNDIXUSDT is now trading within a higher low and producing a bullish breakout supported by rising volume. Trading volume today is many times the daily average in the past month. These are simple signals; bullish confirmed, a new bullish wave with a nice 188% target short-term and beyond.Happy 4th of July USA.Thanks a lot for your continued support.Namaste.

UmutTrades
PUNDIXUSDT | Early Buyers Showing Up

Buyers might be waking up on PUNDIXUSDT, it’s not confirmed strength yet, but the signs are there.Those looking for a tight-stop trade can wait for lower levels and attempt a quick long.But for spot entries, waiting may not be necessary. Current price isn't ideal, but it’s not unreasonable either if momentum builds.Be early, not reckless.📌I keep my charts clean and simple because I believe clarity leads to better decisions.📌My approach is built on years of experience and a solid track record. I don’t claim to know it all but I’m confident in my ability to spot high-probability setups.📌If you would like to learn how to use the heatmap, cumulative volume delta and volume footprint techniques that I use below to determine very accurate demand regions, you can send me a private message. I help anyone who wants it completely free of charge.🔑I have a long list of my proven technique below:🎯 ZENUSDT.P: Patience & Profitability | %230 Reaction from the Sniper Entry🐶 DOGEUSDT.P: Next Move🎨 RENDERUSDT.P: Opportunity of the Month💎 ETHUSDT.P: Where to Retrace🟢 BNBUSDT.P: Potential Surge📊 BTC Dominance: Reaction Zone🌊 WAVESUSDT.P: Demand Zone Potential🟣 UNIUSDT.P: Long-Term Trade🔵 XRPUSDT.P: Entry Zones🔗 LINKUSDT.P: Follow The River📈 BTCUSDT.P: Two Key Demand Zones🟩 POLUSDT: Bullish Momentum🌟 PENDLEUSDT.P: Where Opportunity Meets Precision🔥 BTCUSDT.P: Liquidation of Highly Leveraged Longs🌊 SOLUSDT.P: SOL's Dip - Your Opportunity🐸 1000PEPEUSDT.P: Prime Bounce Zone Unlocked🚀 ETHUSDT.P: Set to Explode - Don't Miss This Game Changer🤖 IQUSDT: Smart Plan⚡️ PONDUSDT: A Trade Not Taken Is Better Than a Losing One💼 STMXUSDT: 2 Buying Areas🐢 TURBOUSDT: Buy Zones and Buyer Presence🌍 ICPUSDT.P: Massive Upside Potential | Check the Trade Update For Seeing Results🟠 IDEXUSDT: Spot Buy Area | %26 Profit if You Trade with MSB 📌 USUALUSDT: Buyers Are Active + %70 Profit in Total🌟 FORTHUSDT: Sniper Entry +%26 Reaction🐳 QKCUSDT: Sniper Entry +%57 Reaction📊 BTC.D: Retest of Key Area Highly Likely📊 XNOUSDT %80 Reaction with a Simple Blue Box!📊 BELUSDT Amazing %120 Reaction!📊 Simple Red Box, Extraordinary Results📊 TIAUSDT | Still No Buyers—Maintaining a Bearish Outlook📊 OGNUSDT | One of Today’s Highest Volume Gainers – +32.44% I stopped adding to the list because it's kinda tiring to add 5-10 charts in every move but you can check my profile and see that it goes on..
MasterAnanda
Simple VS Complex Trading & 100% Possible Success Rate

Here we have all the classic signals. I am just going to list them all for the fun of it.PUNDIX did the classic long-term correction that ends in a "low."This low produces a bullish breakout and here it comes, a perfect falling wedge pattern, this pattern ends in a "higher low" and this higher low is happening exactly at the 0.618 Fib. retracement level in relation to the bullish wave that just happened between April and May. This whole pattern price dynamic will lead to a higher high and these are the numbers you can see highlighted with grey lines on the chart.These are all classics. When you have these classic signals you can bet they are supported by the MACD, moving averages and the RSI.Trading above EMA55, bullish MACD with bullish cross, RSI strong, etc. With this we have a combination of all the signals that we used in late 2017, in 2018 and beyond.I stopped using them because if you spread them too much then they stop working. In this way, those people that learned the system could continue to spot trend reversals using these signals, so it continued to work. I focused on candlestick reading, market cycle, astrology and chart structure to give my analysis a different flavor but it is all the same and it all works. Once you get the feeling of the market, the energy, the pulse, the flow, you are in and you can make accurate predictions most of the time. We are all humans though so don't expect to be always right, it is ok to be wrong.It is not that we can't be perfect 100% of the time, it is just that we do not have the capacity to do so. If you forfeit your life for this craft, it can be done. But nobody wants to sacrifice that much.It is better to just buy low and hold.Sell when prices are up. No need to get the exact bottom nor the exact top and if we make a mistake, we learn from it and move on.Namaste.
Bithereum_io
PUNDIXUSDT 1D

#PUNDIX is going to retest the support zone and the daily MA200 again. In case of a successful bounce, we expect a 2x bullish rally in the coming weeks. The targets are:🎯 $0.5020🎯 $0.5657🎯 $0.6172🎯 $0.6687🎯 $0.7420🎯 $0.8354⚠️ Use a tight stop-loss.
UmutTrades
PUNDIXUSDT - Not Looking Bad

PUNDIXUSDT – While many coins are showing instability, PUNDIX is quietly maintaining its ground. This kind of silence often precedes sharp movement. We’ve identified the blue box as the first significant support area, and if you’ve been following my work, you already know that I always recommend waiting for confirmation before acting.We’ve seen this pattern many times — a coin that looks quiet, ignored by the crowd, suddenly attracts volume and explodes. I don’t insist on my long idea blindly. If the levels break downward and fail to give confirmation on low timeframes, I’ll pass. But if the support holds and we regain with solid candles and volume, this could be a high-risk/high-reward opportunity.It’s also worth noting that I only select coins that show significant relative volume spikes, and PUNDIX made it to that list today — which is not something you can ignore.📌 Remember: Most people don't understand these deeper orderflow and volume strategies. That’s why you’re here. You don’t have to trade blindly anymore. My methods, which are visible in my profile with a proven win rate, are built to protect you and help you grow.So, keep your eyes on the blue box. This might be the moment everyone else misses.📌I keep my charts clean and simple because I believe clarity leads to better decisions.📌My approach is built on years of experience and a solid track record. I don’t claim to know it all but I’m confident in my ability to spot high-probability setups.📌If you would like to learn how to use the heatmap, cumulative volume delta and volume footprint techniques that I use below to determine very accurate demand regions, you can send me a private message. I help anyone who wants it completely free of charge.🔑I have a long list of my proven technique below:🎯 ZENUSDT.P: Patience & Profitability | %230 Reaction from the Sniper Entry🐶 DOGEUSDT.P: Next Move🎨 RENDERUSDT.P: Opportunity of the Month💎 ETHUSDT.P: Where to Retrace🟢 BNBUSDT.P: Potential Surge📊 BTC Dominance: Reaction Zone🌊 WAVESUSDT.P: Demand Zone Potential🟣 UNIUSDT.P: Long-Term Trade🔵 XRPUSDT.P: Entry Zones🔗 LINKUSDT.P: Follow The River📈 BTCUSDT.P: Two Key Demand Zones🟩 POLUSDT: Bullish Momentum🌟 PENDLEUSDT.P: Where Opportunity Meets Precision🔥 BTCUSDT.P: Liquidation of Highly Leveraged Longs🌊 SOLUSDT.P: SOL's Dip - Your Opportunity🐸 1000PEPEUSDT.P: Prime Bounce Zone Unlocked🚀 ETHUSDT.P: Set to Explode - Don't Miss This Game Changer🤖 IQUSDT: Smart Plan⚡️ PONDUSDT: A Trade Not Taken Is Better Than a Losing One💼 STMXUSDT: 2 Buying Areas🐢 TURBOUSDT: Buy Zones and Buyer Presence🌍 ICPUSDT.P: Massive Upside Potential | Check the Trade Update For Seeing Results🟠 IDEXUSDT: Spot Buy Area | %26 Profit if You Trade with MSB 📌 USUALUSDT: Buyers Are Active + %70 Profit in Total🌟 FORTHUSDT: Sniper Entry +%26 Reaction🐳 QKCUSDT: Sniper Entry +%57 Reaction📊 BTC.D: Retest of Key Area Highly Likely📊 XNOUSDT %80 Reaction with a Simple Blue Box!📊 BELUSDT Amazing %120 Reaction!📊 Simple Red Box, Extraordinary ResultsI stopped adding to the list because it's kinda tiring to add 5-10 charts in every move but you can check my profile and see that it goes on..

Ren_MomentumTrader
PUNDIX/USDT

Key Level Zone: 0.4520 - 0.4570HMT v8.1 detected. The setup looks promising, supported by a previous upward/downward trend with increasing volume and momentum, presenting an excellent reward-to-risk opportunity.HMT (High Momentum Trending):HMT is based on trend, momentum, volume, and market structure across multiple timeframes. It highlights setups with strong potential for upward movement and higher rewards.Whenever I spot a signal for my own trading, I’ll share it. Please note that conducting a comprehensive analysis on a single timeframe chart can be quite challenging and sometimes confusing. I appreciate your understanding of the effort involved.Important Note :Role of Key Levels:- These zones are critical for analyzing price trends. If the key level zone holds, the price may continue trending in the expected direction. However, momentum may increase or decrease based on subsequent patterns.- Breakouts: If the key level zone breaks, it signals a stop-out. For reversal traders, this presents an opportunity to consider switching direction, as the price often retests these zones, which may act as strong support-turned-resistance (or vice versa).My Trading RulesRisk Management- Maximum risk per trade: 2.5%.- Leverage: 5x.Exit StrategyProfit-Taking:- Sell at least 70% on the 3rd wave up (LTF Wave 5).- Typically, sell 50% during a high-volume spike.- Adjust stop-loss to breakeven once the trade achieves a 1.5:1 reward-to-risk ratio.- If the market shows signs of losing momentum or divergence, ill will exit at breakeven.The market is highly dynamic and constantly changing. HMT signals and target profit (TP) levels are based on the current price and movement, but market conditions can shift instantly, so it is crucial to remain adaptable and follow the market's movement.If you find this signal/analysis meaningful, kindly like and share it.Thank you for your support~Sharing this with love!HMT v2.0:- Major update to the Momentum indicator- Reduced false signals from inaccurate momentum detection- New screener with improved accuracy and fewer signalsHMT v3.0:- Added liquidity factor to enhance trend continuation- Improved potential for momentum-based plays- Increased winning probability by reducing entries during peaksHMT v3.1:- Enhanced entry confirmation for improved reward-to-risk ratiosHMT v4.0:- Incorporated buying and selling pressure in lower timeframes to enhance the probability of trending moves while optimizing entry timing and scalingHMT v4.1:- Enhanced take-profit (TP) target by incorporating market structure analysisHMT v5 :Date: 23/01/2025- Refined wave analysis for trending conditions- Incorporated lower timeframe (LTF) momentum to strengthen trend reliability- Re-aligned and re-balanced entry conditions for improved accuracyHMT v6 :Date : 15/02/2025- Integrated strong accumulation activity into in-depth wave analysisHMT v7 :Date : 20/03/2025- Refined wave analysis along with accumulation and market sentimentHMT v8 :Date : 16/04/2025- Fully restructured strategy logicHMT v8.1 :Date : 18/04/2025- Refined Take Profit (TP) logic to be more conservative for improved win consistency

Senku010
PUNDIX

break below the significant bullish order block confluence around $0.4328 confirms bearish continuation. The immediate targets are the sell-side liquidity pools below the current price. Any rallies should be viewed with caution as potential opportunities to short, given the prevailing downtrend and overhead resistance.
Disclaimer
Any content and materials included in Sahmeto's website and official communication channels are a compilation of personal opinions and analyses and are not binding. They do not constitute any recommendation for buying, selling, entering or exiting the stock market and cryptocurrency market. Also, all news and analyses included in the website and channels are merely republished information from official and unofficial domestic and foreign sources, and it is obvious that users of the said content are responsible for following up and ensuring the authenticity and accuracy of the materials. Therefore, while disclaiming responsibility, it is declared that the responsibility for any decision-making, action, and potential profit and loss in the capital market and cryptocurrency market lies with the trader.