
PUMP
Pump.fun
| تریدر | نوع سیگنال | حد سود/ضرر | زمان انتشار | مشاهده پیام |
|---|---|---|---|---|
 CryptojobsRank: 32078 | فروش | حد سود: تعیین نشده حد ضرر: تعیین نشده | 12/18/2025 |
Price Chart of Pump.fun
سود 3 Months :
سیگنالهای Pump.fun
Filter
Sort messages by
Trader Type
Time Frame
Cryptojobs
$PUMP - Setup completed
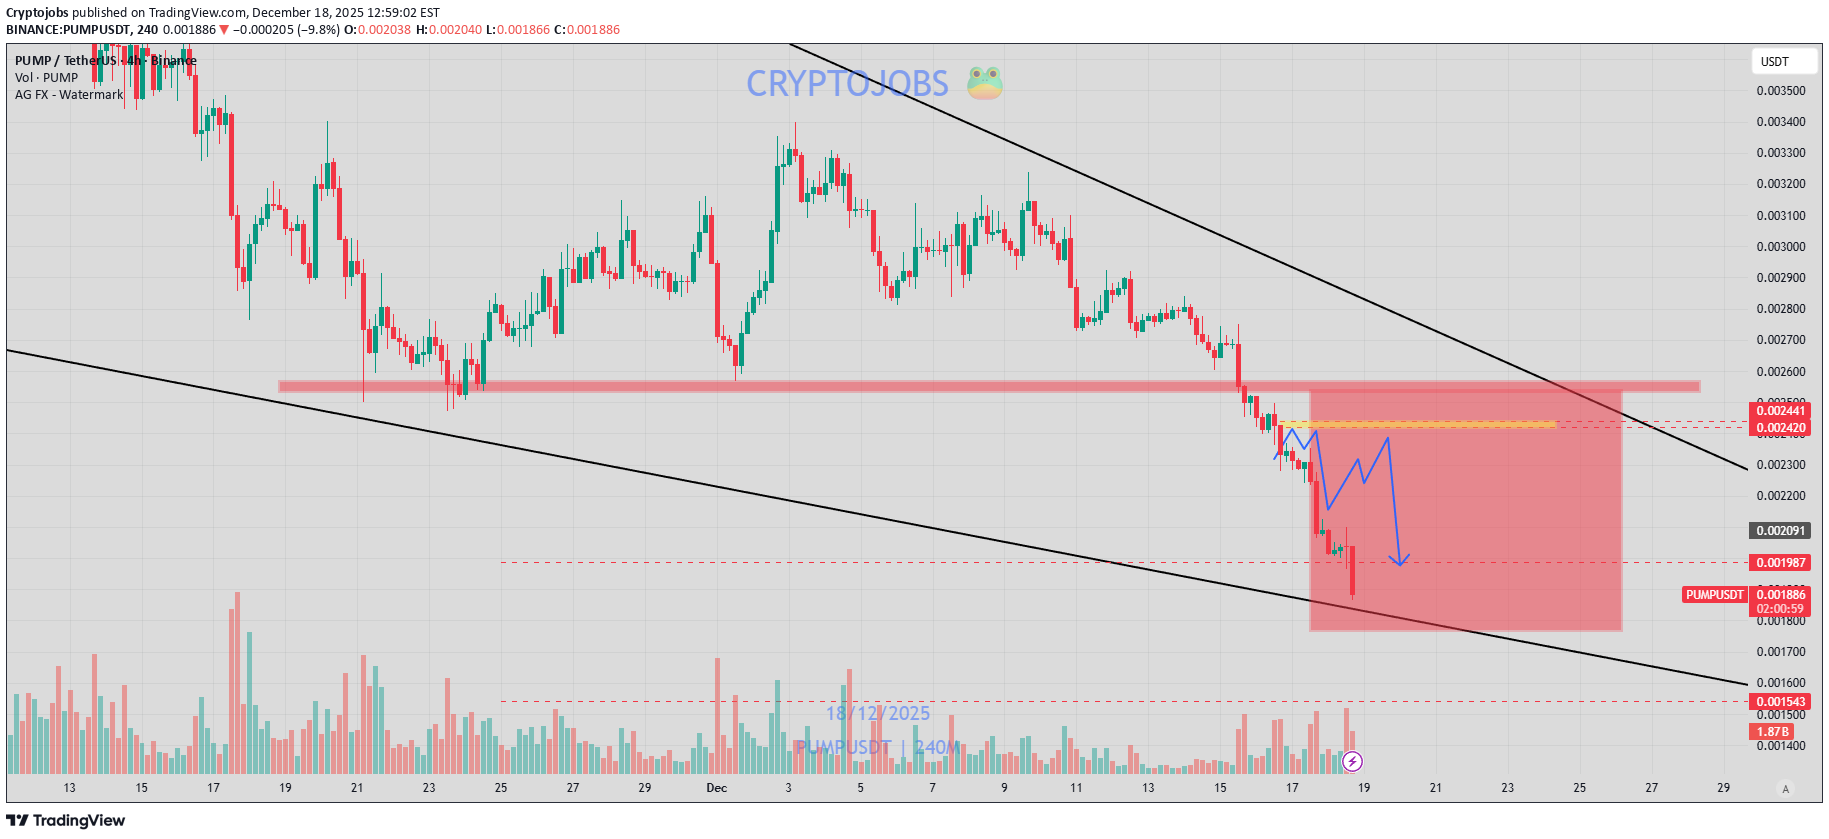
PUMP - Setup completed 🎯 -20%✅ Sell pressure & FUD could continue over time regarding the bad news ongoing 🔴📉 Did you took this one!? 🔥

CryptoNikkoid
The reason why PUMP.fun is crashing ($SOL ecosystem, warning)
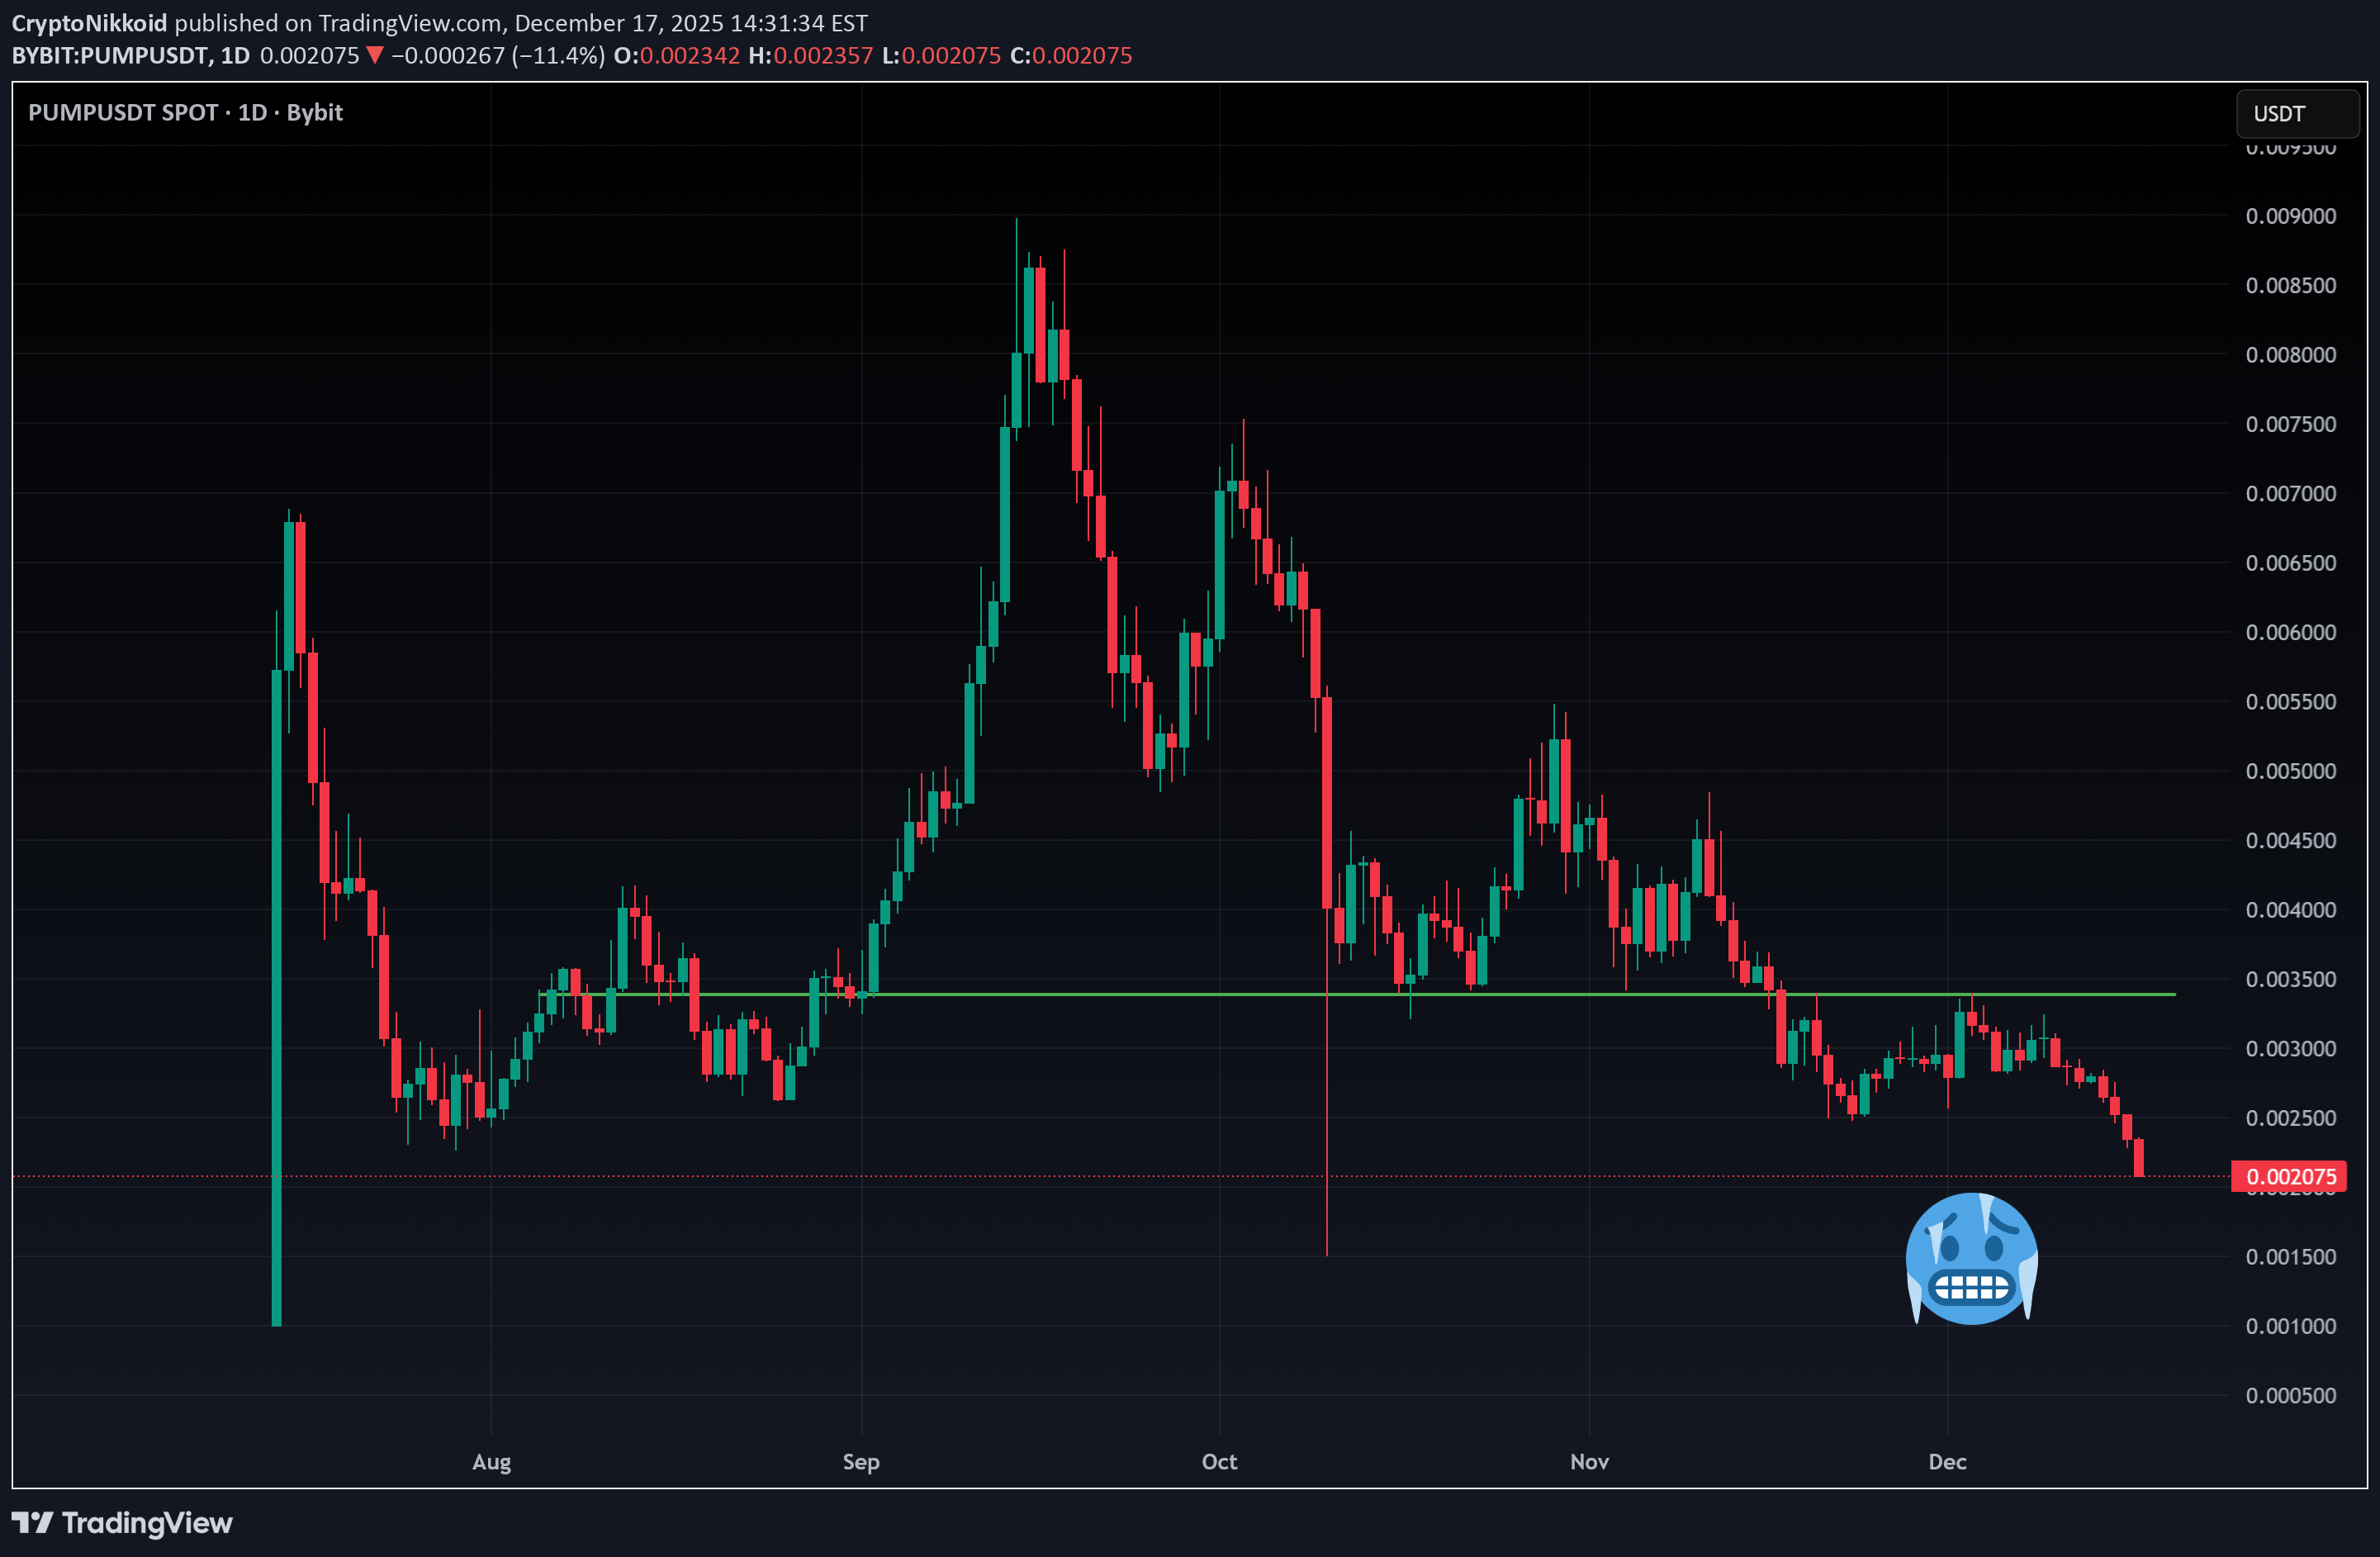
Complete explanation is here: x.com/cryptonikkoid/status/2001335962182521023?s=20 🚨 This Could Be a Major Problem for Solana Most people don’t realize how serious this is yet. A U.S. federal court has allowed a second amended class-action lawsuit to move forward involving PumpFun, Solana Labs, and Solana-linked entities. This is not crypto Twitter drama — it’s a court saying there’s enough substance to proceed. The core allegation is simple and dangerous: Insiders allegedly had structural advantages during memecoin launches — faster access, priority transactions, cheaper entries — while retail was pushed to the back and left holding the losses after rapid pumps and crashes. If that sounds familiar, it’s because that’s exactly how most people experienced PumpFun. What really matters: The lawsuit doesn’t just target apps built on Solana. It directly questions Solana’s validator structure and transaction-ordering mechanisms. If courts or regulators conclude that this infrastructure enabled unfair market access or unregistered securities activity, Solana’s core narrative — fast, cheap, permissionless — turns into a liability. That’s a completely different level of risk. Add to this another uncomfortable fact: Roughly 45–55% of SOL is held by insiders, VCs, foundations, and institutions. If confidence breaks, liquidity disappears fast. Crypto doesn’t reprice on fundamentals in stress — it reprices trust. We’ve seen this before: FTX, Luna, Celsius. Different stories, same ending. I’m not saying Solana is dead tomorrow. I am saying this is the first time its core architecture is being questioned in a legal setting — and that’s a line you don’t want crossed lightly. Watch this closely. If this snowballs, downside scenarios people once laughed at will stop sounding impossible.

Pump it up
Interesting pattern for pump before fed rate announcement. Let’s see

Bithereum_io
تحلیل تکنیکال PUMP/USDT: آیا ریزش ادامه دارد یا منتظر انفجار بزرگ باشیم؟
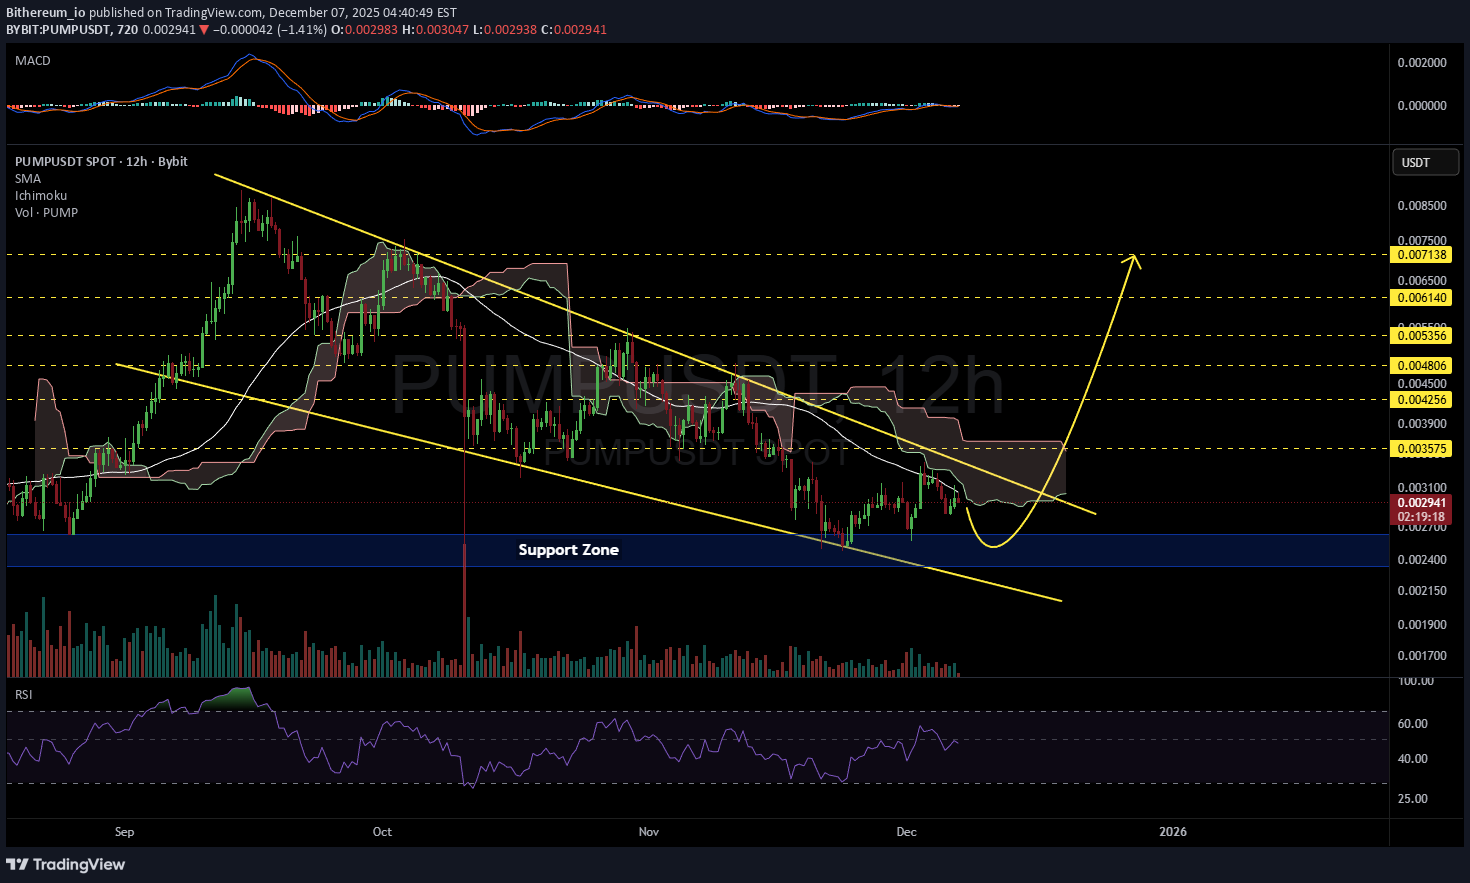
#PUMP is moving inside a falling wedge pattern on the 12H timeframe. It is currently facing a heavy resistance cluster, including the 12H SMA50, the Ichimoku cloud, and the wedge resistance. There is a high chance of a support retest before the next leg up. If the price breaks below the wedge, the analysis will be invalidated. In case of a breakout above the resistance cluster, the potential targets are: 🎯 $0.003575 🎯 $0.004256 🎯 $0.004806 🎯 $0.005356 🎯 $0.006140 🎯 $0.007138 ⚠️ Always remember to use a tight stop-loss and maintain proper risk management.

SergioRichi
آیا زمان خرید PUMPUSDT فرا رسیده است؟ فرصت سود 150 درصدی!
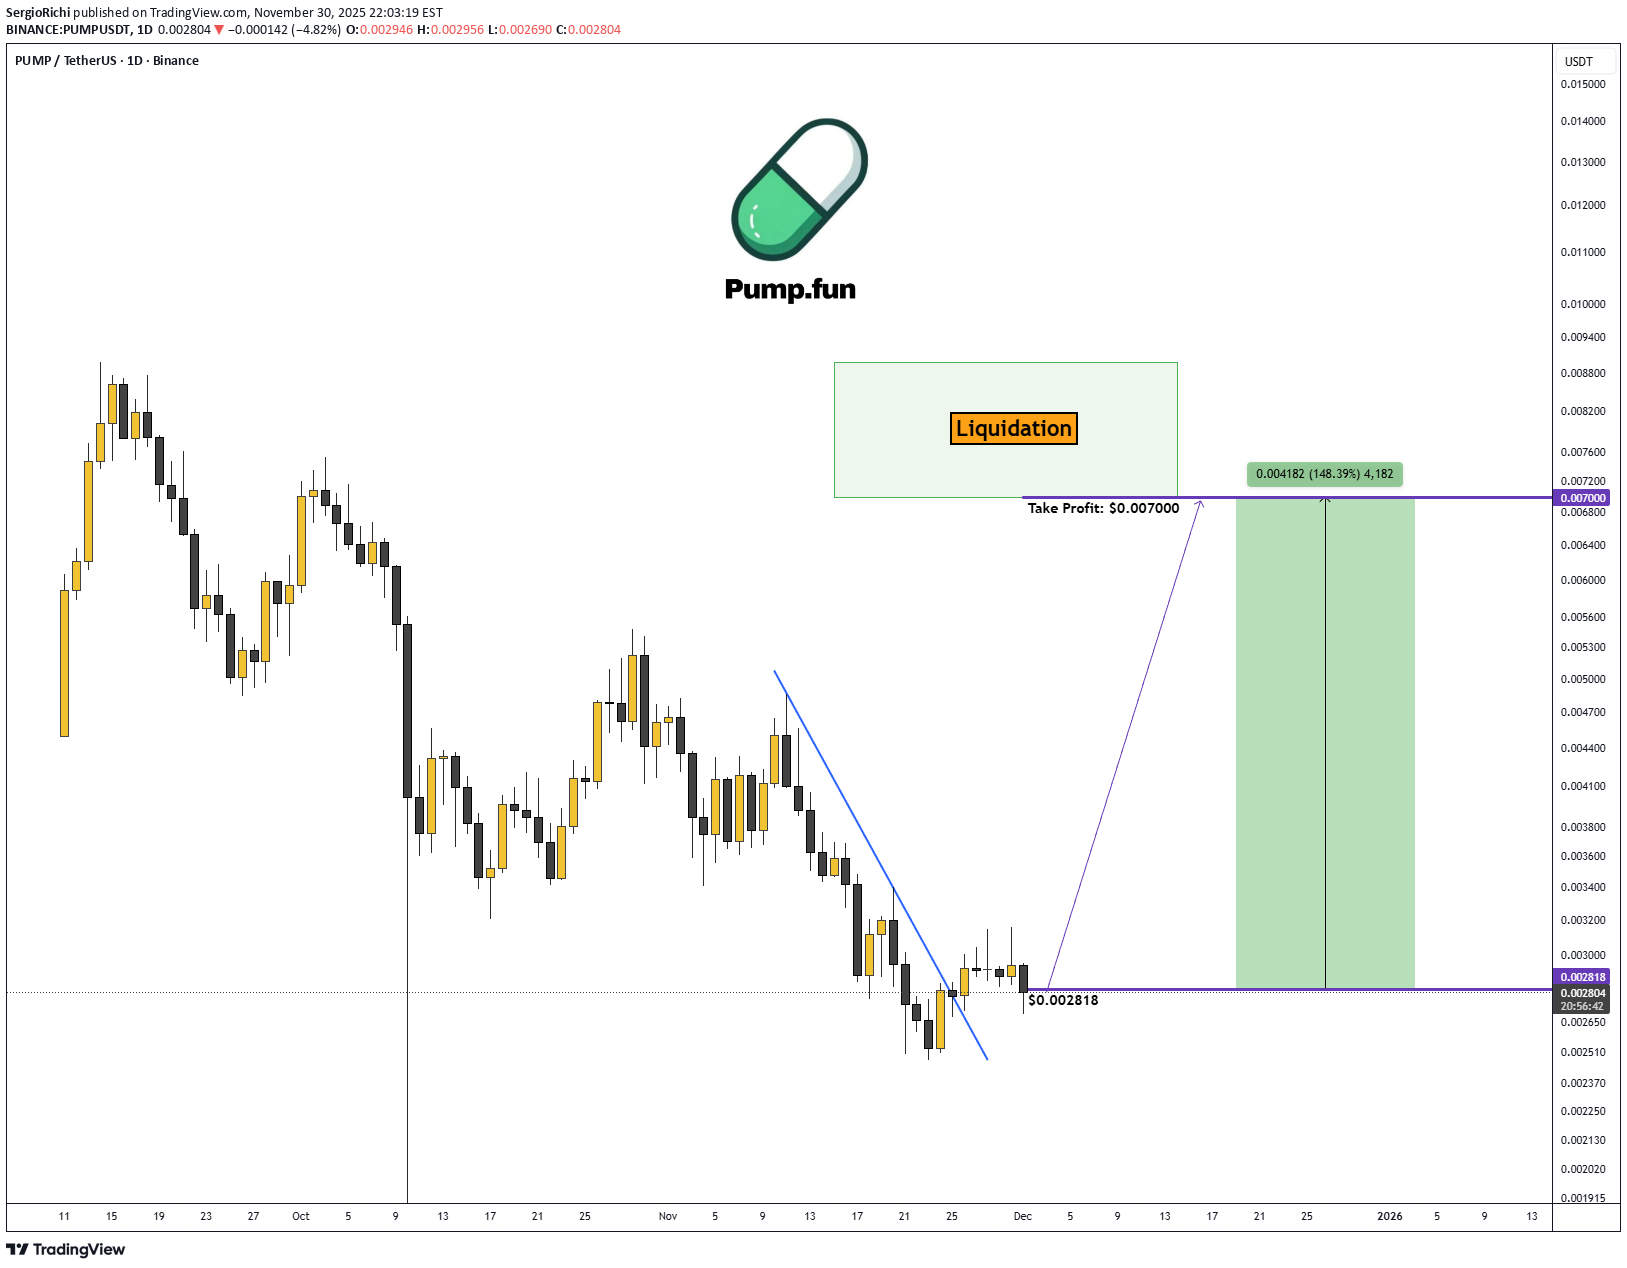
🐸 PUMP #PumpFun ➖ Time to buy? Chart (PUMPUSDT): PUMP is down 72% from its all-time high. Looking at the liquidation map, this looks like a solid entry point to grab some PUMP for part of the portfolio with around +150% upside potential. Take-profit target is $0.007 ➖ right where the biggest cluster of short liquidations sits.I don't like what's happening right now. Closing the trade at +2.98% with an exit price of $0.002902. It looks like the correction in BTC, ETH, PUMP, and other assets could keep going and form a new local bottom.

VIPROSE
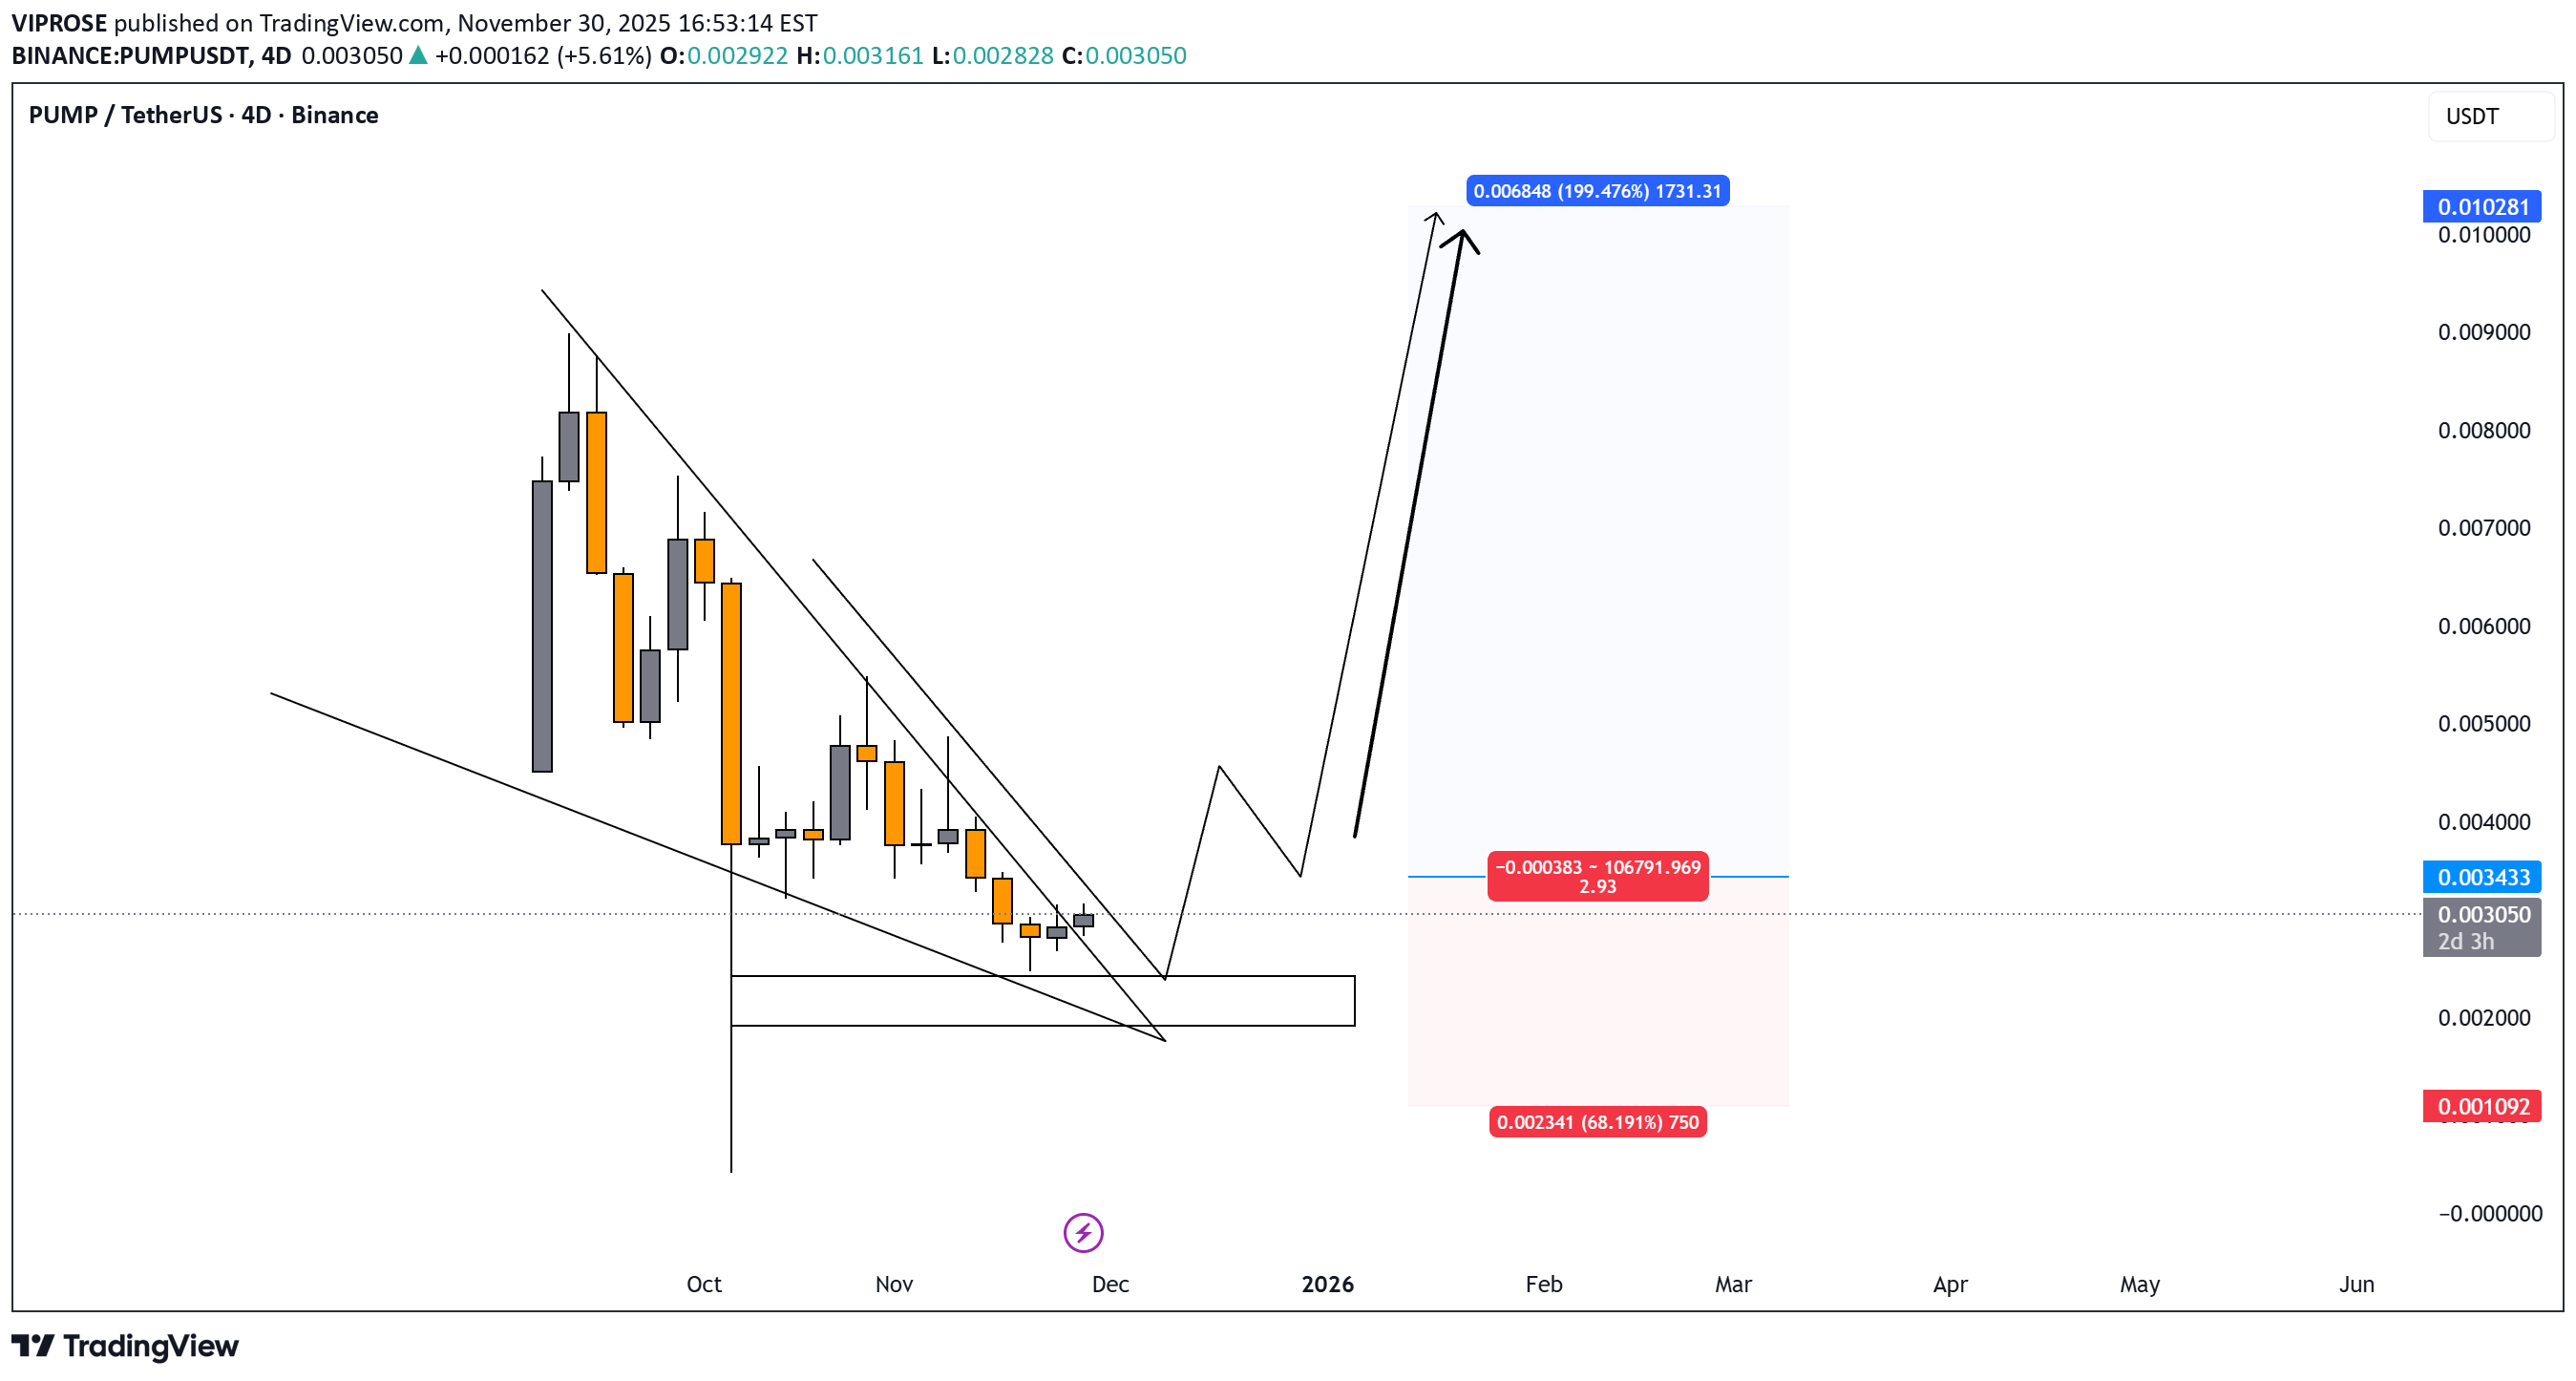
آیا پامپ بعدی اینجاست؟ تحلیل تکنیکال و اهداف قیمتی شگفتانگیز پامپ!

Elimzo
خرید پامپفان (PUMPFUNUSDT): فرصت میانمدت خرید در حمایت کلیدی!
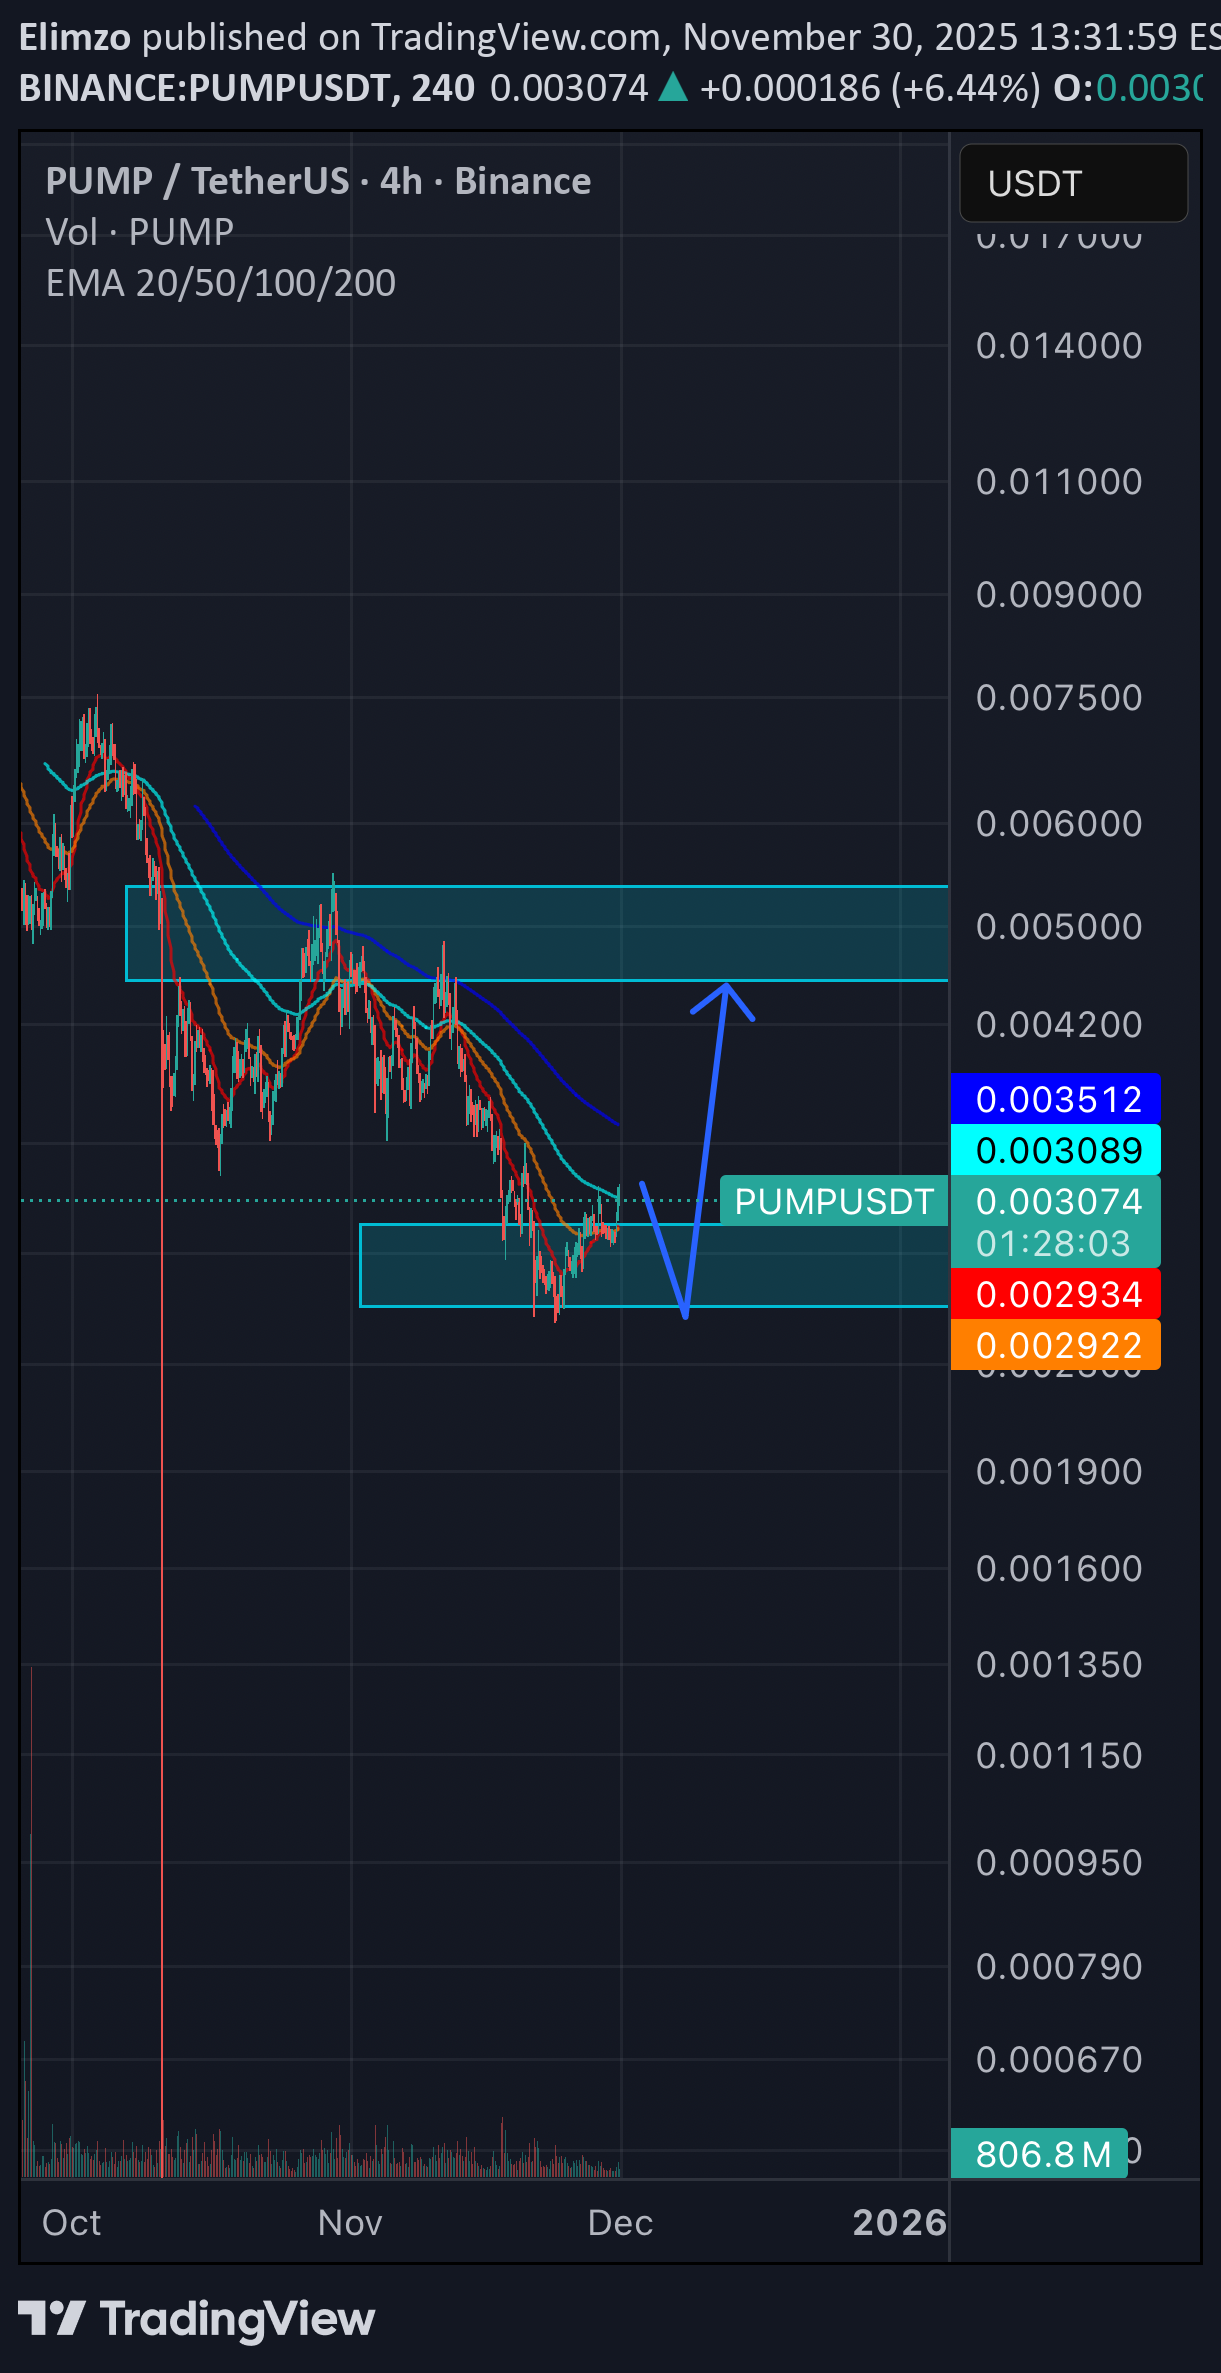
The price has entered the zone of interest of medium-term purchases of $ 0.002435-$0.002925, where the main annual trading volume ($0.002900) is located. It is interesting to consider purchases on a repeated decline near the support level of 0.002435 $ with the aim of restoring the price to the nearest resistance zone of 0.004560-0.005500$.

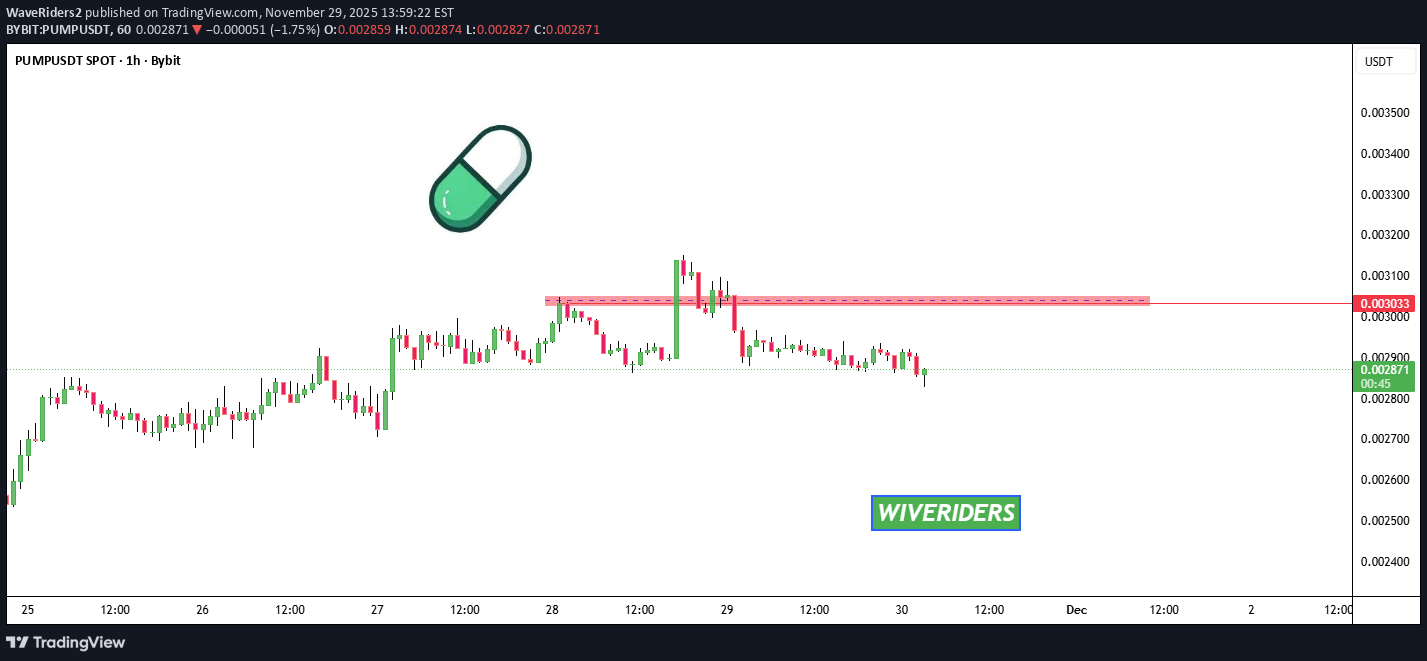
WaveRiders2
مقاومت جدید PUMP: آیا خریداران میتوانند از سقف قرمز عبور کنند؟

MadWhale
آیا پامپ بعدی 40 درصدی برای این ارز در راه است؟ تحلیل سطوح کلیدی تا رسیدن به 0.004080 دلار
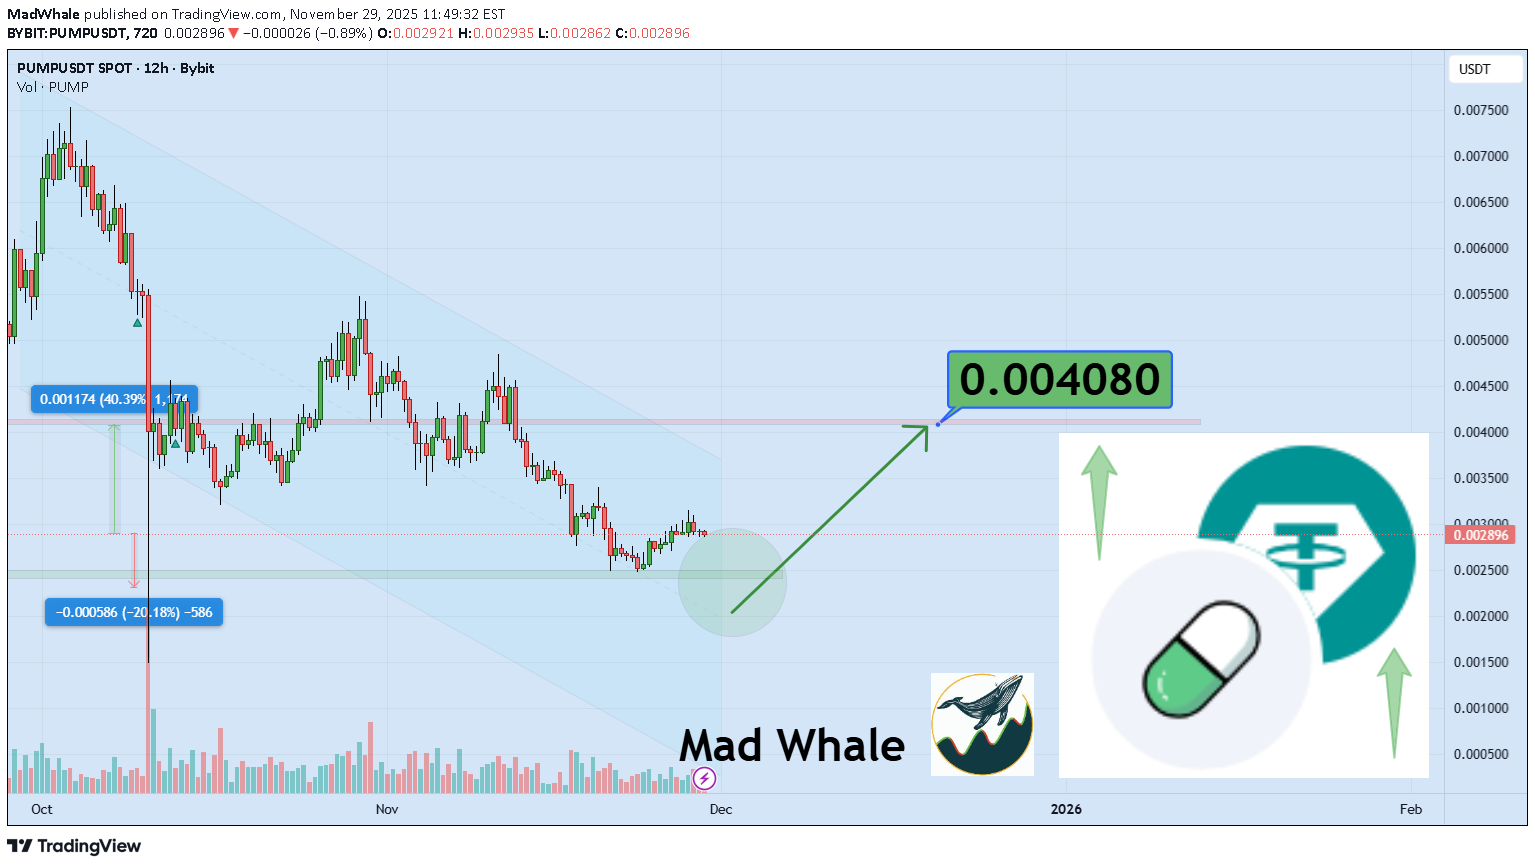
Hi the support and resistances on the chart are based on the previous data and weekly candlesticks if PUMPUSDT holds this last support the potential of 40% gain is logical toward 0.004080$
Disclaimer
Any content and materials included in Sahmeto's website and official communication channels are a compilation of personal opinions and analyses and are not binding. They do not constitute any recommendation for buying, selling, entering or exiting the stock market and cryptocurrency market. Also, all news and analyses included in the website and channels are merely republished information from official and unofficial domestic and foreign sources, and it is obvious that users of the said content are responsible for following up and ensuring the authenticity and accuracy of the materials. Therefore, while disclaiming responsibility, it is declared that the responsibility for any decision-making, action, and potential profit and loss in the capital market and cryptocurrency market lies with the trader.