
PLUME
Plume
| تریدر | نوع سیگنال | حد سود/ضرر | زمان انتشار | مشاهده پیام |
|---|---|---|---|---|
No results found. | ||||
Price Chart of Plume
سود 3 Months :
سیگنالهای Plume
Filter
Sort messages by
Trader Type
Time Frame

Goldfinch_song
سیگنال خرید قوی PLUME: بازگشت از کف با کاتالیزورهای RWA و USDC
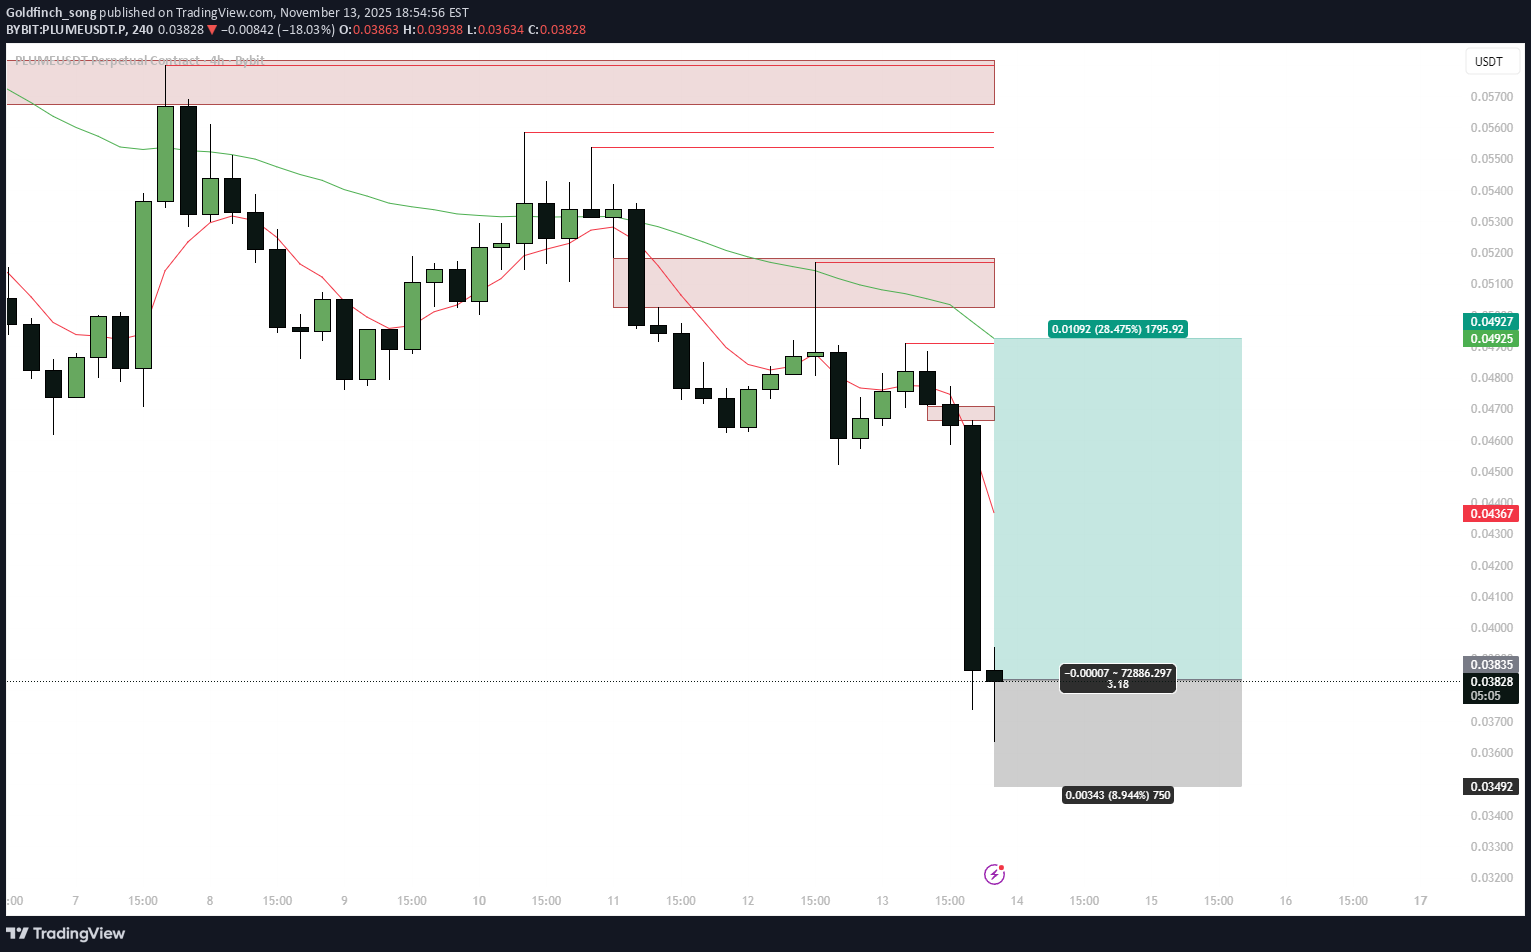
Setup PLUMEUSDT just printed a fresh 4H EMA Deviation long signal after a sharp flush below the EMA stack. Price is trading around 0.038–0.039, with all key timeframes (15m, 1H, 4H, 1D, 3D) in “Below / Oversold” state on my EMA Dev dashboard. Current 4H deviation is ~28%, above the historical oversold average (~26%), which fits my rules for a mean-reversion long. I am looking for a bounce back into the 4H EMA band and the nearest supply zone, where the previous distribution leg started. Technical context The downtrend from 0.055–0.056 pushed price under the 4H and 1D EMAs and into the lower ATR corridor. The last impulsive candle washed out local longs and expanded deviation to one of the highest readings in the current sample. Key levels on the chart: • Entry zone: 0.038–0.039 (current 4H demand / max negative deviation) • First target: 0.0485–0.0490 (4H EMA cluster + local supply) • Optional second target: 0.055–0.056 (prior breakdown area / 1D EMA region) • Invalidation: sustained 4H close below the spike low around 0.034–0.035 As usual with this strategy, I’m not trying to catch the exact bottom – the edge comes from entering when deviation is stretched and closing into the EMA / resistance band. Strategy stats (PLUME, 4H EMA Dev long) Backtest sample: 20 trades, long only. Winrate: 75%. Avg PnL per trade: +3.75%, avg winner +8.15%, avg loser −9.45% (win/loss ratio ~0.81). Largest winner +17.4%, largest loser −15.4%. Losing trades tend to last longer (≈62 bars) than winners (≈25 bars), so if price sits under EMAs too long without mean reversion, I prefer to cut rather than “marinate” in drawdown. Given the current ~28% negative deviation, the upside to the 4H EMA/supply (~+25–28%) is larger than the historical average winner, while downside to invalidation is kept near the typical loss profile. Fundamentals & narrative Plume is positioning as an RWA chain with a focus on compliant tokenized assets: CCTP V2 and native USDC are now live on Plume, enabling smoother cross-chain liquidity flows. Nest Protocol is relaunching on Plume using Pendle-style mechanics with TVL in the hundreds of millions, supporting the yield/RWA narrative. There is active collaboration with Circle (CCTP + USDC workshop) and a growing stack of institutional RWA products (WisdomTree funds, Galaxy allocation, prior SEC transfer-agent registration, etc.), although some of those catalysts are already “spent” in the short term. Main overhang: an upcoming unlock of ~239.65M PLUME (~2.4% of supply) on 21 December, which can cap the upside if spot demand doesn’t keep up. My fundamental score here is around BBB+ – constructive RWA + USDC story, but with clear unlock risk. Trade plan Base case: fade the current oversold deviation on 4H, ride the move back into 0.048–0.049, and optionally trail a small remainder toward 0.055–0.056 if momentum and flows improve. If price fails to bounce and closes 4H below 0.034–0.035, I consider the EMA Dev setup invalid for now and step aside until a new deviation cluster forms. Not financial advice – this is a systematic mean-reversion long based on my EMA Deviation framework plus the current RWA / USDC catalysts on Plume.

CryptoChartDaily
شبکه PLUME: تحلیل ۳ ساعته و نشانه تغییر مومنتوم (هشدار سرمایهگذاری!)
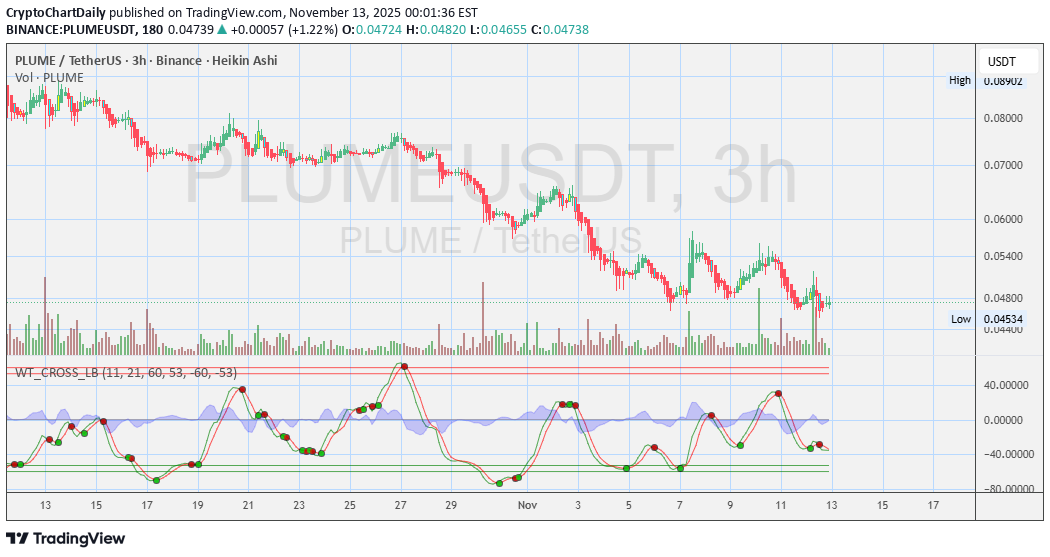
🧠 Keep it on watch. Momentum shifting. ⚠️ Disclosures : This analysis is for informational purposes only and is not financial advice. It does not constitute a recommendation to buy, sell, or trade any securities, cryptocurrencies, or stocks. Trading involves significant risk, and you should consult with a qualified financial advisor before making any investment decisions. Past performance is not indicative of future results.
CryptoChartDaily
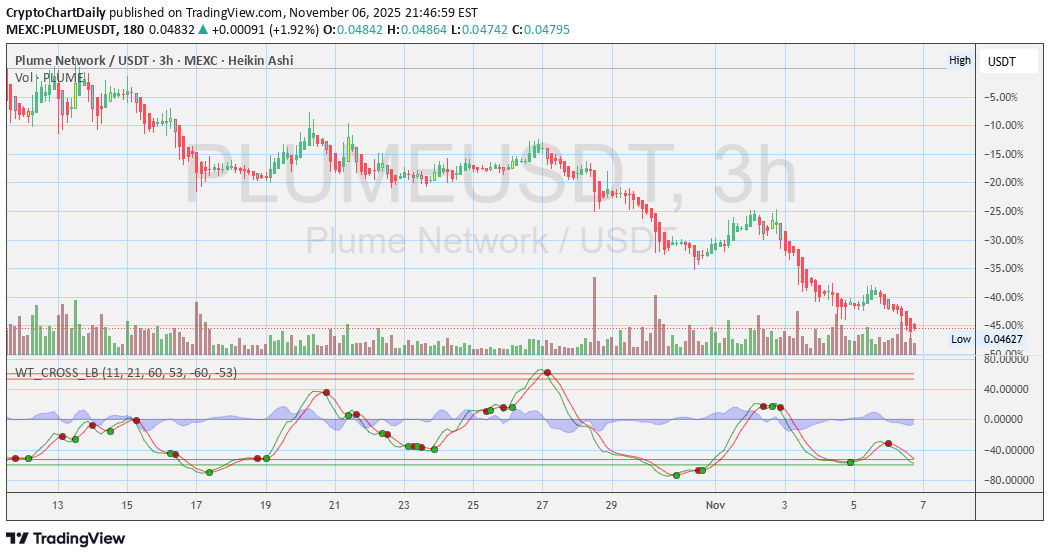
سیگنال خرید پنهان پلوم نتورک: آیا موج صعودی آغاز میشود؟
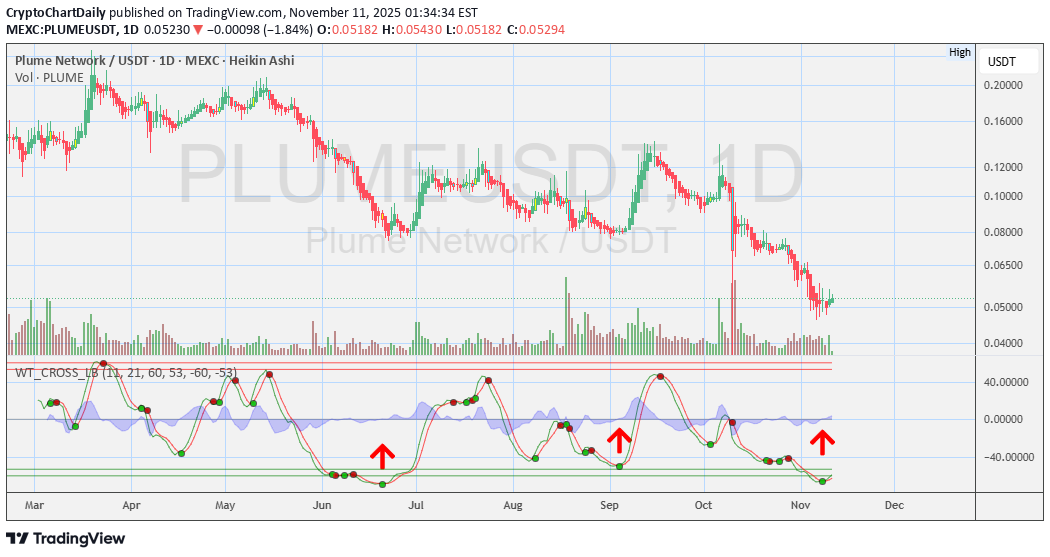
WT_CROSS indicator - WT (WaveTrend) printed a green buy dot at oversold region - WT lines are curling upward — bullish momentum building 🧠 Keep it on watch. Momentum shifting. ⚠️ Disclosures: This analysis is for informational purposes only and is not financial advice. It does not constitute a recommendation to buy, sell, or trade any securities, cryptocurrencies, or stocks. Trading involves significant risk, and you should consult with a qualified financial advisor before making any investment decisions. Past performance is not indicative of future results.
CryptoChartDaily
افت شدید 60 درصدی شبکه Plume: آیا این برگشت مهمی است؟ (تحلیل اندیکاتور)
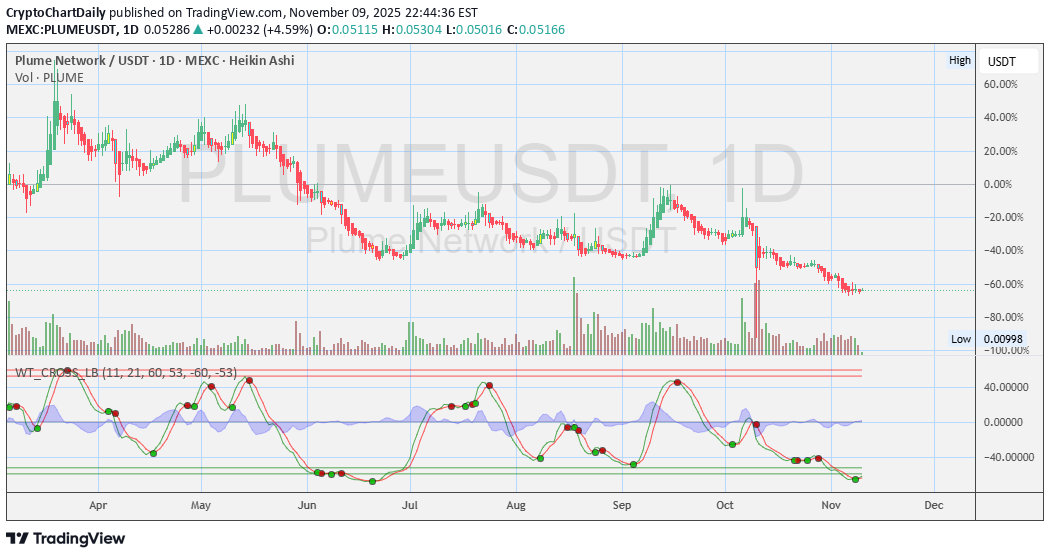
WT_CROSS indicator - WT (WaveTrend) printed a green buy dot at oversold region - WT lines are curling upward — bullish momentum building 🧠 Keep it on watch. Momentum shifting. ⚠️ Disclosures : This analysis is for informational purposes only and is not financial advice. It does not constitute a recommendation to buy, sell, or trade any securities, cryptocurrencies, or stocks. Trading involves significant risk, and you should consult with a qualified financial advisor before making any investment decisions. Past performance is not indicative of future results.
CryptoChartDaily
تحلیل ۲ ساعته PLUME: آیا کف قیمتی شکل گرفت؟ سیگنال خرید نهفته در اندیکاتورها
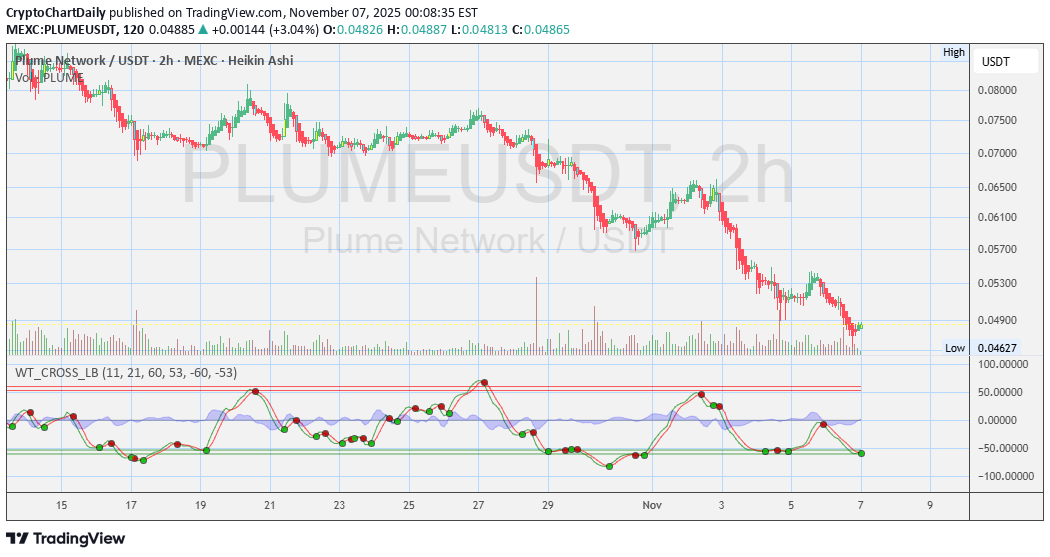
Current Market Structure - Price has been in a clear downtrend with lower highs and lower lows. - Recently bounced from a local low around ~$0.0462 - First green Heikin-Ashi candle forming after a strong red sequence — this often signals early reversal interest but needs confirmation. VOLUME - Volume still relatively weak compared to prior buying spikes. - No strong accumulation candle yet — suggests caution, as bounce may be weak unless buyers step in more aggressively. WT_CROSS indicator - WT (WaveTrend) printed a green buy dot at oversold region - WT lines are curling upward — bullish short-term momentum building - Historically on this chart, similar WT signals have led to short relief bounces even within downtrends. 🧠 Keep it on watch. Momentum shifting. ⚠️ Disclosures: This analysis is for informational purposes only and is not financial advice. It does not constitute a recommendation to buy, sell, or trade any securities, cryptocurrencies, or stocks. Trading involves significant risk, and you should consult with a qualified financial advisor before making any investment decisions. Past performance is not indicative of future results.
CryptoChartDaily
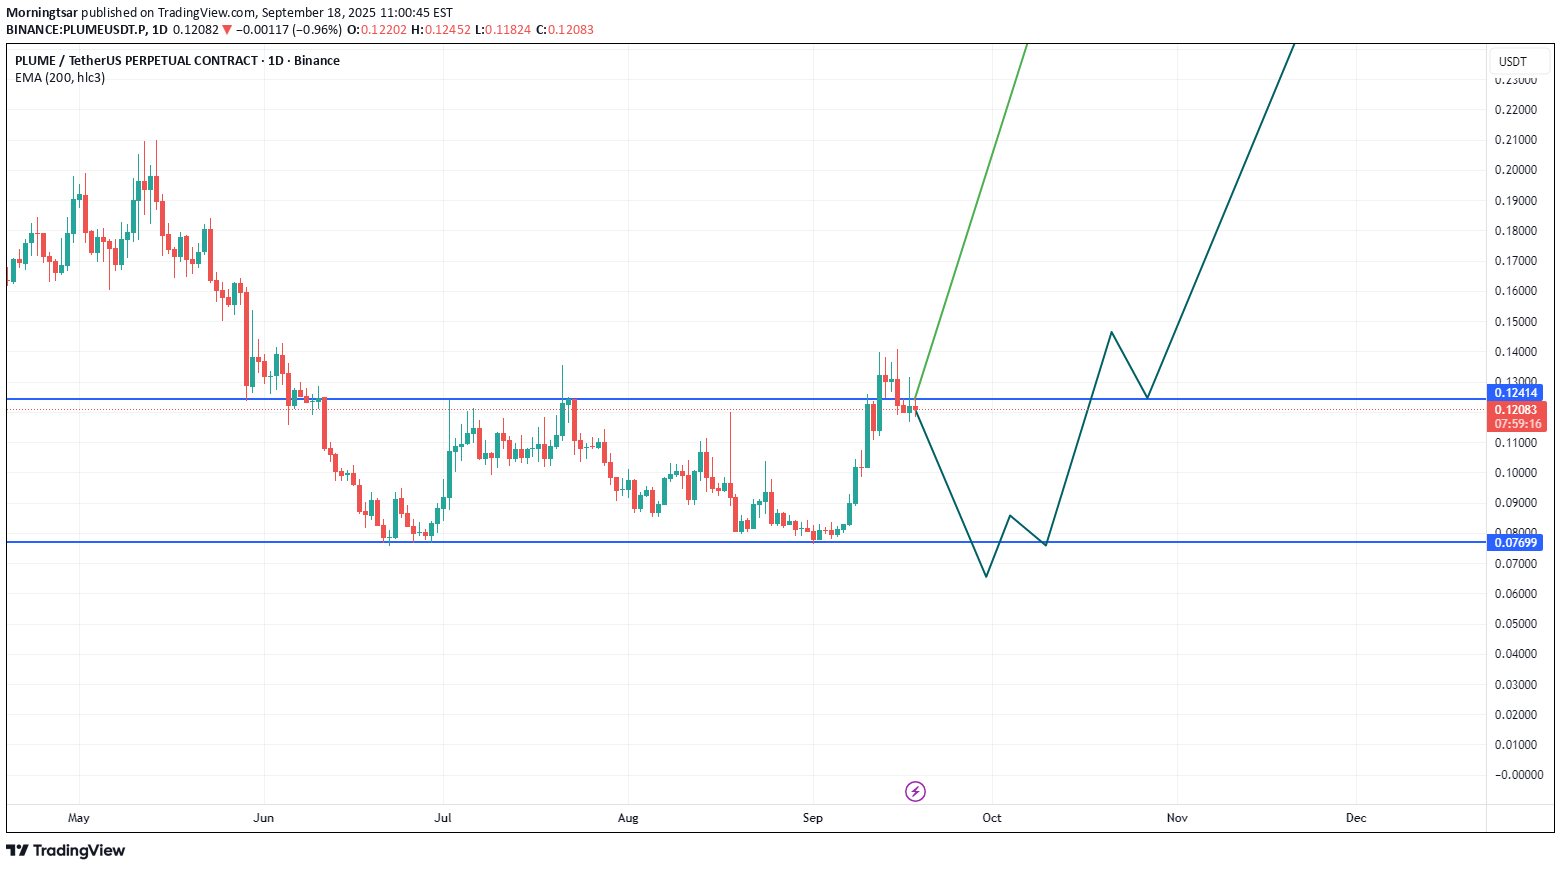
سقوط 50 درصدی پلُم (PLUME): آیا زمان خرید است یا باید منتظر ماند؟
PLUME — DOWN ↓ 50% in the last 30 days! 🧠 Keep it on watch. Momentum shifting. ⚠️ Disclosures: This analysis is for informational purposes only and is not financial advice. It does not constitute a recommendation to buy, sell, or trade any securities, cryptocurrencies, or stocks. Trading involves significant risk, and you should consult with a qualified financial advisor before making any investment decisions. Past performance is not indicative of future results.

Morningtsar
$PLUME
i THINK THIS MAYUBE you know how to take it away from our souls just to see beyond our strength

Bromadic
#PLUME
Just claimed my last part of airdrop from season 1 & price looks kinda decent for the upside, honestly don't have as much conviction as i had with our pump trade but still decent :) Lets see what next few days unfolds, support holds will try to scalp long it till resistance

volkanakman82
PLUME KIRILIMI YAPTI
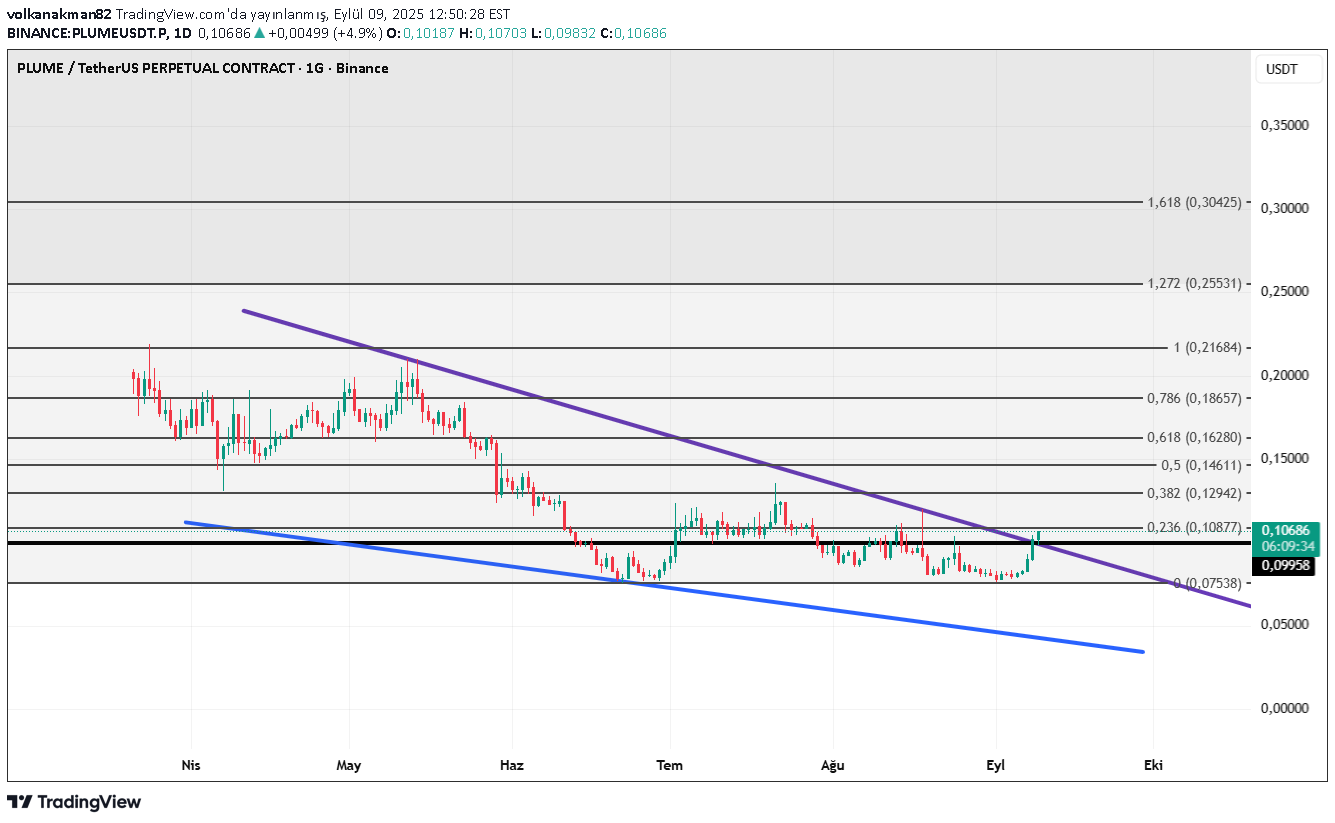
Resistors and targets are in the table unless they do daily closing under the break. good luck

CryptoNuclear
PLUME/USDT (1D) — Decision: Major Reversal or Deeper Correction?
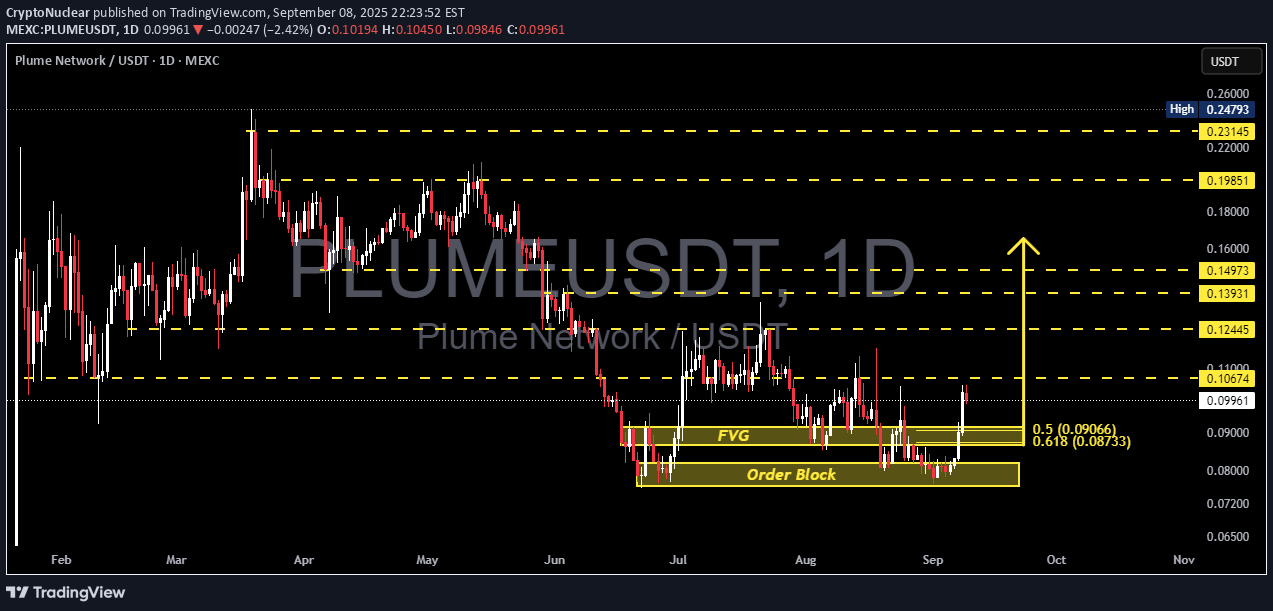
🔎 Technical Outlook PLUME is currently at a critical stage after months of decline since April. The price has found a strong demand zone around 0.076–0.082, aligned with a daily Order Block, reinforced by a Fair Value Gap (FVG) highlighting an imbalance zone that often acts as a turning point. From this zone, PLUME bounced sharply toward 0.100–0.106, which now stands as the first key resistance. This strong reaction suggests accumulation by larger players — but the real battle begins here: will PLUME break above 0.10674 to confirm a bullish reversal, or face rejection and revisit the demand zone? --- 🟢 Bullish Scenario 1. Upside Confirmation: A daily close above 0.10674 would signal short-term bullish momentum. Breakout could open the path toward higher resistance levels: Target 1: 0.12445 Target 2: 0.13931 Target 3: 0.14973 Major Upside Zone: 0.19851 → 0.23145 2. Entry Ideas: Conservative: wait for a retest at 0.090–0.092 (FVG) with stop-loss below 0.078. Aggressive: buy after a daily close above 0.10674 with volume confirmation. 3. Why Bullish Could Work: Strong bounce from demand zone. FVG often gets filled before continuation. Breaking 0.10674 would form a higher high and signal structure shift. --- 🔴 Bearish Scenario 1. Rejection at Resistance: If the price fails to break 0.10674, PLUME is likely to revisit: The FVG area (0.087–0.091). The Order Block (0.076–0.082). 2. Breakdown of Demand Zone: Losing this support zone could send PLUME lower toward 0.065. 3. Short Setup Idea: Entry: rejection near 0.105–0.107 with bearish confirmation. Stop-loss: above 0.112. Take-profit: first at 0.087–0.091, then 0.076–0.082. --- 📌 Pattern in Play Order Block + FVG: strong demand zone overlap. Potential Reversal Zone: could mark a major turning point. Key Pivot: 0.10674 — breakout or rejection here will define the next trend. --- 📝 Conclusion PLUME is at a make-or-break moment: Bullish Valid: daily close above 0.10674 → opens the way to 0.124–0.149 and potentially higher. Bearish Valid: rejection at resistance and breakdown of the Order Block → downside risk toward 0.065. The 0.076–0.091 demand zone is the last line of defense for buyers. ⚠️ Always apply strict risk management, as this setup is highly prone to false breakouts and fake pumps. --- #PLUME #PLUMEUSDT #Crypto #TechnicalAnalysis #Altcoin #OrderBlock #FVG #PriceAction #CryptoTrading #SupplyDemand
Disclaimer
Any content and materials included in Sahmeto's website and official communication channels are a compilation of personal opinions and analyses and are not binding. They do not constitute any recommendation for buying, selling, entering or exiting the stock market and cryptocurrency market. Also, all news and analyses included in the website and channels are merely republished information from official and unofficial domestic and foreign sources, and it is obvious that users of the said content are responsible for following up and ensuring the authenticity and accuracy of the materials. Therefore, while disclaiming responsibility, it is declared that the responsibility for any decision-making, action, and potential profit and loss in the capital market and cryptocurrency market lies with the trader.