
volkanakman82
@t_volkanakman82

What symbols does the trader recommend buying?
Purchase History
پیام های تریدر
Filter
volkanakman82
BTC DE HERKESİN AKSİNE YÜKSELİŞ SENERYASOSU

The chart I'm looking at is very clear. The numbers you missed are in the table, don't miss them this time!!!!
volkanakman82

volkanakman82
ZEC MOLA SONRASI HAREKETE BAŞLADI

An extremely healthy correction after a spectacular rise. Cup handle in 4 small images after the falling trend break; Adam & Eve in the big picture.. the goal is clear and there are stops on the way to the goal.. ZEC's footsteps ..!
volkanakman82
آیا وقت صعود اتریوم (ETH) فرا رسیده است؟ تحلیل تکنیکال بر اساس فیبوناچی و الیوت
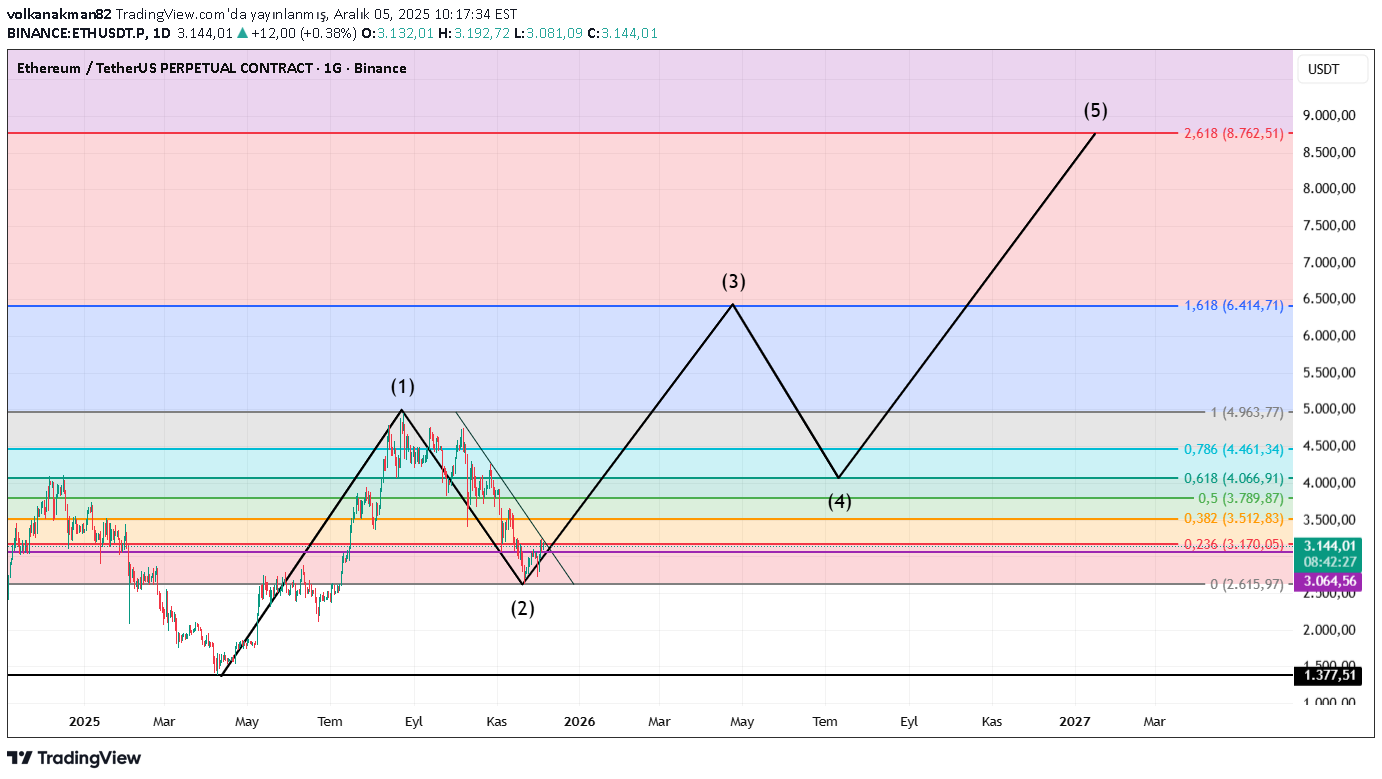
This is the graph that should be according to Fibonacci and Eliot. It does not contain investment advice, only technical analysis. let's see if Eth will realize this graph
volkanakman82
احتمال وقوع "الگوی خرس" بیت کوین؛ آیا سقوط به ۲۵ هزار دلار در راه است؟
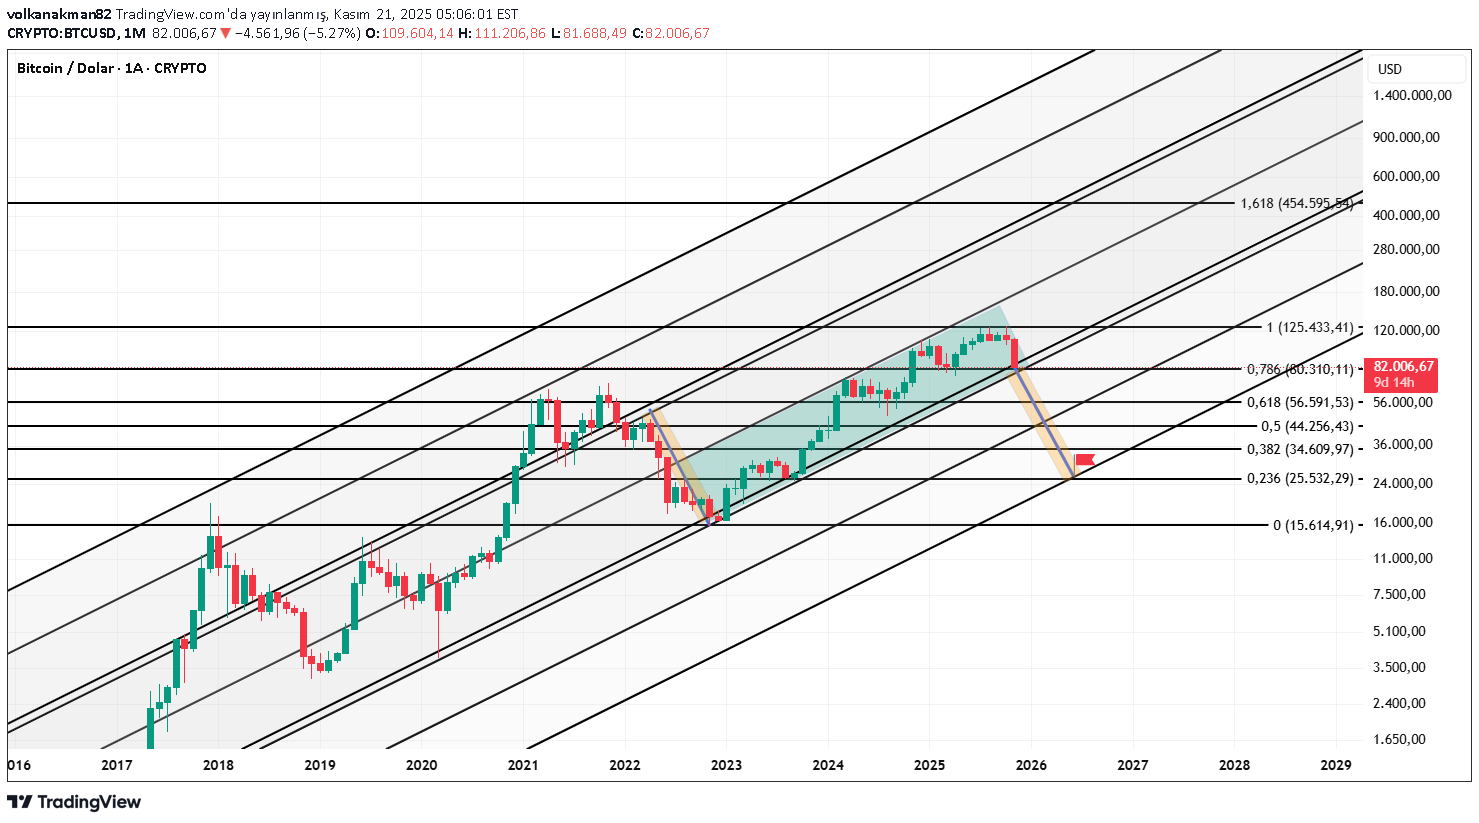
As can be seen in the chart, there is a 12-year trend of BTC above. 0.786 of the decrease from 125 thousand represents 80,300 USDT. If the month closes below 80,300, the Fibonacci values in the table will be active and perhaps the bear pennant in the table will become active. Let's wait and see if the target is 25,500.
volkanakman82
پیشبینی شگفتانگیز ZCash: هدف پنهان ۷۵۳۰ دلاری با سه سیگنال قوی!
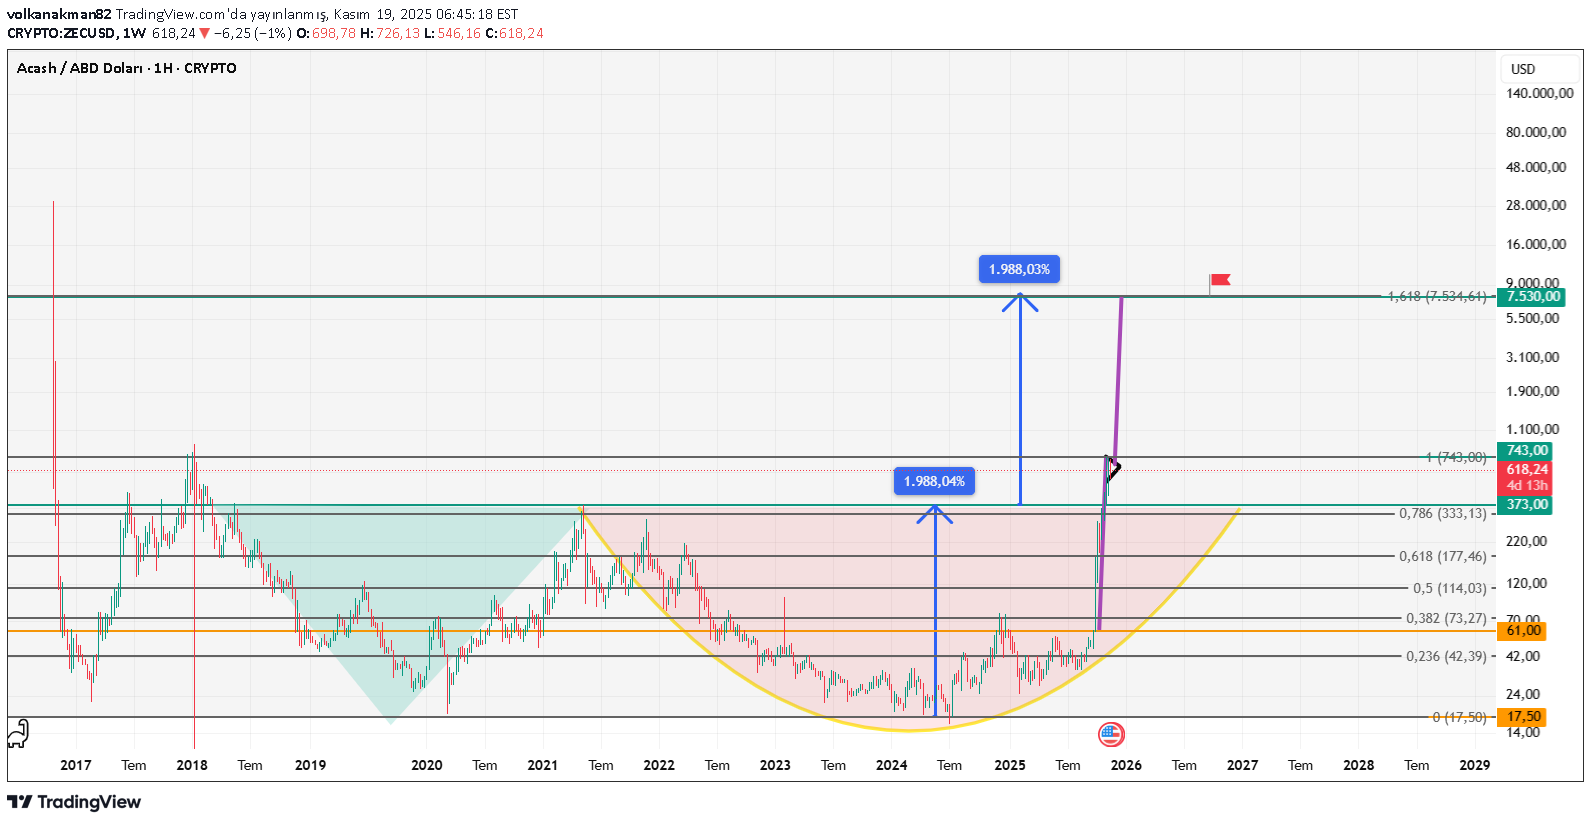
I think everyone who will read this article is very lucky and I find it appropriate to share it instead of keeping it to myself. You can believe in coincidences in life, but mathematics and geometry never occur by chance. Now read this article carefully and try to understand the language of numbers. All the numbers I will give are on a weekly chart, they do not contain precision or time information, but the probability of realization in the medium-long term is quite high unless there is a big black swan (World War 3, Covid, etc.). Apart from fundamental analysis, there are 3 main reasons why you should invest in Zec, purely technically; 1. The Adam Eve formation, which is clearly observed to occur on a weekly basis in the all time logarithmic (this detail is very important, you cannot see it in the normal chart) chart (those who do not know, can look it up on the internet) has a bottom level of 17.50 dollars, and the level at which the breakout of this formation was approved is 373 dollars. The depth of 373 at 17.50 offers us the formation target; The target of this depth is 7530 dollars! 2. Is it over? There is a very clear bull pennant formation on the weekly chart we are in. In this formation, the upper resistance is $ 743 and the length of the pennant extends to $ 61, where the hard movements begin. Assuming a weekly closing above 743, when you place the pennant pole between 61 and 743 on the small flag where the breakout will occur, the target given is again 7530 dollars. 3. Is it over? No, it's not over. 3rd and lastly, guess how many dollars the 1.618 target of the Fib correction we made with the help of Fibonacci, which shows us what targets it can reach from the current resistance of 743 dollars to 17.50, which is the lowest level, yes, the correct guess is 7530 dollars!! Especially my friends who have graphics and technical knowledge, you can confirm this. As I said at the beginning, there are no coincidences in Mathematics! So, what do you think, let's meet in the comments.
volkanakman82
آینده درخشان ZCASH (ZEC) در سالهای ۲۰۲۵ و ۲۰۲۶: آیا ستاره بازار خواهد بود؟
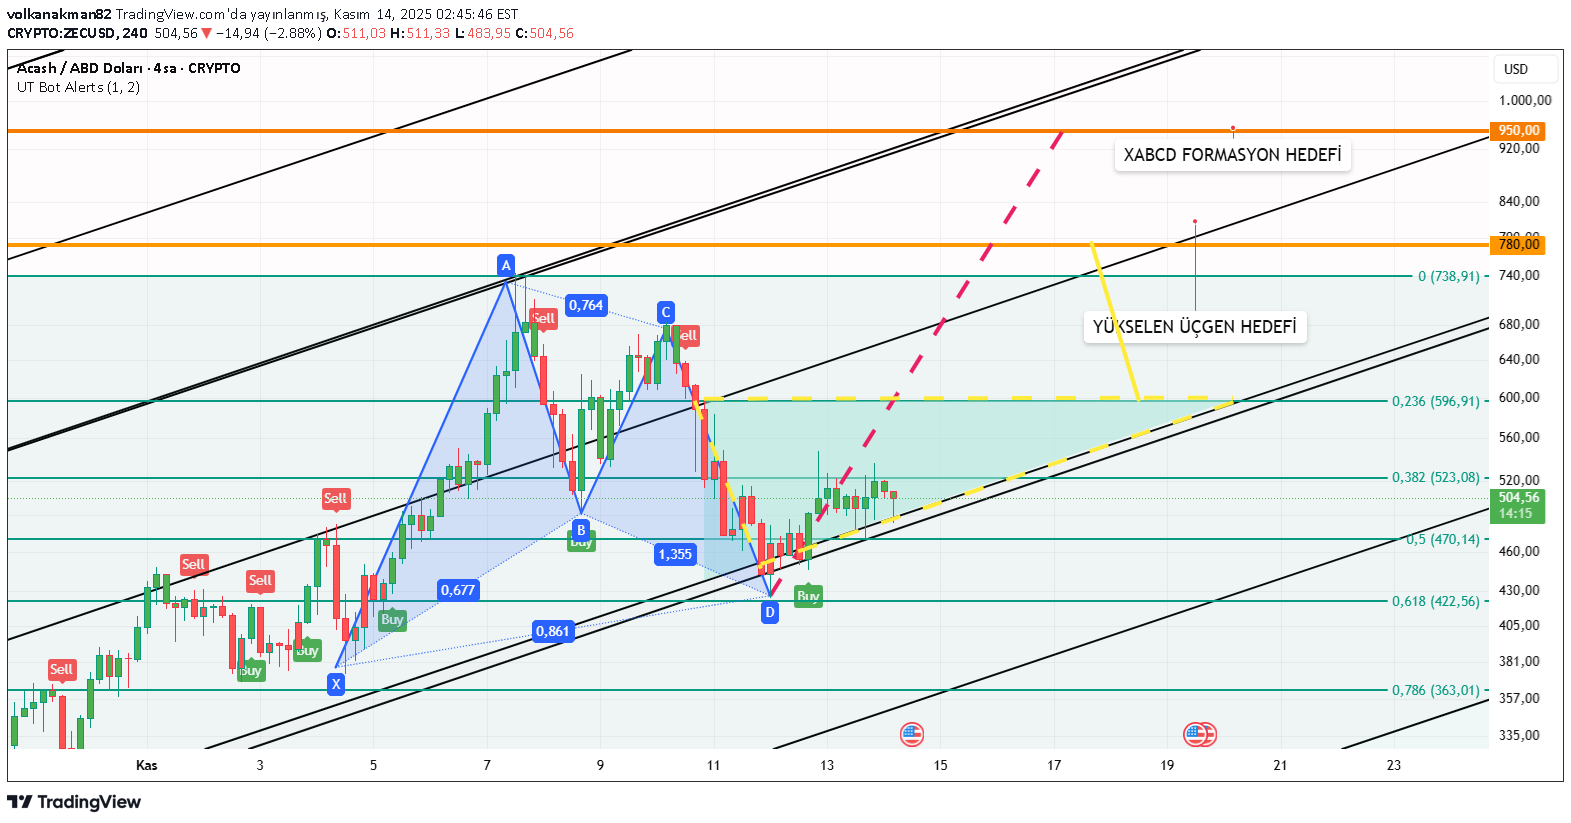
This year's star and next years' star candidate zcash (ZEC) will also receive approval after bullish formations and active breakouts, but it seems like the village does not want a guide. The chart is quite clear and I expect the targets of both the ascending triangle and xabcd formations to arrive. let's watch and see
volkanakman82
سناریوی سقوط بزرگ بیت کوین: آیا BTC به نقطه صفر برمیگردد؟
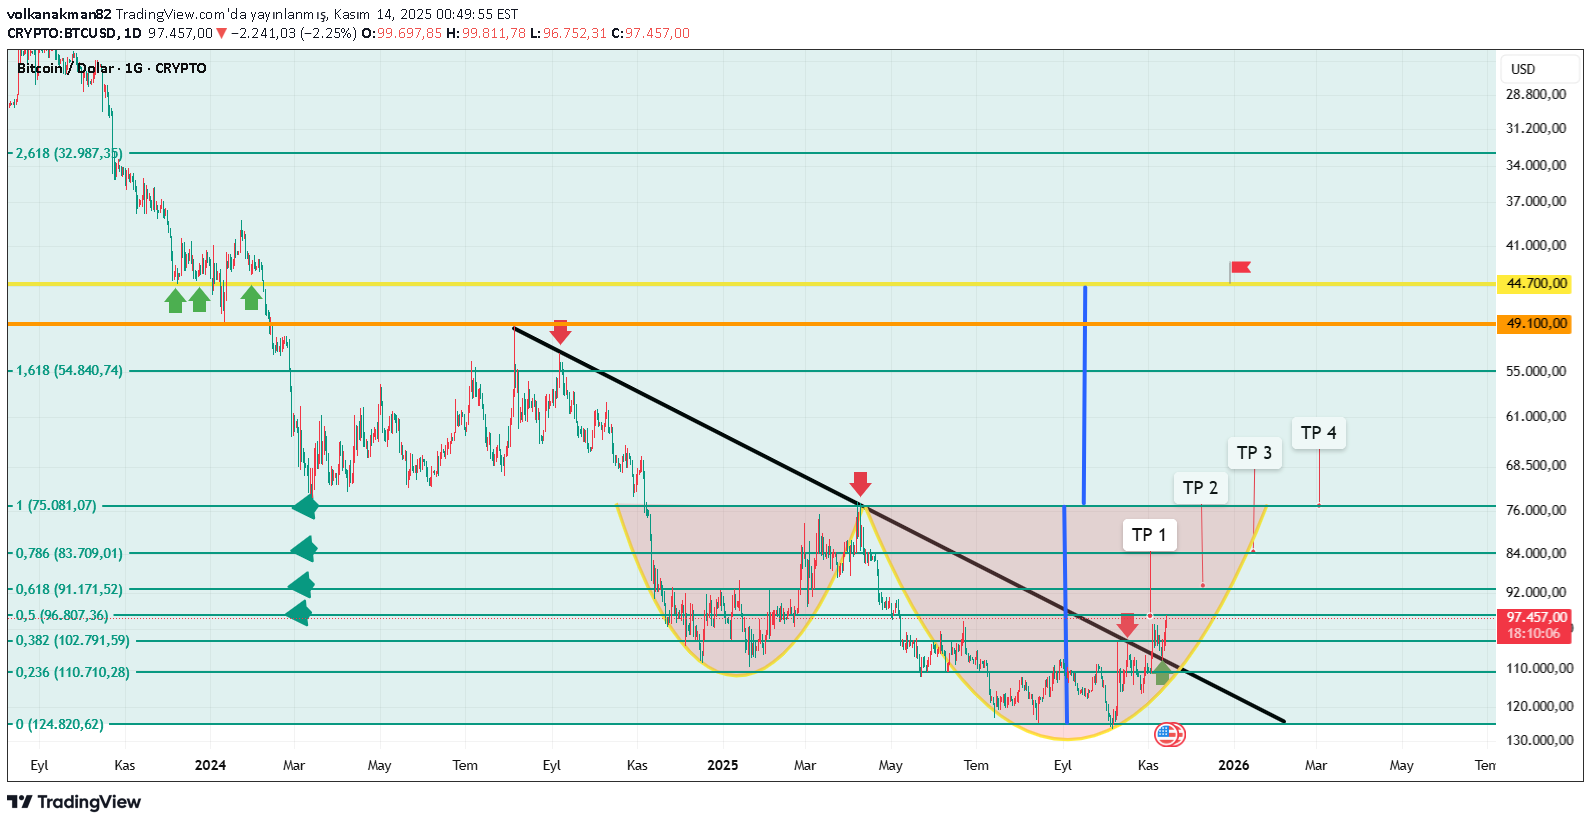
I wanted to convey to you the image that appears when I invert the BTC graph logarithmically. I have placed the decline Fibonacci targets in the story of the big upward wave starting from 49100 and extending to 124, to the left of the table. This rise gives an upward image when the chart is reversed and the trend is broken, retested and moving towards TP targets, the first peak Fibonacci 0.5 reached 96.800. Next is 0.618 value 91.170, then 0.786 value 83.700 and 1 main target is 75.000 USD. The main thing is what happens if there is a decline up to this point and the day closes below it, then the INVERTED CUP HANDLE formation that appears on the BTC normal chart will be active and the cup depth shows us that the decline may continue up to the 44,700 USD region. In summary, let's ask this question; BTC Will it go back to where it started?
volkanakman82
نقشه راه Zcash: تحلیل حرکات کانالی برای پیشبینی آینده قیمت!
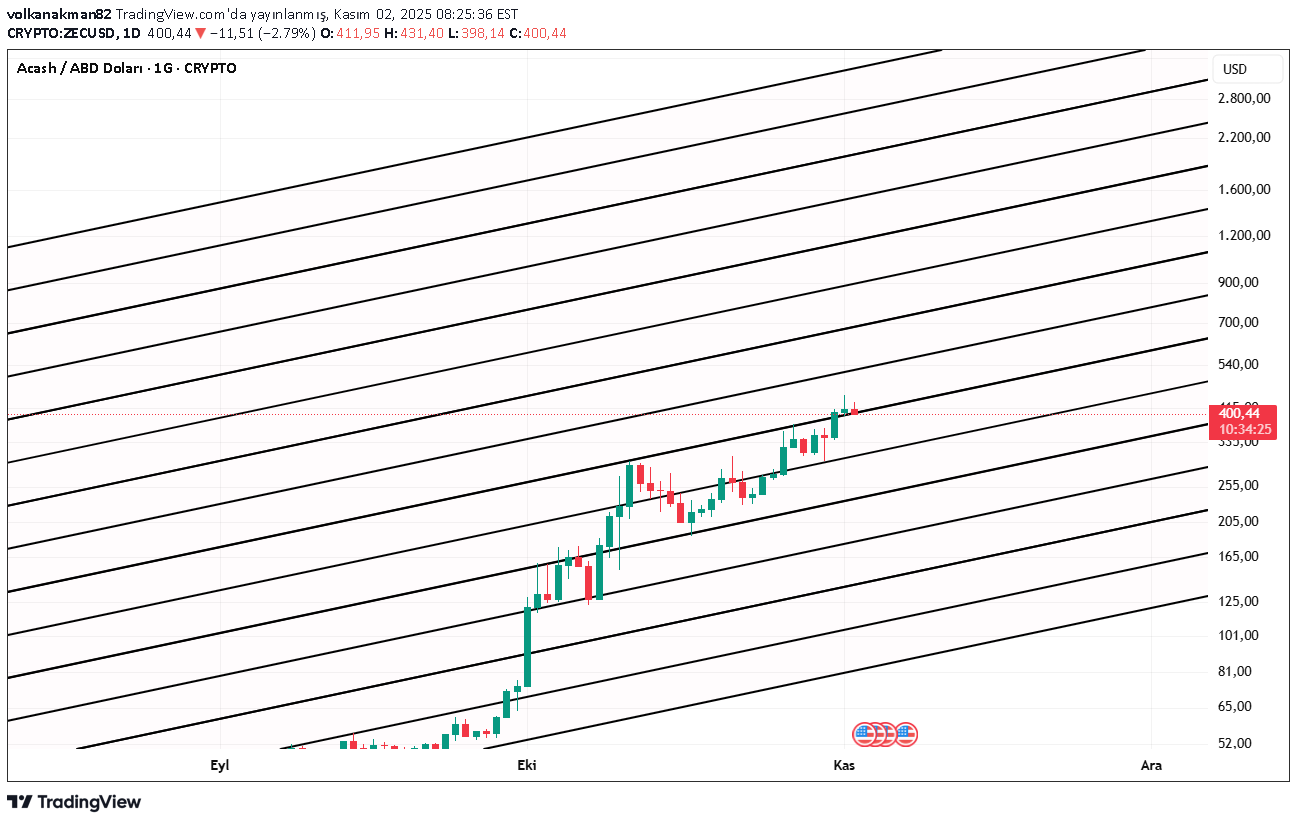
The channel chart I prepared based on daily candles is the road map of Zcash's journey. You can follow the movements in channel tops and channel bottoms accordingly. good luck
volkanakman82

Disclaimer
Any content and materials included in Sahmeto's website and official communication channels are a compilation of personal opinions and analyses and are not binding. They do not constitute any recommendation for buying, selling, entering or exiting the stock market and cryptocurrency market. Also, all news and analyses included in the website and channels are merely republished information from official and unofficial domestic and foreign sources, and it is obvious that users of the said content are responsible for following up and ensuring the authenticity and accuracy of the materials. Therefore, while disclaiming responsibility, it is declared that the responsibility for any decision-making, action, and potential profit and loss in the capital market and cryptocurrency market lies with the trader.