Technical analysis by volkanakman82 about Symbol BTC: Sell recommendation (11/14/2025)

volkanakman82
سناریوی سقوط بزرگ بیت کوین: آیا BTC به نقطه صفر برمیگردد؟
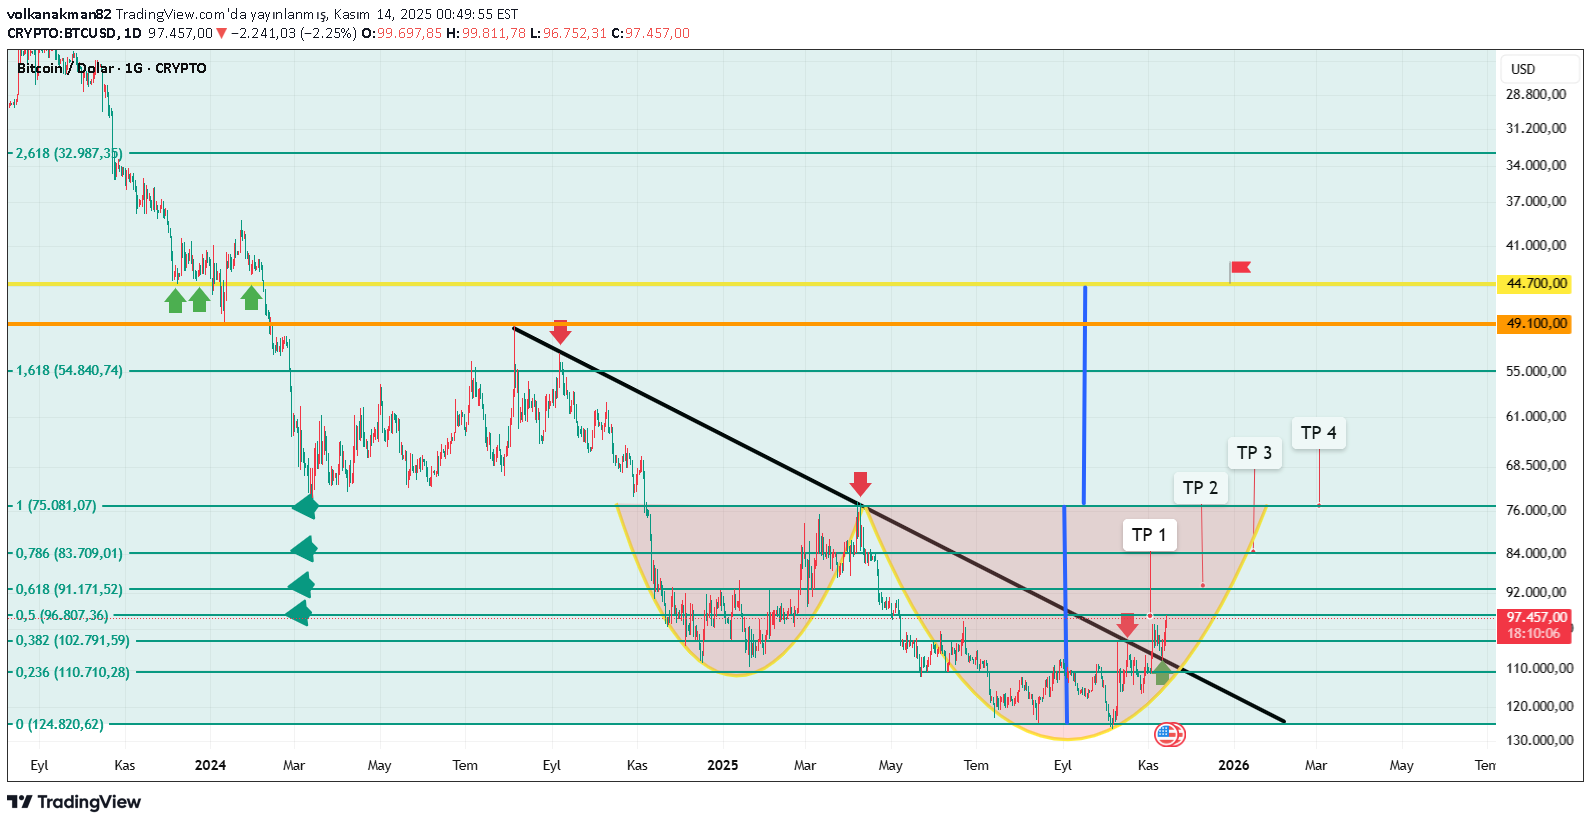
I wanted to convey to you the image that appears when I invert the BTC graph logarithmically. I have placed the decline Fibonacci targets in the story of the big upward wave starting from 49100 and extending to 124, to the left of the table. This rise gives an upward image when the chart is reversed and the trend is broken, retested and moving towards TP targets, the first peak Fibonacci 0.5 reached 96.800. Next is 0.618 value 91.170, then 0.786 value 83.700 and 1 main target is 75.000 USD. The main thing is what happens if there is a decline up to this point and the day closes below it, then the INVERTED CUP HANDLE formation that appears on the BTC normal chart will be active and the cup depth shows us that the decline may continue up to the 44,700 USD region. In summary, let's ask this question; BTC Will it go back to where it started?