
PERP
Perpetual Protocol
| تریدر | نوع سیگنال | حد سود/ضرر | زمان انتشار | مشاهده پیام |
|---|---|---|---|---|
No results found. | ||||
Price Chart of Perpetual Protocol
سود 3 Months :
سیگنالهای Perpetual Protocol
Filter
Sort messages by
Trader Type
Time Frame

BandForBands
صعود شگفتانگیز PERP: راز افزایش 650 درصدی در الگوی گوه نزولی!
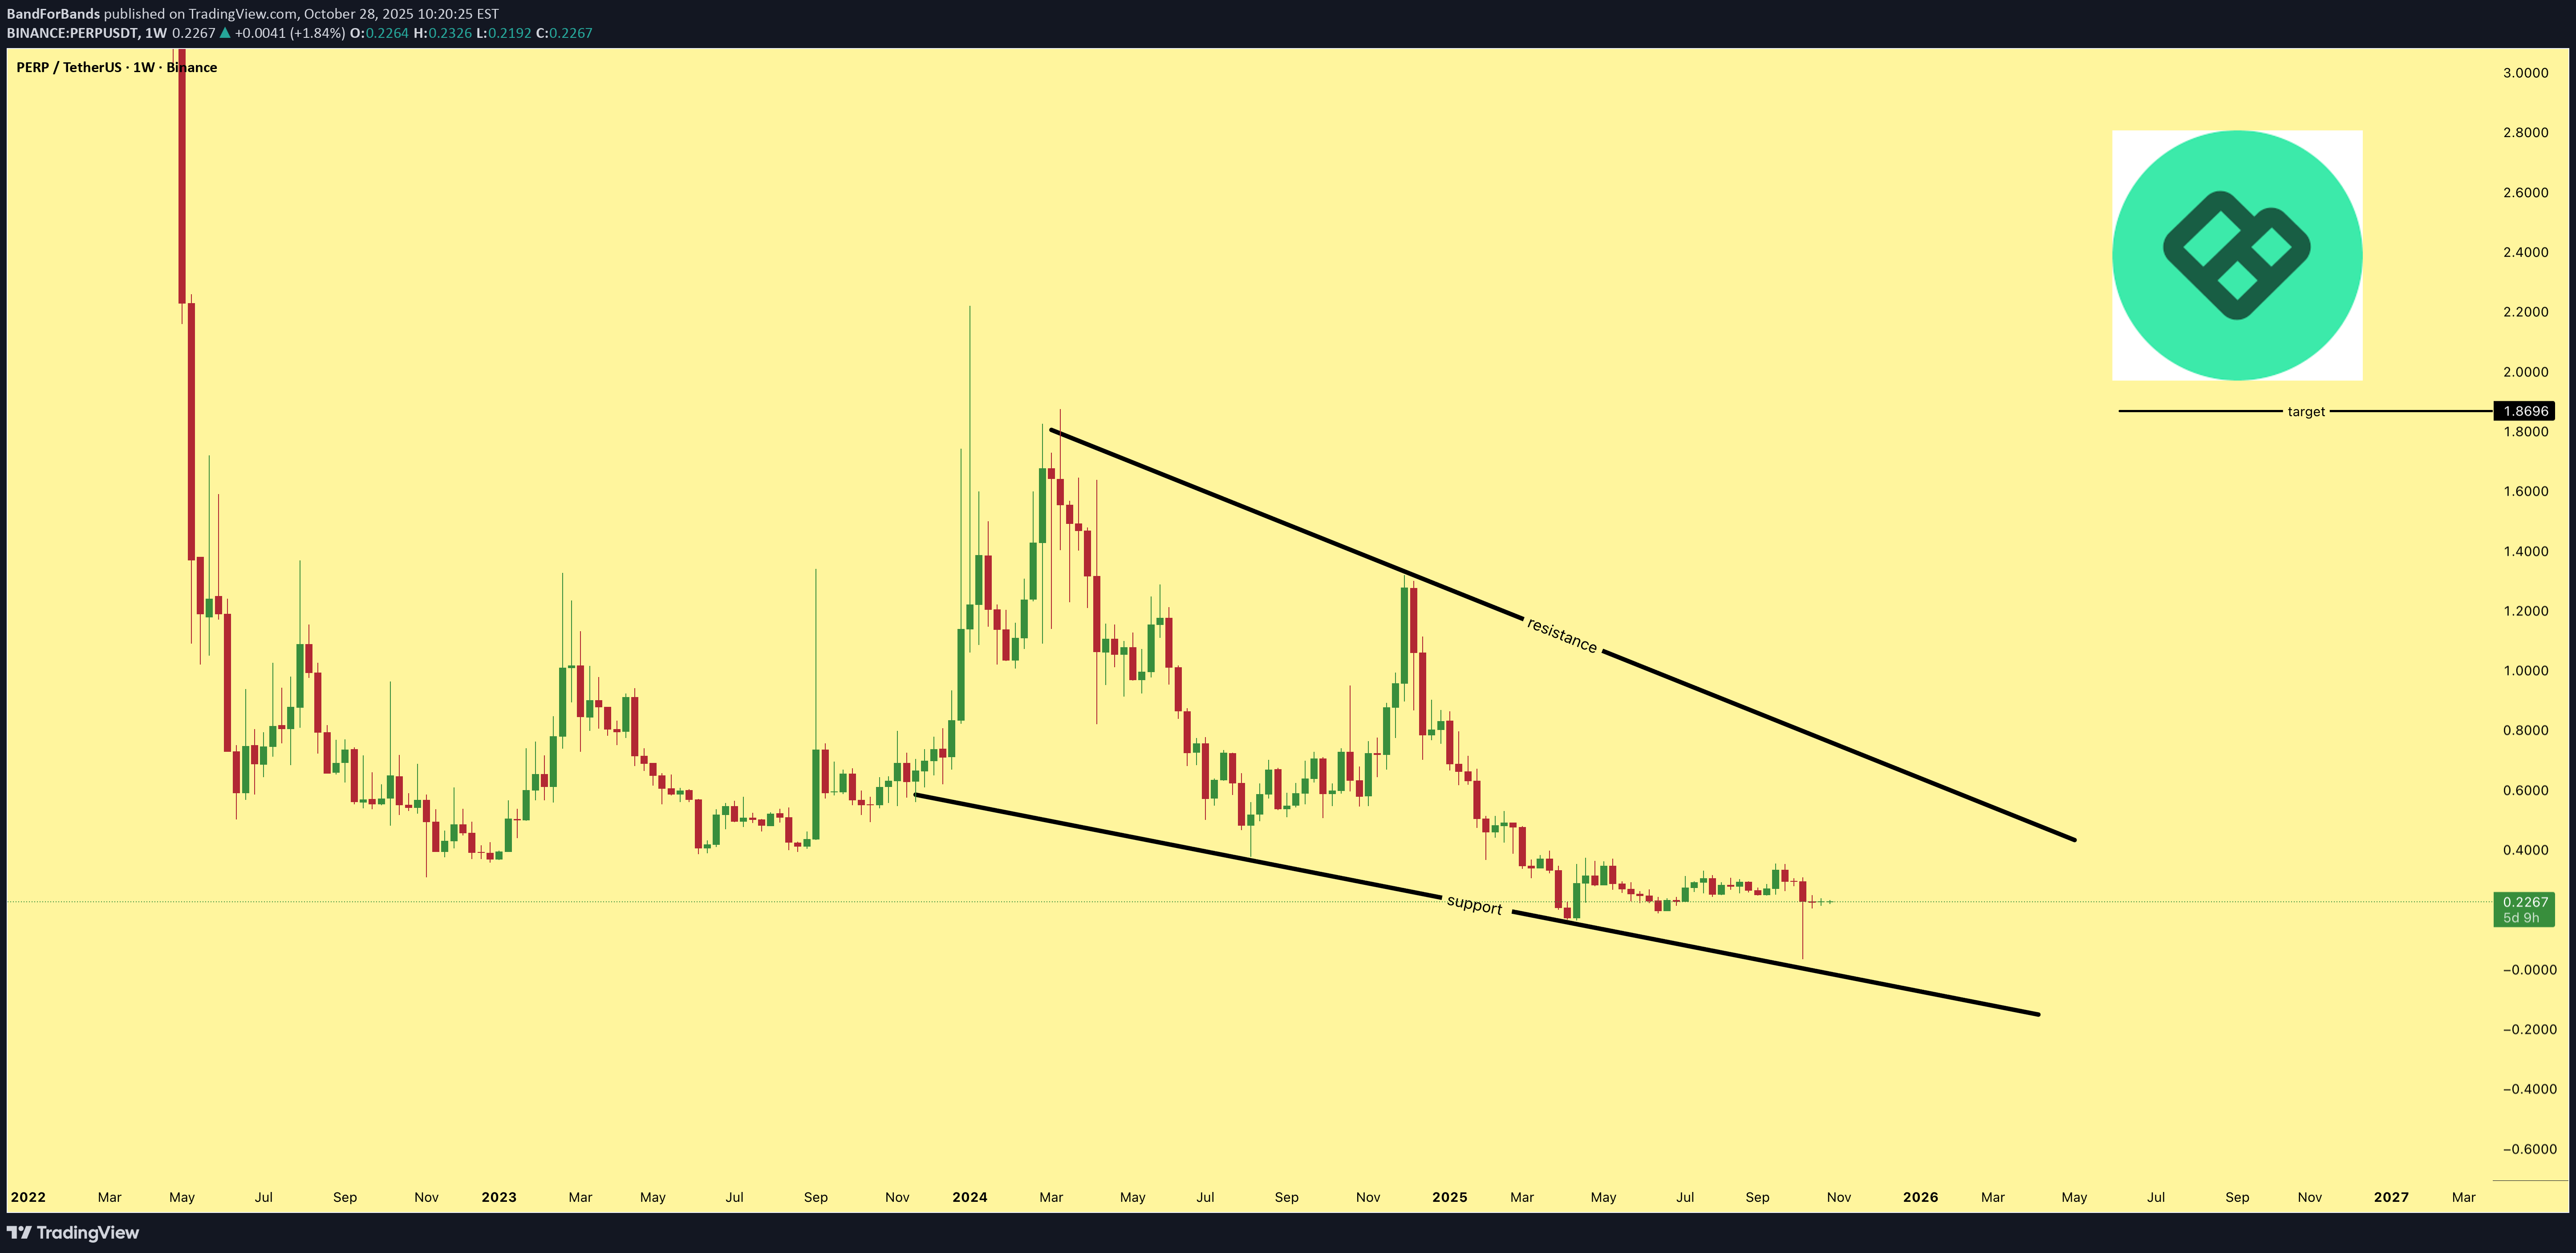
$PERP has developed a well-defined descending wedge pattern, often signaling a bullish reversal. A breakout from this structure could yield a potential 650% gain from the current price if supported by strong volume and sustained market momentum.

Ahmed_Zaid25
خرید PERPUSDT: استراتژی سود 200% و نقطه توقف امن برای هولد بلندمدت

buy some #perp and hodl target (50-200)% stop loss close daily below .2700

Bithereum_io
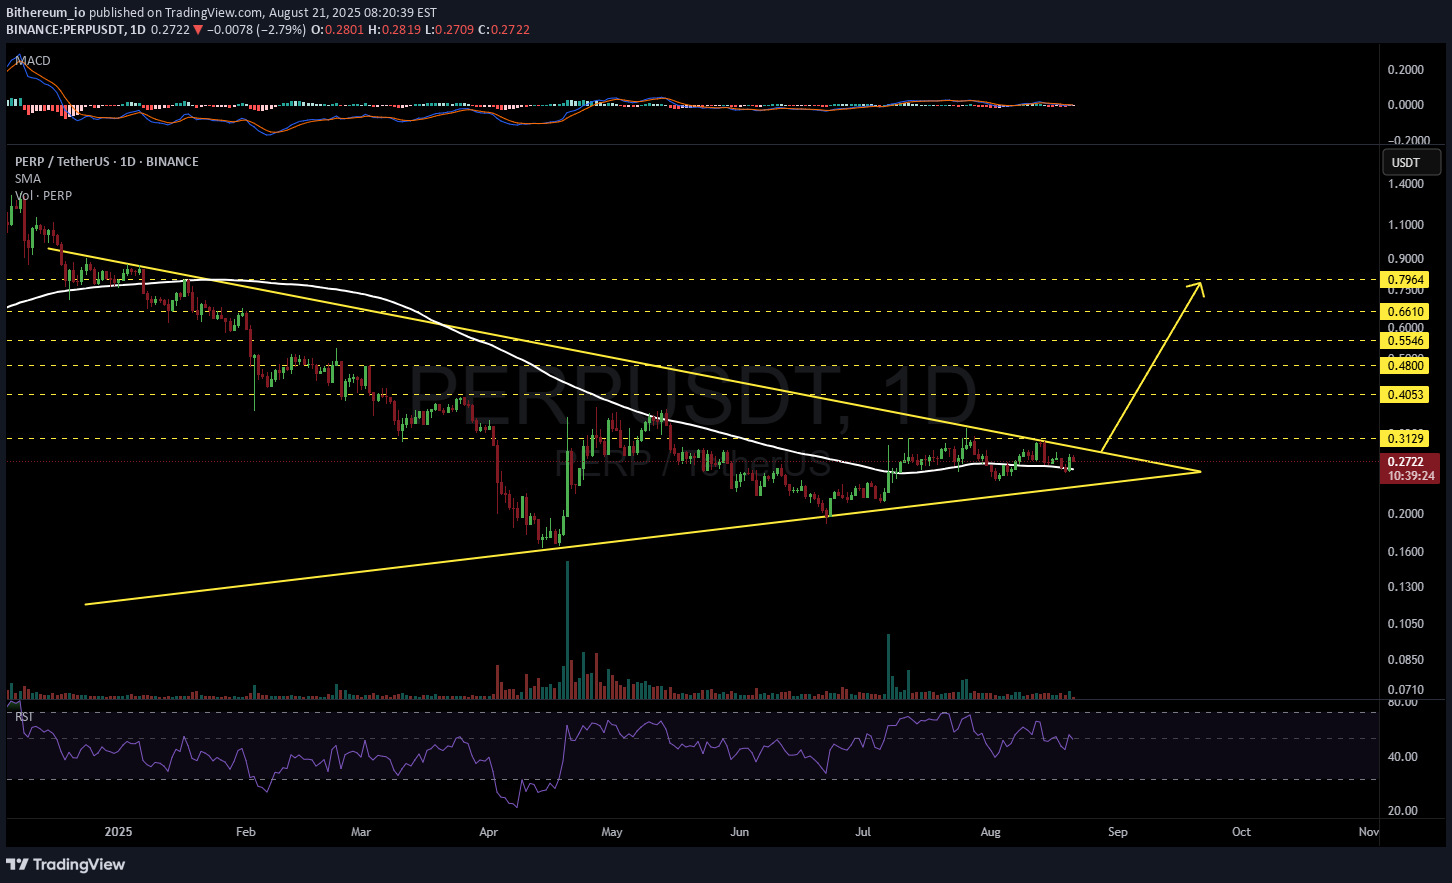
#PERP is moving inside a symmetrical triangle on the daily chart. For the bullish scenario, it must hold above the daily SMA100 and break above the triangle resistance. If this happens, the potential targets are: 🎯 $0.3129 🎯 $0.4053 🎯 $0.4800 🎯 $0.5546 🎯 $0.6610 🎯 $0.7964 ⚠️ As always, use a tight stop-loss and apply proper risk management.

Saliza08

PERPUSDT long PERPUSDT longPERPUSDT long PERPUSDT long PERPUSDT long

UmutTrades

The target is clear, the green line. But how you get there matters more than if you get there. 🧊 Inclusion Plan The blue boxes are where I’d consider entry. They’re not just price zones — they’re areas of alignment: Historical consolidation - Volume profile acceptance Footprint showing seller weakness Yes, you could enter earlier, but that wouldn’t be optimal. ✅ Smart Execution Wait for price to revisit the box with control. Watch CDV for demand confirmation, and structure reclaim on LTFs before committing. “You don’t win by being early. You win by being precise.” No chasing. No guessing. Just smart inclusion where the math makes sense. 📌I keep my charts clean and simple because I believe clarity leads to better decisions. 📌My approach is built on years of experience and a solid track record. I don’t claim to know it all but I’m confident in my ability to spot high-probability setups. 📌If you would like to learn how to use the heatmap, cumulative volume delta and volume footprint techniques that I use below to determine very accurate demand regions, you can send me a private message. I help anyone who wants it completely free of charge. 🔑I have a long list of my proven technique below: 🎯 ZENUSDT.P: Patience & Profitability | %230 Reaction from the Sniper Entry 🐶 DOGEUSDT.P: Next Move 🎨 RENDERUSDT.P: Opportunity of the Month 💎 ETHUSDT.P: Where to Retrace 🟢 BNBUSDT.P: Potential Surge 📊 BTC Dominance: Reaction Zone 🌊 WAVESUSDT.P: Demand Zone Potential 🟣 UNIUSDT.P: Long-Term Trade 🔵 XRPUSDT.P: Entry Zones 🔗 LINKUSDT.P: Follow The River 📈 BTCUSDT.P: Two Key Demand Zones 🟩 POLUSDT: Bullish Momentum 🌟 PENDLEUSDT.P: Where Opportunity Meets Precision 🔥 BTCUSDT.P: Liquidation of Highly Leveraged Longs 🌊 SOLUSDT.P: SOL's Dip - Your Opportunity 🐸 1000PEPEUSDT.P: Prime Bounce Zone Unlocked 🚀 ETHUSDT.P: Set to Explode - Don't Miss This Game Changer 🤖 IQUSDT: Smart Plan ⚡️ PONDUSDT: A Trade Not Taken Is Better Than a Losing One 💼 STMXUSDT: 2 Buying Areas 🐢 TURBOUSDT: Buy Zones and Buyer Presence 🌍 ICPUSDT.P: Massive Upside Potential | Check the Trade Update For Seeing Results 🟠 IDEXUSDT: Spot Buy Area | %26 Profit if You Trade with MSB 📌 USUALUSDT: Buyers Are Active + %70 Profit in Total 🌟 FORTHUSDT: Sniper Entry +%26 Reaction 🐳 QKCUSDT: Sniper Entry +%57 Reaction 📊 BTC.D: Retest of Key Area Highly Likely 📊 XNOUSDT %80 Reaction with a Simple Blue Box! 📊 BELUSDT Amazing %120 Reaction! 📊 Simple Red Box, Extraordinary Results 📊 TIAUSDT | Still No Buyers—Maintaining a Bearish Outlook 📊 OGNUSDT | One of Today’s Highest Volume Gainers – +32.44% 📊 TRXUSDT - I Do My Thing Again 📊 FLOKIUSDT - +%100 From Blue Box! 📊 SFP/USDT - Perfect Entry %80 Profit! 📊 [https://www.tradingview.com/chart/AAVEUSDT/RZ4eezbi-AAVEUSDT-Analysis-Retracement-Opportunity/]AAVEUSDT - WE DID IT AGAIN! I stopped adding to the list because it's kinda tiring to add 5-10 charts in every move but you can check my profile and see that it goes on..

Ren_MomentumTrader
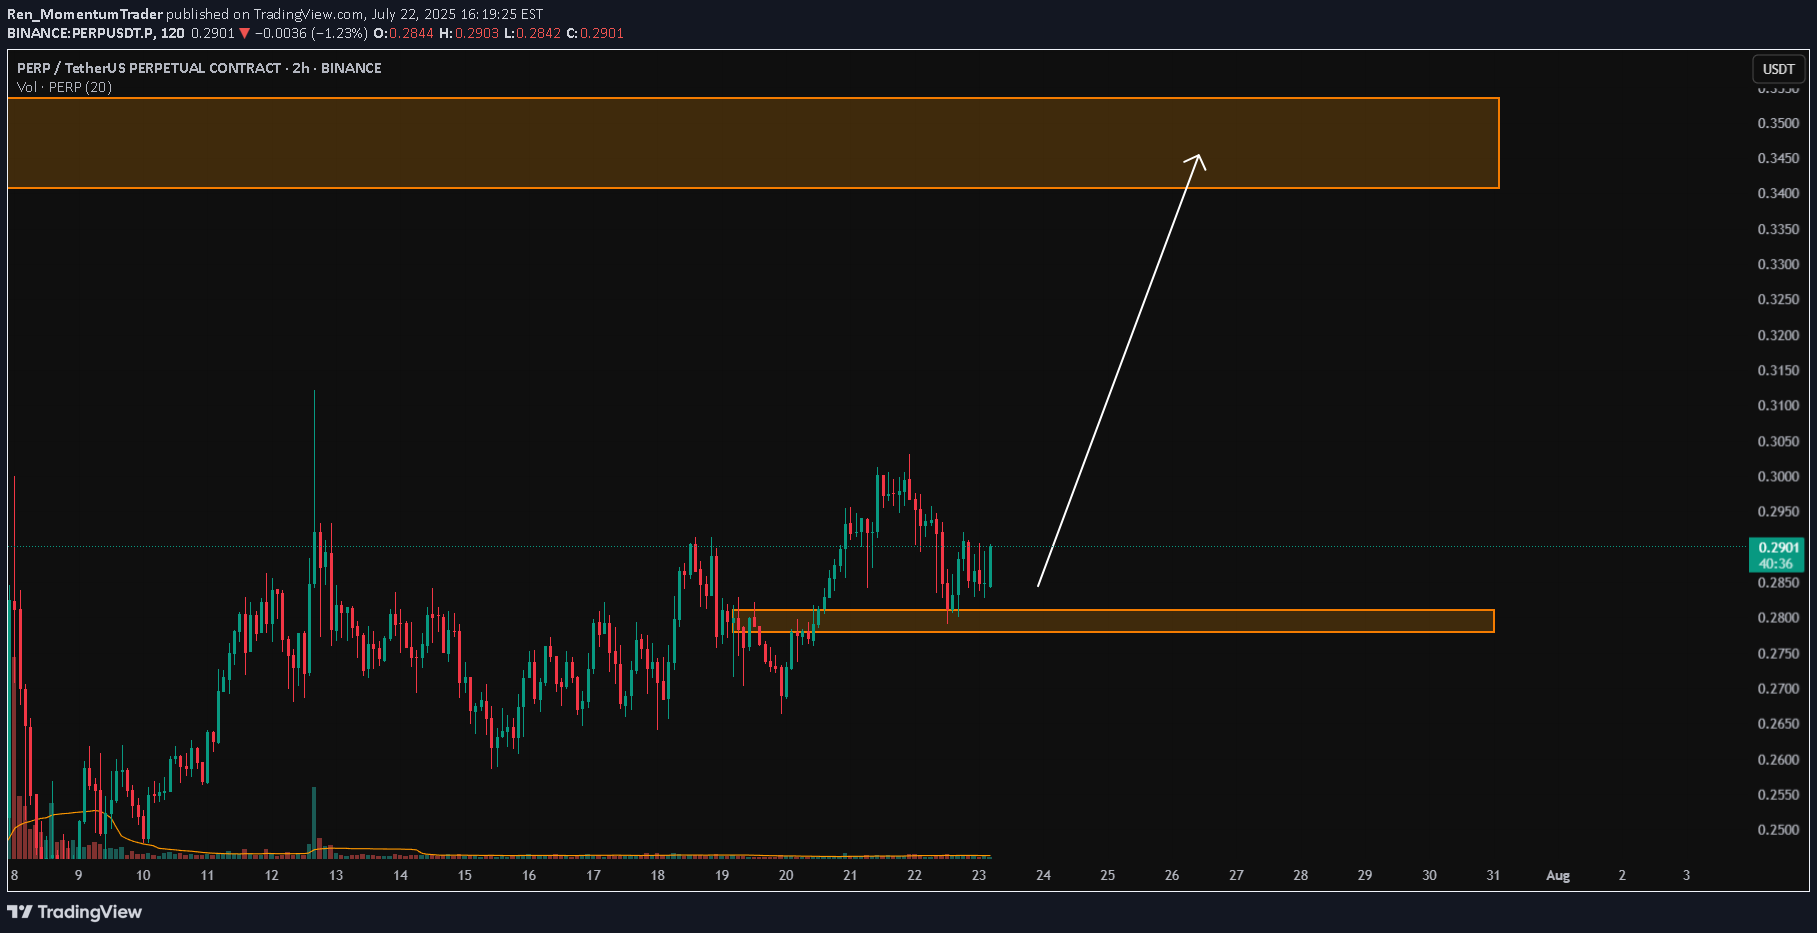
Key Level Zone: 0.2780 - 0.2810 LMT v2.0 detected. The setup looks promising—price previously trended upward with rising volume and momentum, then retested this zone cleanly. This presents an excellent reward-to-risk opportunity if momentum continues to align. Introducing LMT (Levels & Momentum Trading) - Over the past 3 years, I’ve refined my approach to focus more sharply on the single most important element in any trade: the KEY LEVEL. - While HMT (High Momentum Trading) served me well—combining trend, momentum, volume, and structure across multiple timeframes—I realized that consistently identifying and respecting these critical price zones is what truly separates good trades from great ones. - That insight led to the evolution of HMT into LMT – Levels & Momentum Trading. Why the Change? (From HMT to LMT) Switching from High Momentum Trading (HMT) to Levels & Momentum Trading (LMT) improves precision, risk control, and confidence by: - Clearer Entries & Stops: Defined key levels make it easier to plan entries, stop-losses, and position sizing—no more guesswork. - Better Signal Quality: Momentum is now always checked against a support or resistance zone—if it aligns, it's a stronger setup. - Improved Reward-to-Risk: All trades are anchored to key levels, making it easier to calculate and manage risk effectively. - Stronger Confidence: With clear invalidation points beyond key levels, it's easier to trust the plan and stay disciplined—even in tough markets. Whenever I share a signal, it’s because: - A high‐probability key level has been identified on a higher timeframe. - Lower‐timeframe momentum, market structure and volume suggest continuation or reversal is imminent. - The reward‐to‐risk (based on that key level) meets my criteria for a disciplined entry. ***Please note that conducting a comprehensive analysis on a single timeframe chart can be quite challenging and sometimes confusing. I appreciate your understanding of the effort involved. Important Note: The Role of Key Levels - Holding a key level zone: If price respects the key level zone, momentum often carries the trend in the expected direction. That’s when we look to enter, with stop-loss placed just beyond the zone with some buffer. - Breaking a key level zone: A definitive break signals a potential stop‐out for trend traders. For reversal traders, it’s a cue to consider switching direction—price often retests broken zones as new support or resistance. My Trading Rules (Unchanged) Risk Management - Maximum risk per trade: 2.5% - Leverage: 5x Exit Strategy / Profit Taking - Sell at least 70% on the 3rd wave up (LTF Wave 5). - Typically sell 50% during a high‐volume spike. - Move stop‐loss to breakeven once the trade achieves a 1.5:1 R:R. - Exit at breakeven if momentum fades or divergence appears. The market is highly dynamic and constantly changing. LMT signals and target profit (TP) levels are based on the current price and movement, but market conditions can shift instantly, so it is crucial to remain adaptable and follow the market's movement. If you find this signal/analysis meaningful, kindly like and share it. Thank you for your support~ Sharing this with love! From HMT to LMT: A Brief Version History HM Signal : Date: 17/08/2023 - Early concept identifying high momentum pullbacks within strong uptrends - Triggered after a prior wave up with rising volume and momentum - Focused on healthy retracements into support for optimal reward-to-risk setups HMT v1.0: Date: 18/10/2024 - Initial release of the High Momentum Trading framework - Combined multi-timeframe trend, volume, and momentum analysis. - Focused on identifying strong trending moves high momentum HMT v2.0: Date: 17/12/2024 - Major update to the Momentum indicator - Reduced false signals from inaccurate momentum detection - New screener with improved accuracy and fewer signals HMT v3.0: Date: 23/12/2024 - Added liquidity factor to enhance trend continuation - Improved potential for momentum-based plays - Increased winning probability by reducing entries during peaks HMT v3.1: Date: 31/12/2024 - Enhanced entry confirmation for improved reward-to-risk ratios HMT v4.0: Date: 05/01/2025 - Incorporated buying and selling pressure in lower timeframes to enhance the probability of trending moves while optimizing entry timing and scaling HMT v4.1: Date: 06/01/2025 - Enhanced take-profit (TP) target by incorporating market structure analysis HMT v5 : Date: 23/01/2025 - Refined wave analysis for trending conditions - Incorporated lower timeframe (LTF) momentum to strengthen trend reliability - Re-aligned and re-balanced entry conditions for improved accuracy HMT v6 : Date : 15/02/2025 - Integrated strong accumulation activity into in-depth wave analysis HMT v7 : Date : 20/03/2025 - Refined wave analysis along with accumulation and market sentiment HMT v8 : Date : 16/04/2025 - Fully restructured strategy logic HMT v8.1 : Date : 18/04/2025 - Refined Take Profit (TP) logic to be more conservative for improved win consistency LMT v1.0 : Date : 06/06/2025 - Rebranded to emphasize key levels + momentum as the core framework LMT v2.0 Date: 11/06/2025 - Fully restructured lower timeframe (LTF) momentum logic

Alpha-GoldFX
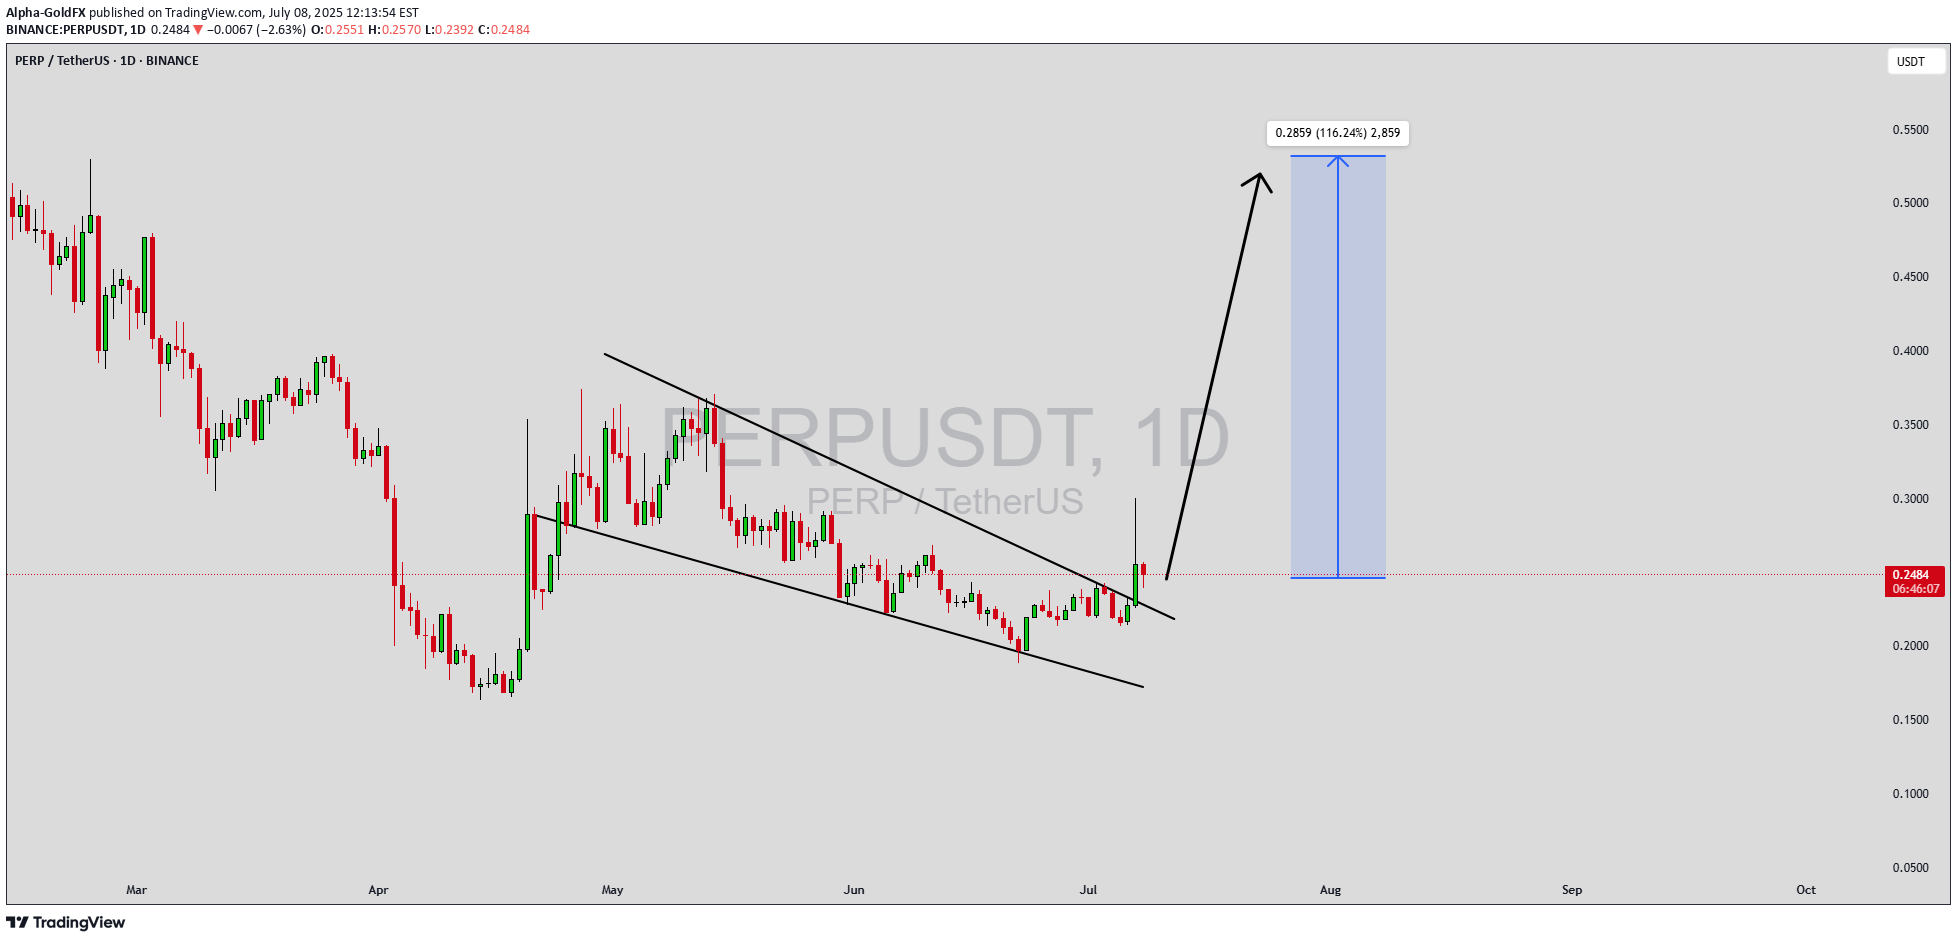
PREPUSDT is setting up for a promising move as it forms a textbook falling wedge pattern, a strong indicator that a bullish breakout could be imminent. Falling wedge patterns are known for signaling a shift in momentum from bearish to bullish, giving traders a clear opportunity to position themselves ahead of a potential uptrend. The structure of this pattern suggests that PREPUSDT could see gains in the range of 90% to 100%+, attracting significant attention from both swing traders and long-term investors.The volume profile around this breakout setup has been encouraging, with increasing buying interest hinting at renewed market confidence in this project. Sustained or growing volume during a breakout typically validates the strength of the move, helping to prevent false breakouts and providing momentum for follow-through buying. With volume confirming the technical setup, the chances of a successful breakout look increasingly favorable.Additionally, PREP’s underlying fundamentals and community support continue to evolve positively. With more investors recognizing its potential and actively accumulating positions, PREPUSDT stands out as a coin to watch closely in the current market cycle. As crypto sentiment improves and capital rotates into promising altcoins, projects like PREP with strong breakout patterns and growing investor interest can deliver remarkable returns.✅ Show your support by hitting the like button and✅ Leaving a comment below! (What is You opinion about this Coin)Your feedback and engagement keep me inspired to share more insightful market analysis with you!

BitBoy Crypto
✳️ Currency: #PERP /USDT Trading: Short ✖️ Lorij (lever): 7_10 💠 Login 1: 0.2147 Market 💠 Entry area 2: 0.2220 ✅Targtes: 1) 0.2129 2) 0.2107 3) 0.2076 4) 0.2028 5) 0.1961 6) 0.1885 Loss: 0.2295 💫 Rood with a maximum of 5% capital @Cryptomarket_bitboy

Kapitalist01
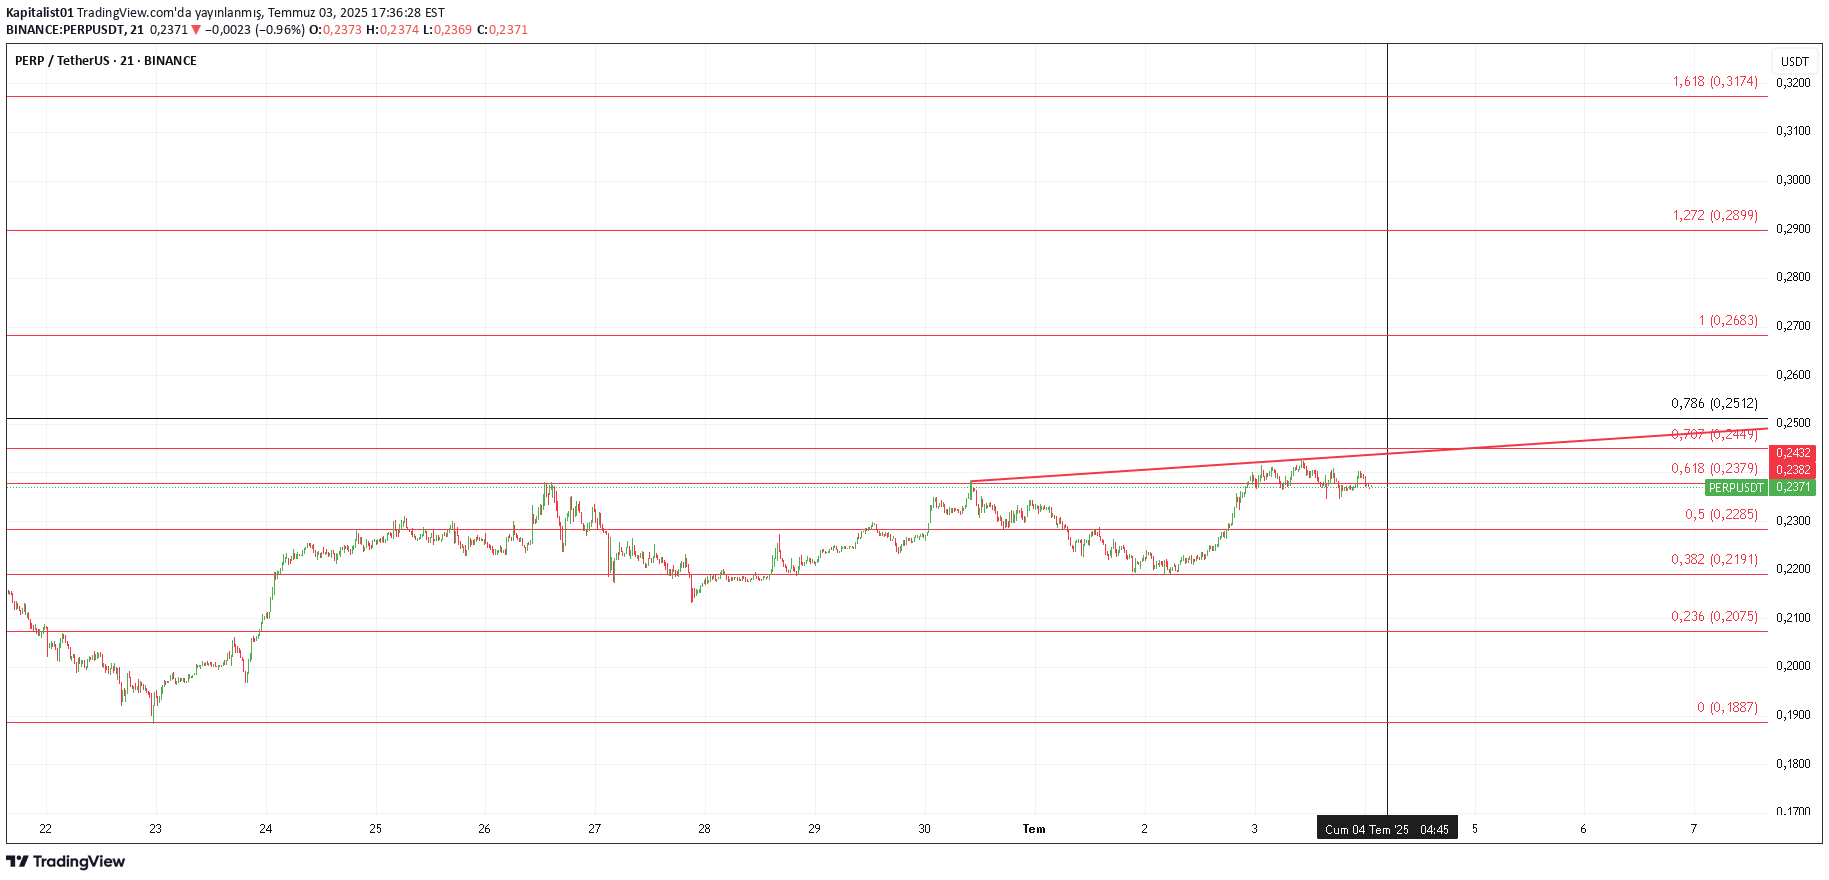
..........................................................................................................y.t.d

MastaCrypta
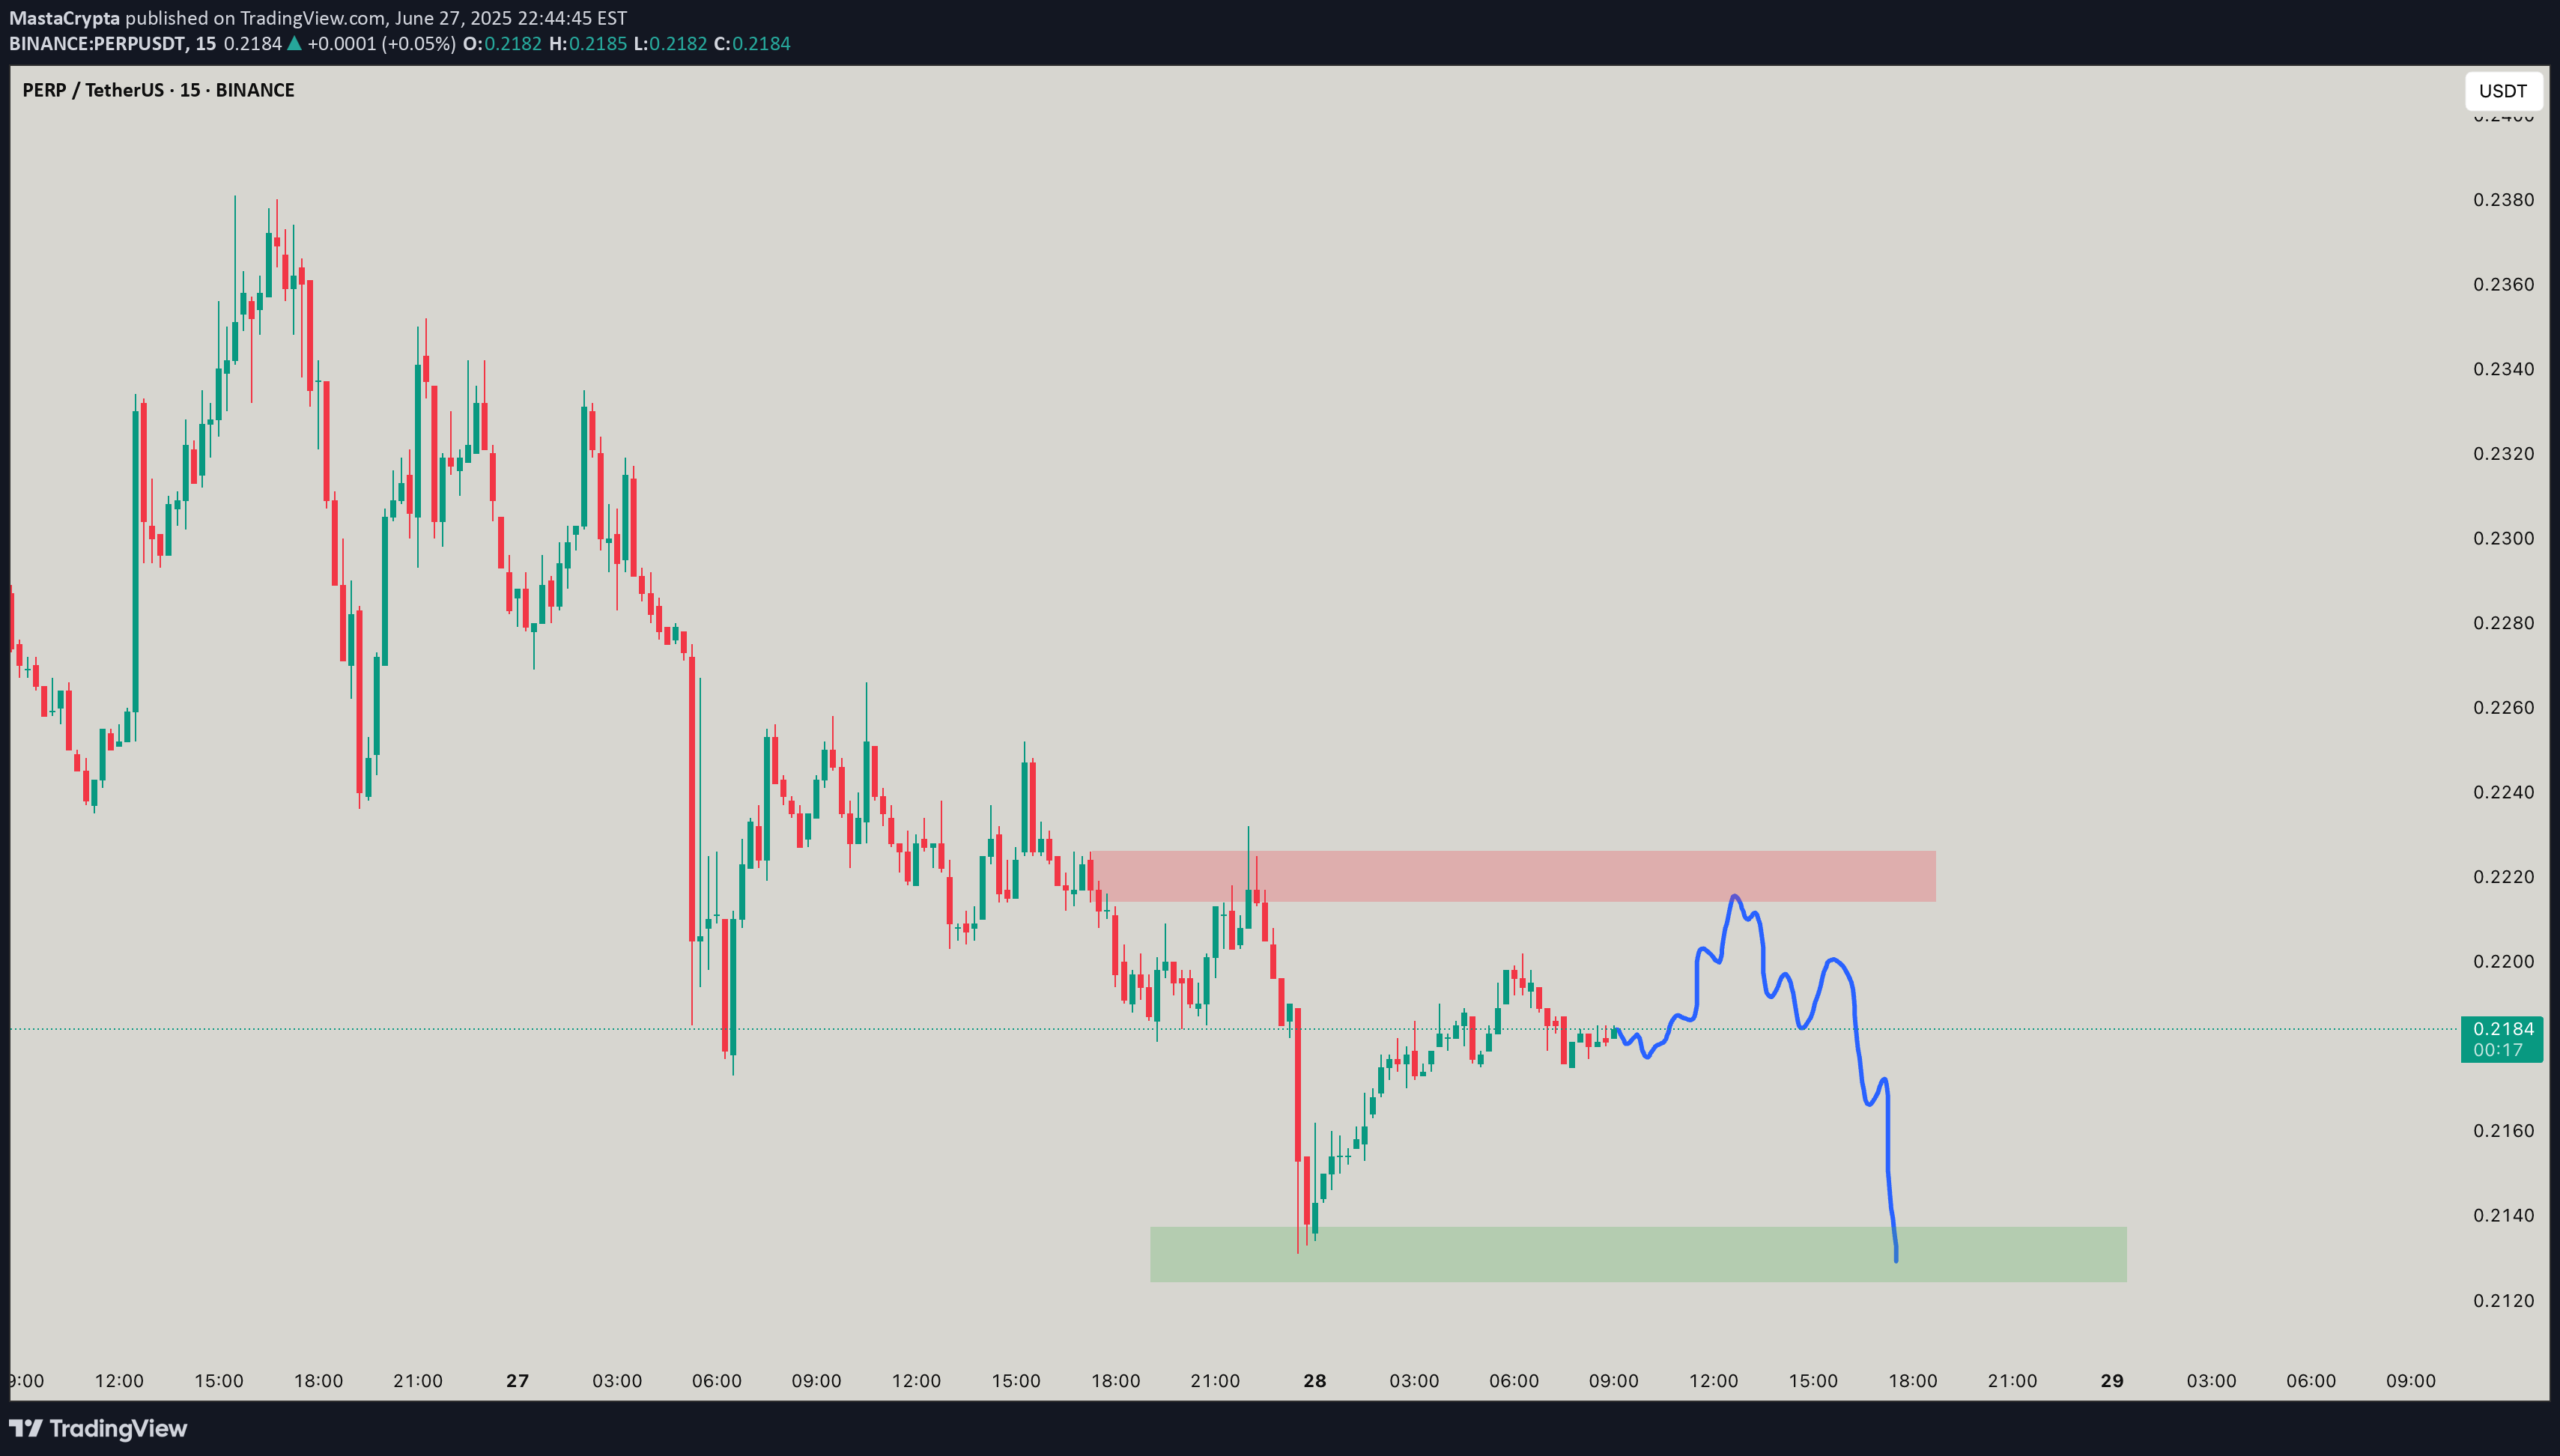
PErp looks like its aiming for a move to the tops and a move seems similar getting liq top to the fall
Disclaimer
Any content and materials included in Sahmeto's website and official communication channels are a compilation of personal opinions and analyses and are not binding. They do not constitute any recommendation for buying, selling, entering or exiting the stock market and cryptocurrency market. Also, all news and analyses included in the website and channels are merely republished information from official and unofficial domestic and foreign sources, and it is obvious that users of the said content are responsible for following up and ensuring the authenticity and accuracy of the materials. Therefore, while disclaiming responsibility, it is declared that the responsibility for any decision-making, action, and potential profit and loss in the capital market and cryptocurrency market lies with the trader.