
PEPE
Pepe
| تریدر | نوع سیگنال | حد سود/ضرر | زمان انتشار | مشاهده پیام |
|---|---|---|---|---|
 josemanuelmaestrerodriguezRank: 2134 | خرید | حد سود: تعیین نشده حد ضرر: تعیین نشده | 11/16/2025 | |
خرید | حد سود: تعیین نشده حد ضرر: تعیین نشده | 7 hour ago | ||
 RSI_Trading_pointRank: 2302 | خرید | حد سود: تعیین نشده حد ضرر: ۰ | 9/29/2025 |

معرفی پروژه پپه
Price Chart of Pepe
سود 3 Months :
خلاصه سیگنالهای Pepe
سیگنالهای Pepe
Filter
Sort messages by
Trader Type
Time Frame
تحلیل قیمت PEPE: آیا این میم کوین پس از سقوط، آماده انفجار است؟ (پیشبینی صعودی)
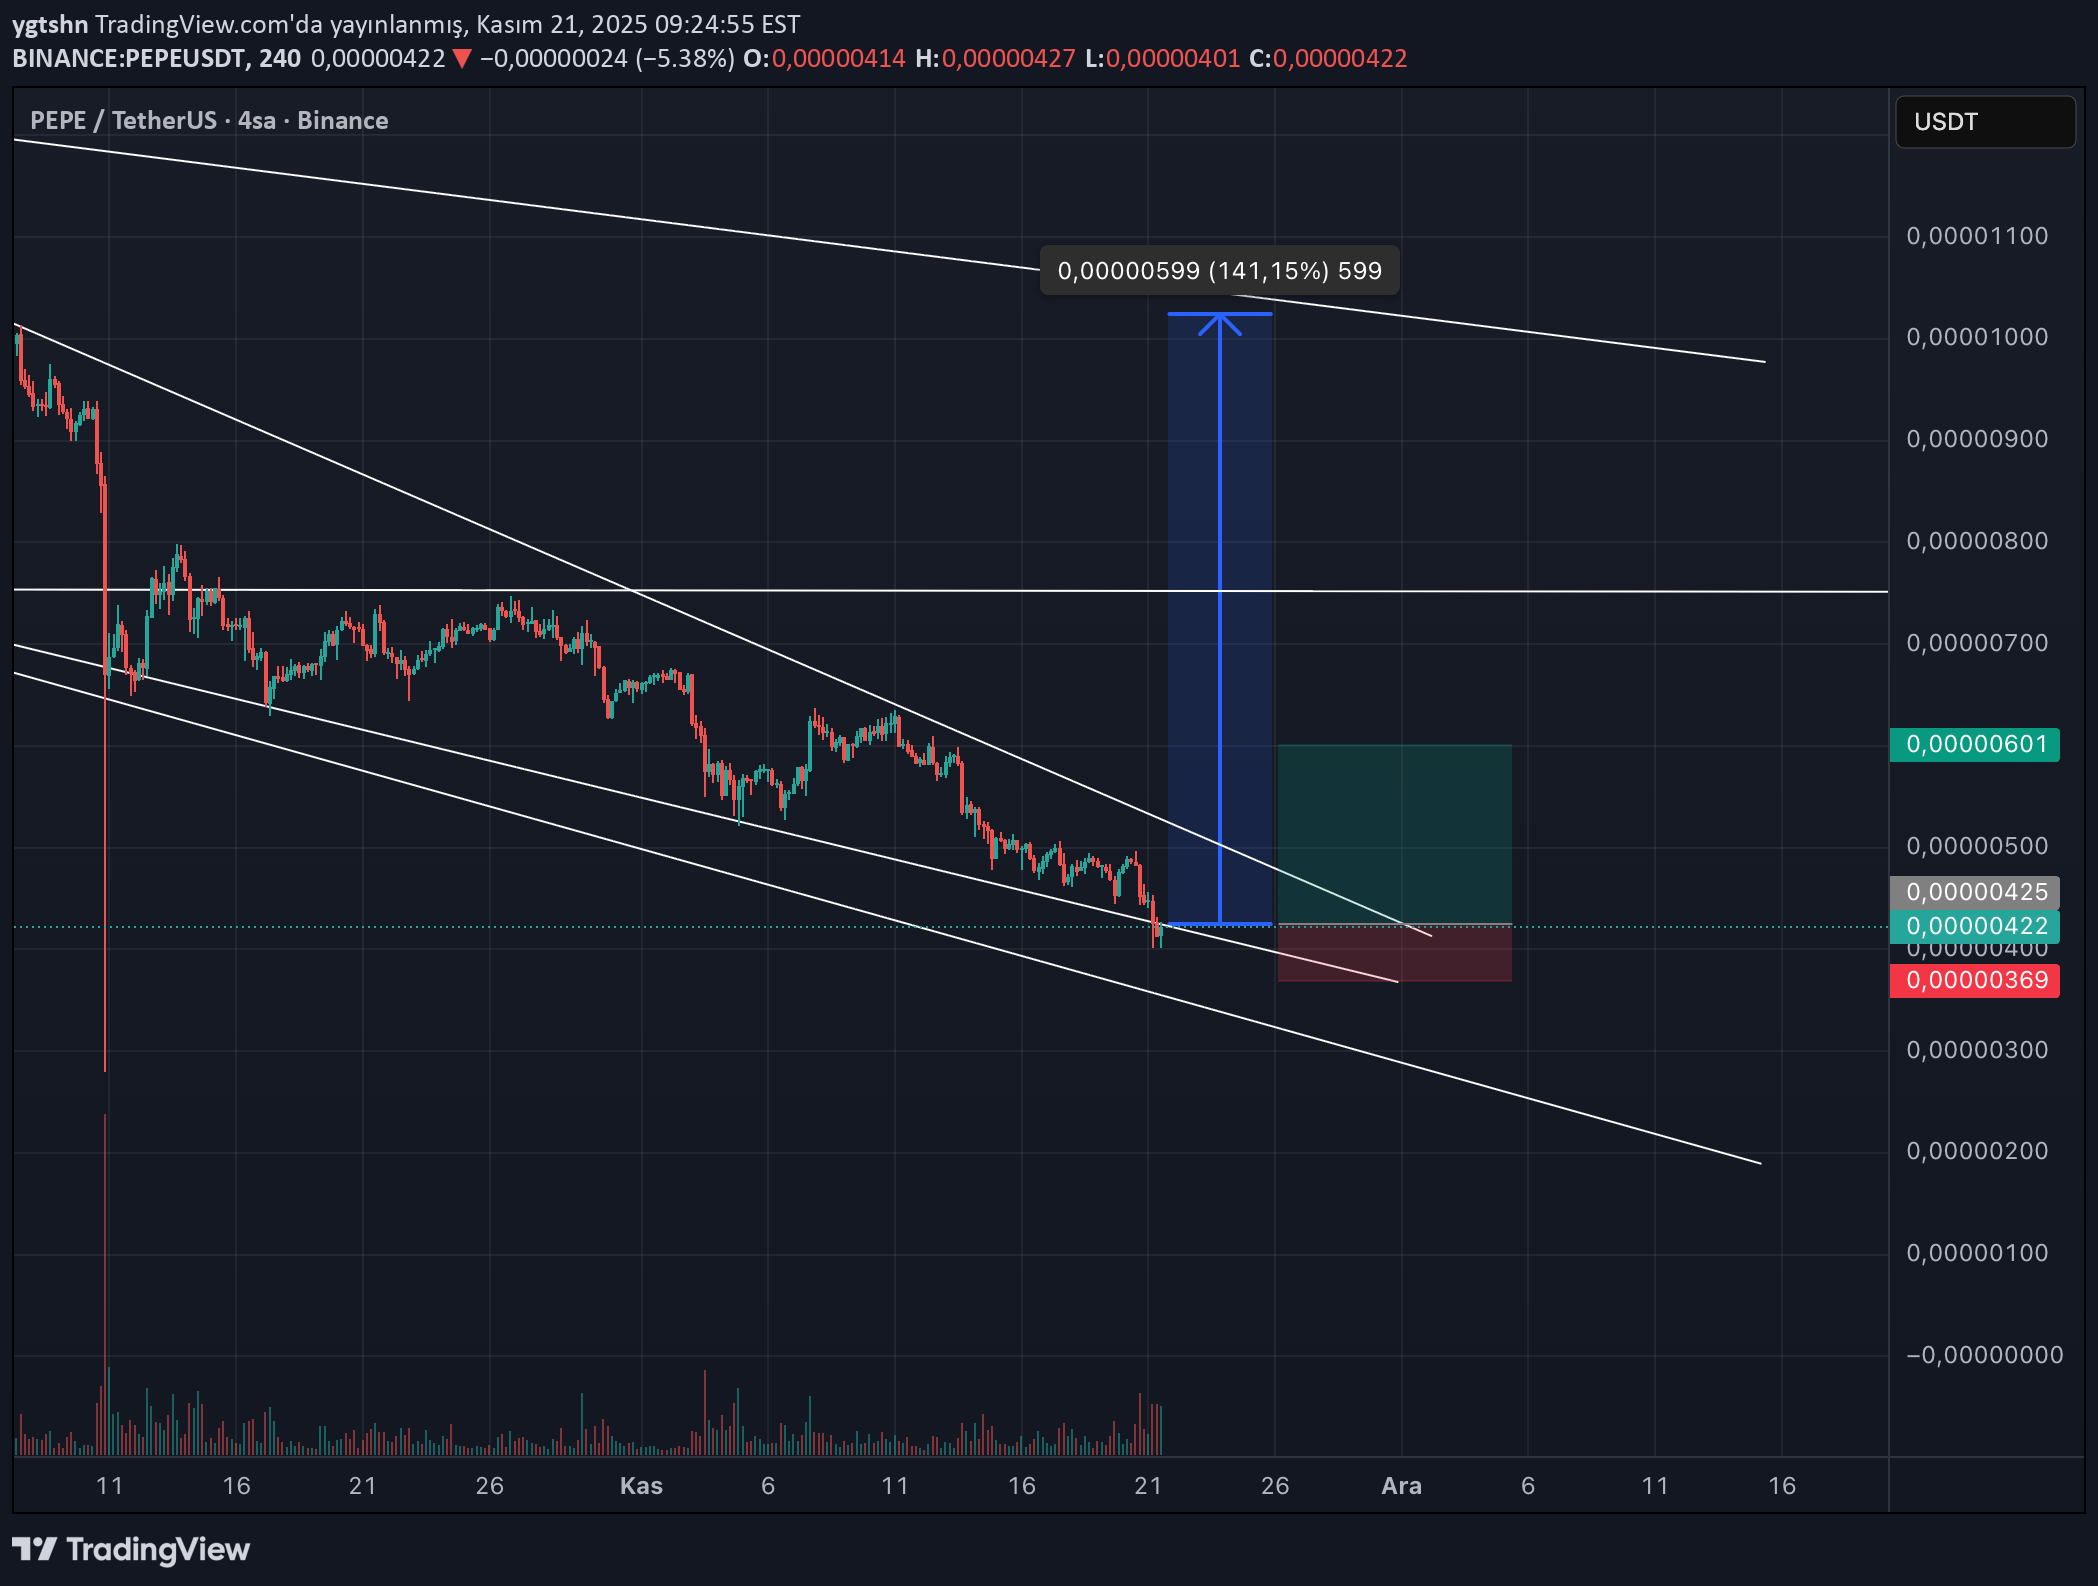
Pepe btc It has not been destroyed by the sharp decline of btc, it has no future left anyway. While it was above 0.02000 this time last year, it is currently in the 0.00400 band. Max. It would be 350 level and in a possible rally, 700, 1200 and so on will come. After selecting Trump max. It has hit 2800, which is an incredible buying point if it is to surpass this top. I do not find it safe to buy in the 800-900 band, there may be a risk in sharp market movements. I believe that pepe stands strong, it is a very profitable coin and moves fast, it depends on btc. btc He collects even if he collects, even in the rally. This is the only coin I trust. YTD are my personal opinions.

TheHunters_Company
استراتژی پیشرفته: شناسایی دقیق پایان روند صعودی و کسب سود ۷۰٪ موفقیت!
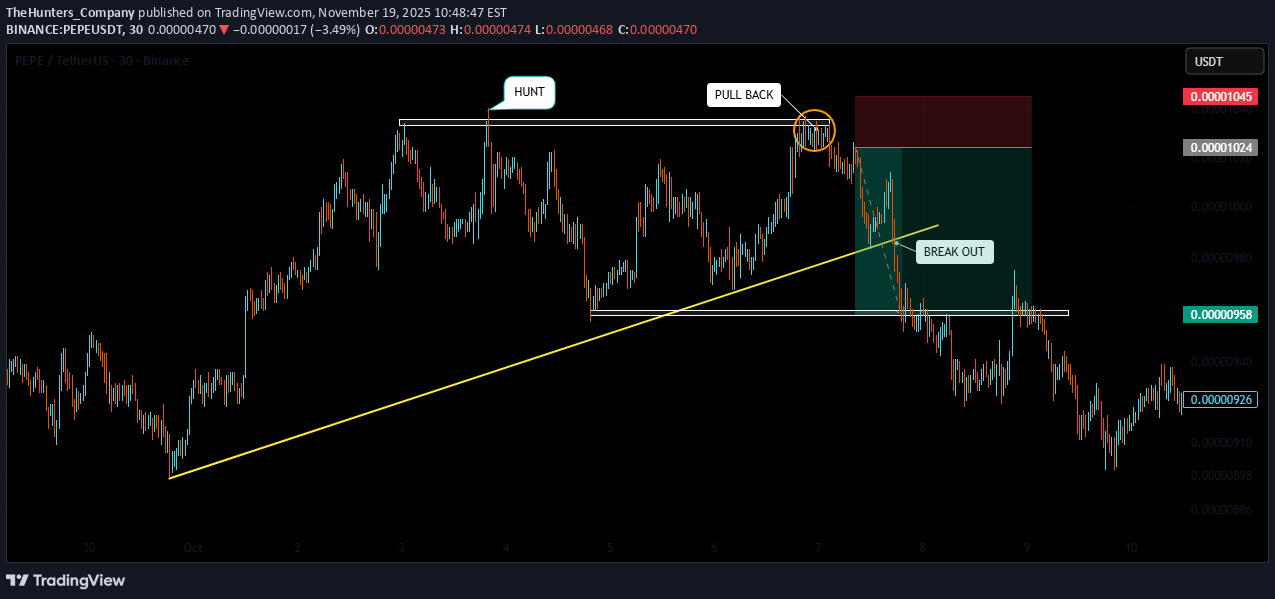
Hello friends We are back with another tutorial. This time we are going to tell you a more advanced strategy. Well, when a trend or structure forms, it doesn't matter whether it's bullish or bearish. In our example, it's an bullish structure. You should be careful that every structure eventually ends, and this ending has a series of signs. In this strategy, we'll teach you what those signs are and how to enter a trade and make a profit. Well, as you can see, the buyers raised the price, and considering the higher ceilings and floors, we can tell that our structure is bullish and the buyers' hand is strong... Here we are waiting for buyers to weaken, which is the important moment when, after hitting a ceiling, sellers push the price down, and you think that the structure has changed and enter a sell trade, placing your stop loss above the spike and waiting for the structure to change. This is where the buyers come in and make their final move, hunting the previous high and your stop loss is triggered. What to do now? So, as we said, when you see the weakness of the structure, draw a resistance level like the level we have specified for you. Now the price is falling from the ceiling and we are just waiting and when the price reaches the level again and cannot stabilize above our level and does not have the strength, so to speak, our level is hunted and the price falls, we do not expect to be able to enter the trade right there Because we need more confirmations. So the price comes back and reaches our level, which we call a pullback. At this point, we must be very careful that the price weakens before our level or weakens at the level and cannot stabilize higher prices. This is where we enter the trade and our stop loss is placed exactly behind the hunted ceiling. The target can also be the first price bottom and then, if the sellers are strong, lower bottoms... Be careful that the win rate of this strategy is 70. Be sure to observe risk and capital management. *Trade safely with us*Note that if our trend line breaks and the entire structure changes, we can make our trade risk-free and move with it as long as the sellers have power.

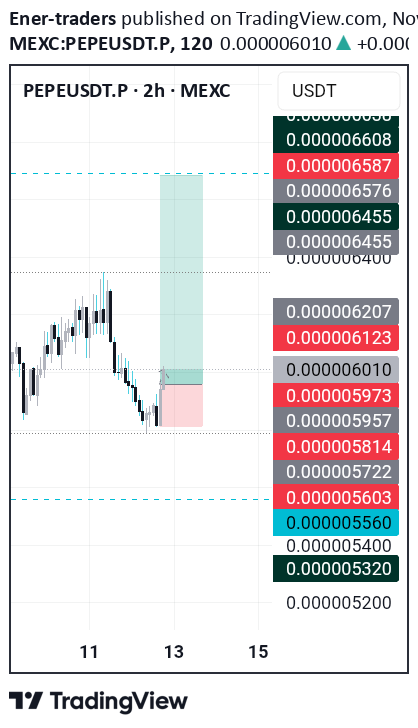
Ener-traders
پپه در آستانه جهش بزرگ؛ آیا این حرکت صعودی ادامه دارد؟
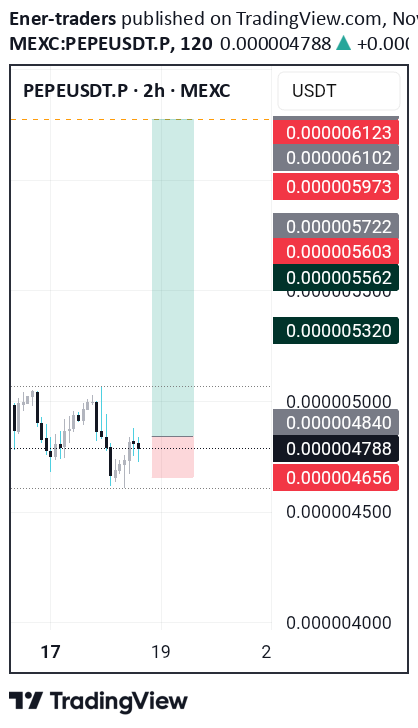
PEPE is making a bullish candle so I am certain that this momentum will continue
josemanuelmaestrerodriguez
خط روند نزولی بیت کوین صعودی شد! آماده انفجار قیمتی شوید؟
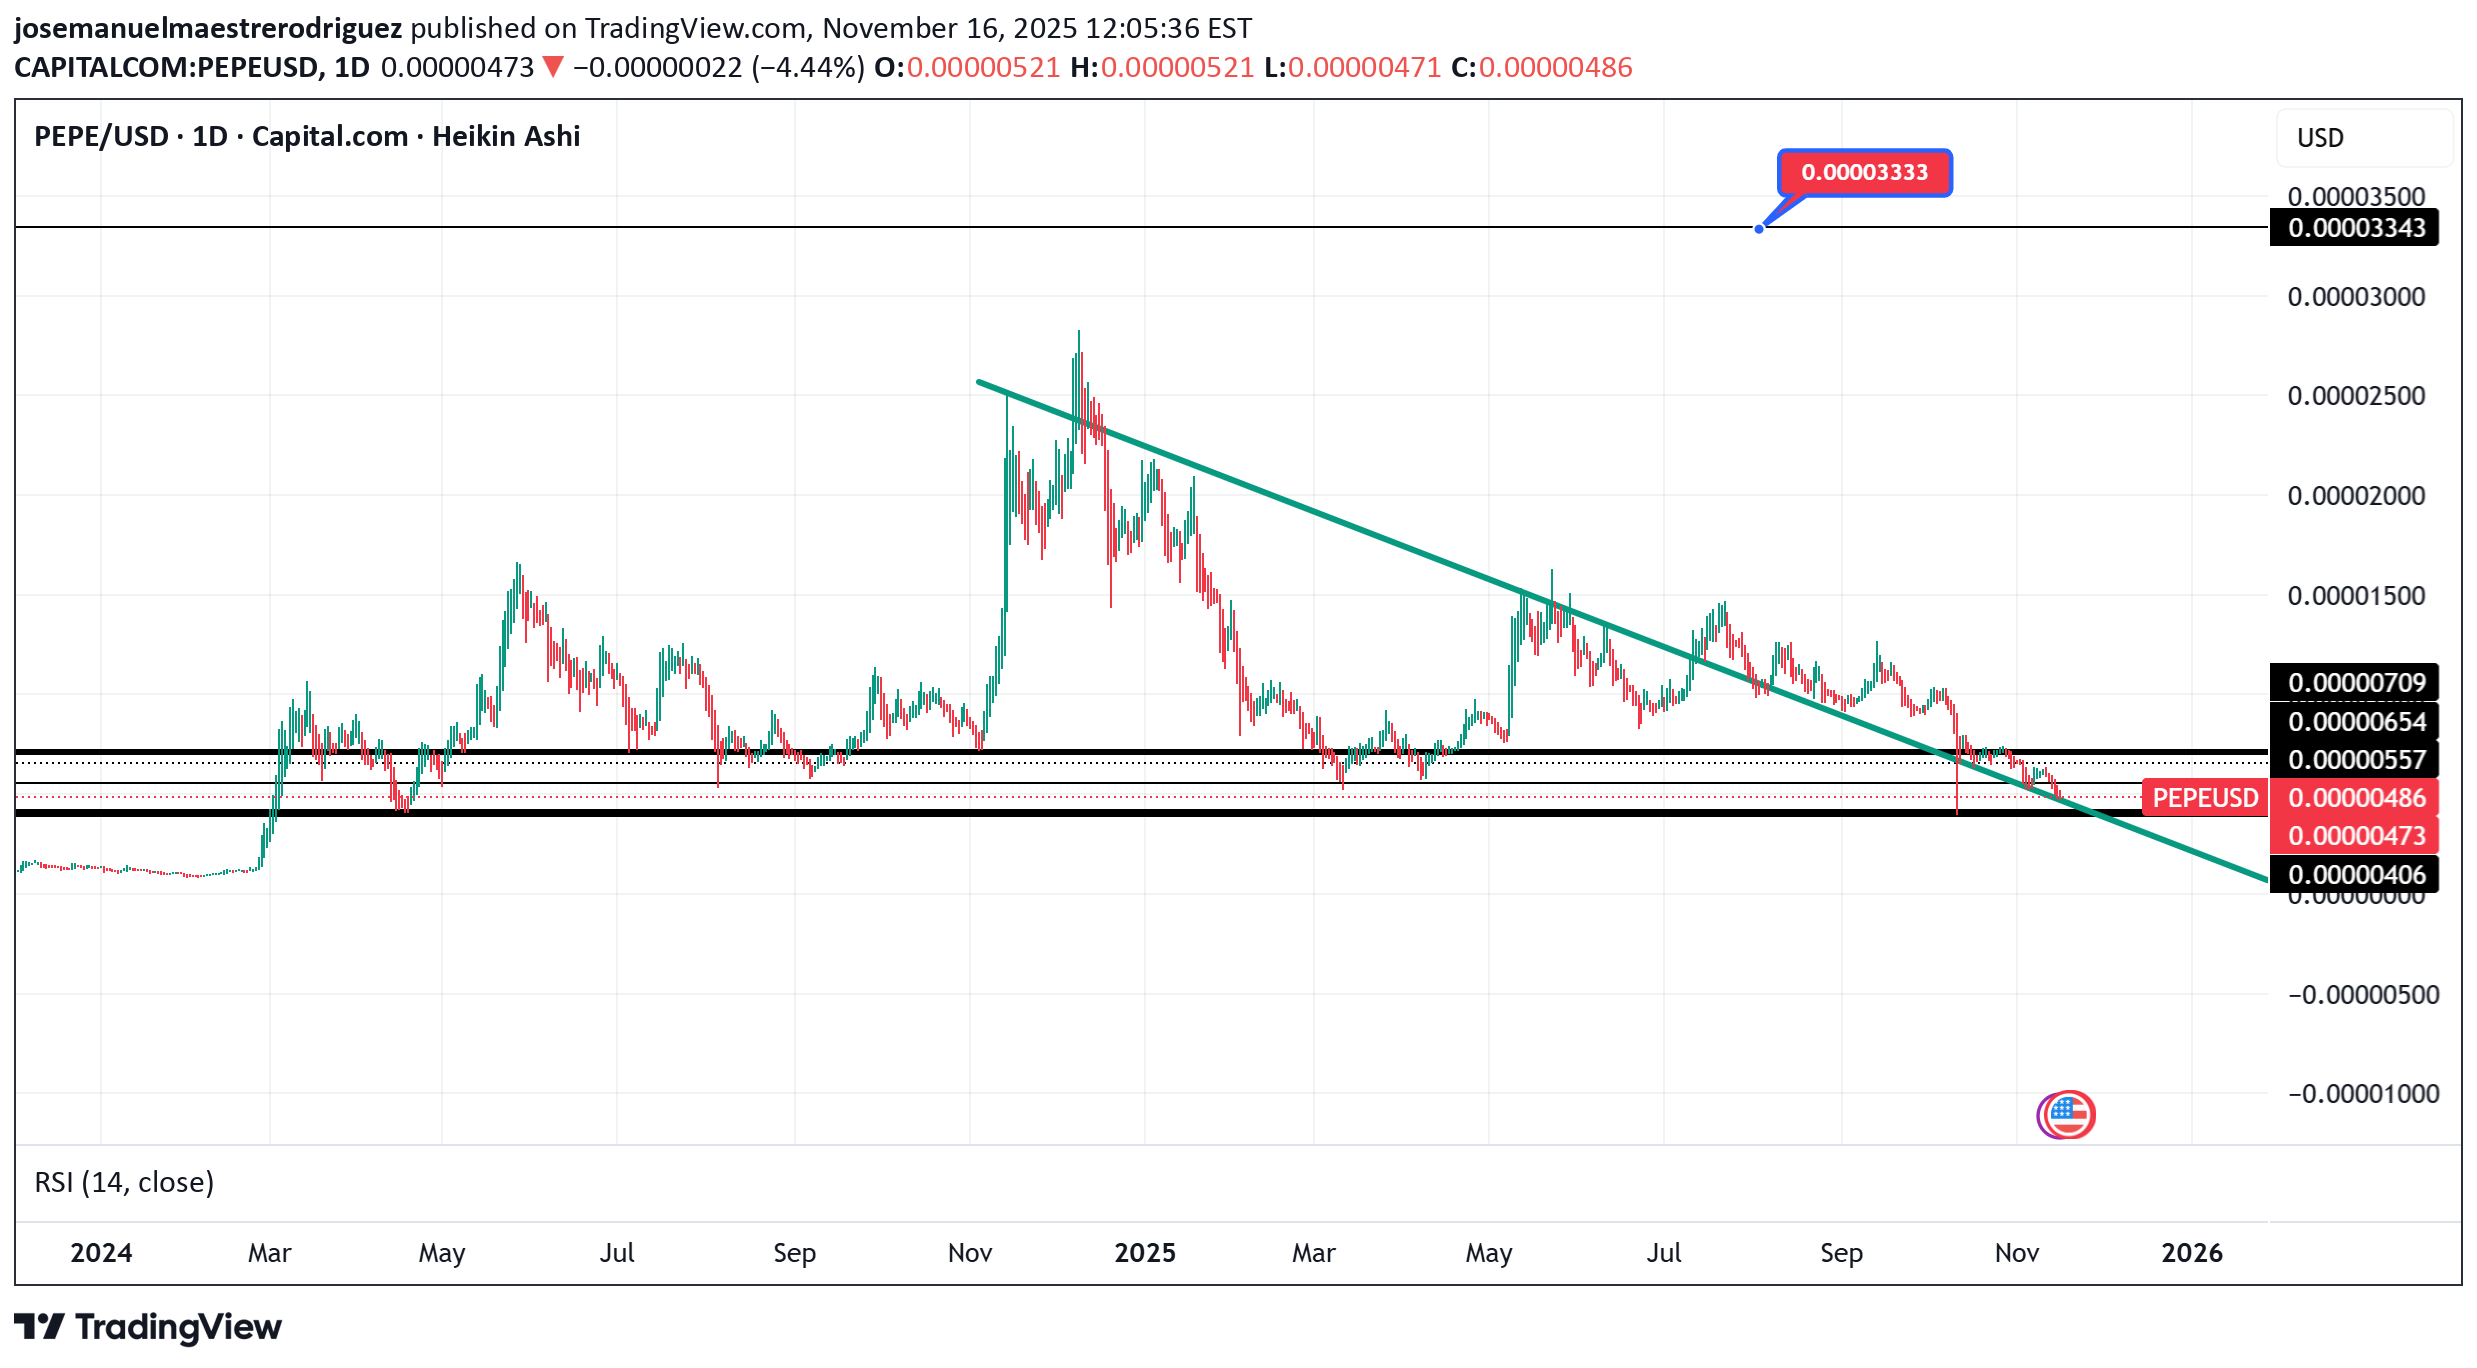
➡️ The structure is more bullish than bearish, ➡️ It’s in a potential end-of-cycle zone, ➡️ And a breakout could trigger a strong move. The key point: the trendline break and a close above 0.00000055–0.00000065.

dan577
الگوی سر و شانه کلاسیک: آیا زمان ریزش بزرگ فرا رسیده است؟
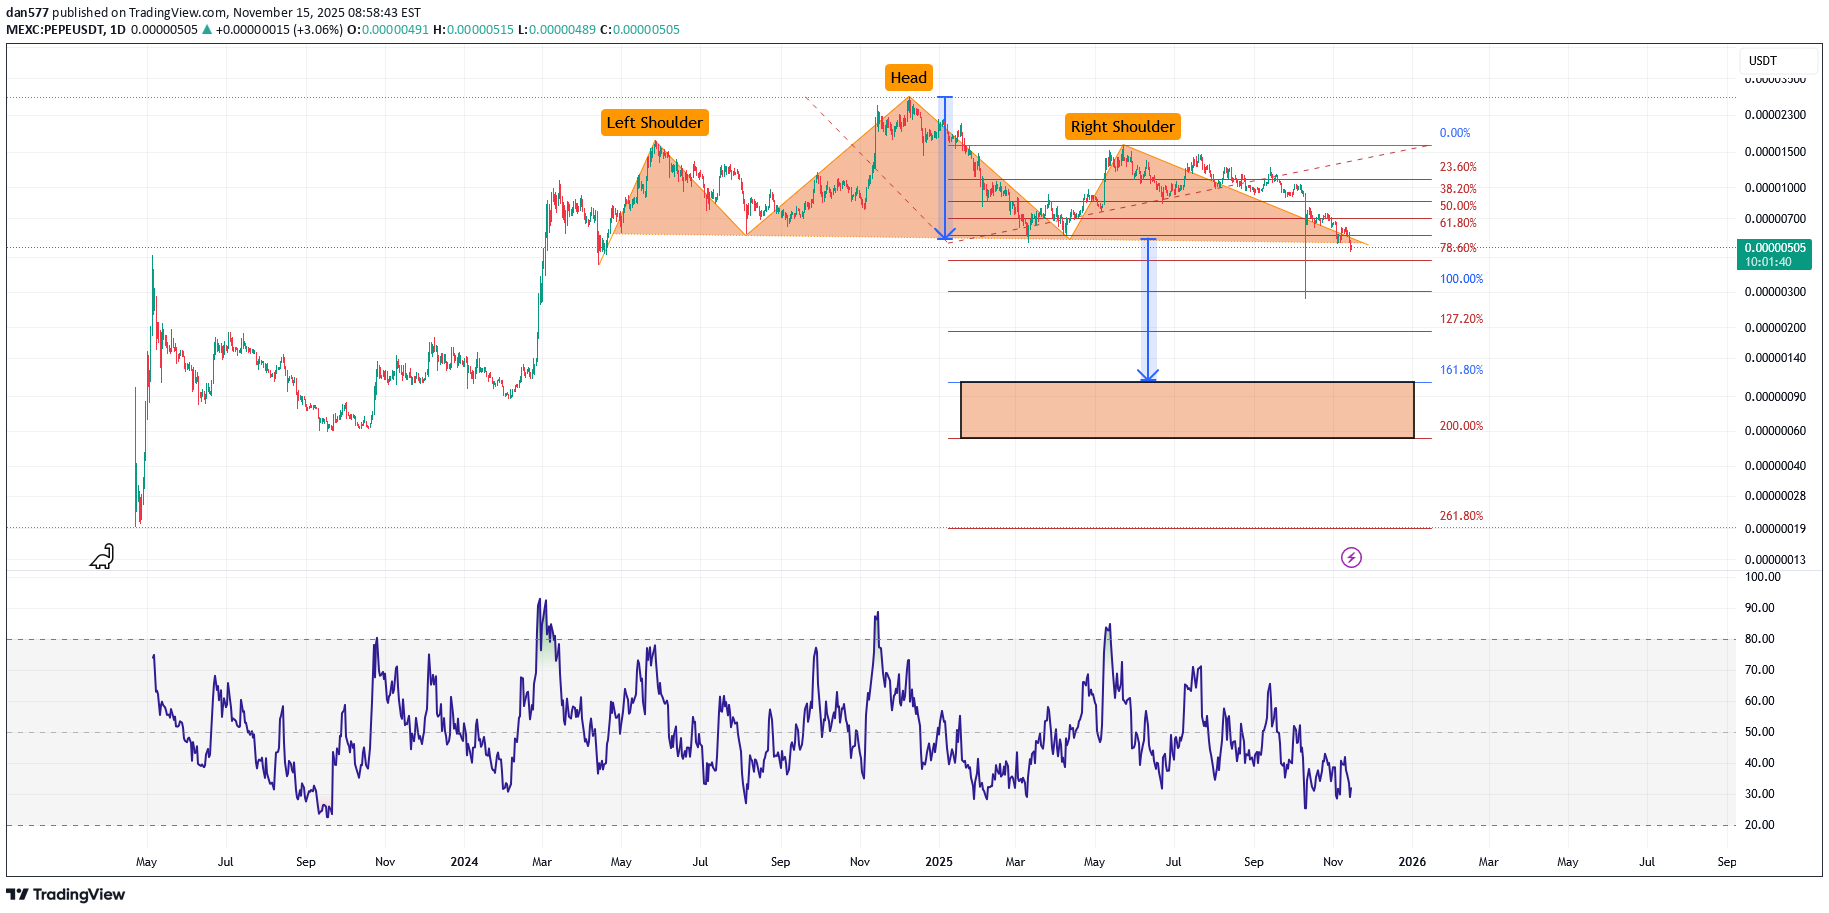
IF this is a valid Head & Shoulders AND price breaks the neckline with confirmation, THEN the downside target becomes the 161.8% Fib extension of AB, which gives the projected low for C

CryptoChartDaily
تحلیل فوری نمودار ۳ ساعته PEPE: آیا زمان خرید فرا رسیده است؟
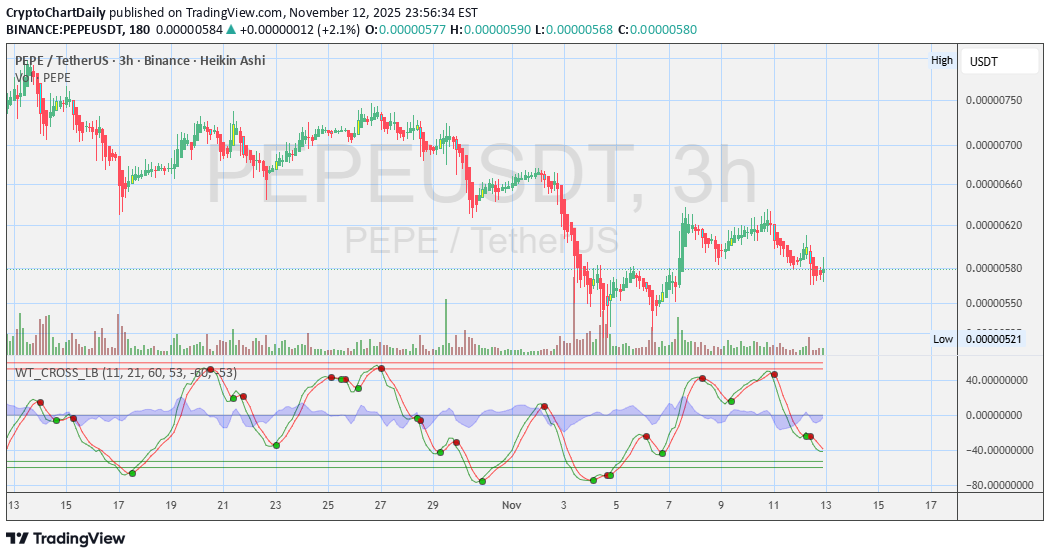
🧠 Keep it on watch. Momentum shifting. ⚠️ Disclosures : This analysis is for informational purposes only and is not financial advice. It does not constitute a recommendation to buy, sell, or trade any securities, cryptocurrencies, or stocks. Trading involves significant risk, and you should consult with a qualified financial advisor before making any investment decisions. Past performance is not indicative of future results.
Ener-traders
پپه (PEPE) صعودی شد: سیگنال بولیش قوی در تایم فریم یک ساعته!
Here is some play for you guys, Pepe seems bullish on 1hr time frame as it shows a strong bullish candle and continue to make that bullishness

Hamza_Gold
پپه در آستانه ریزش؟ تحلیل سطوح کلیدی و نقطه ورود خرسی!
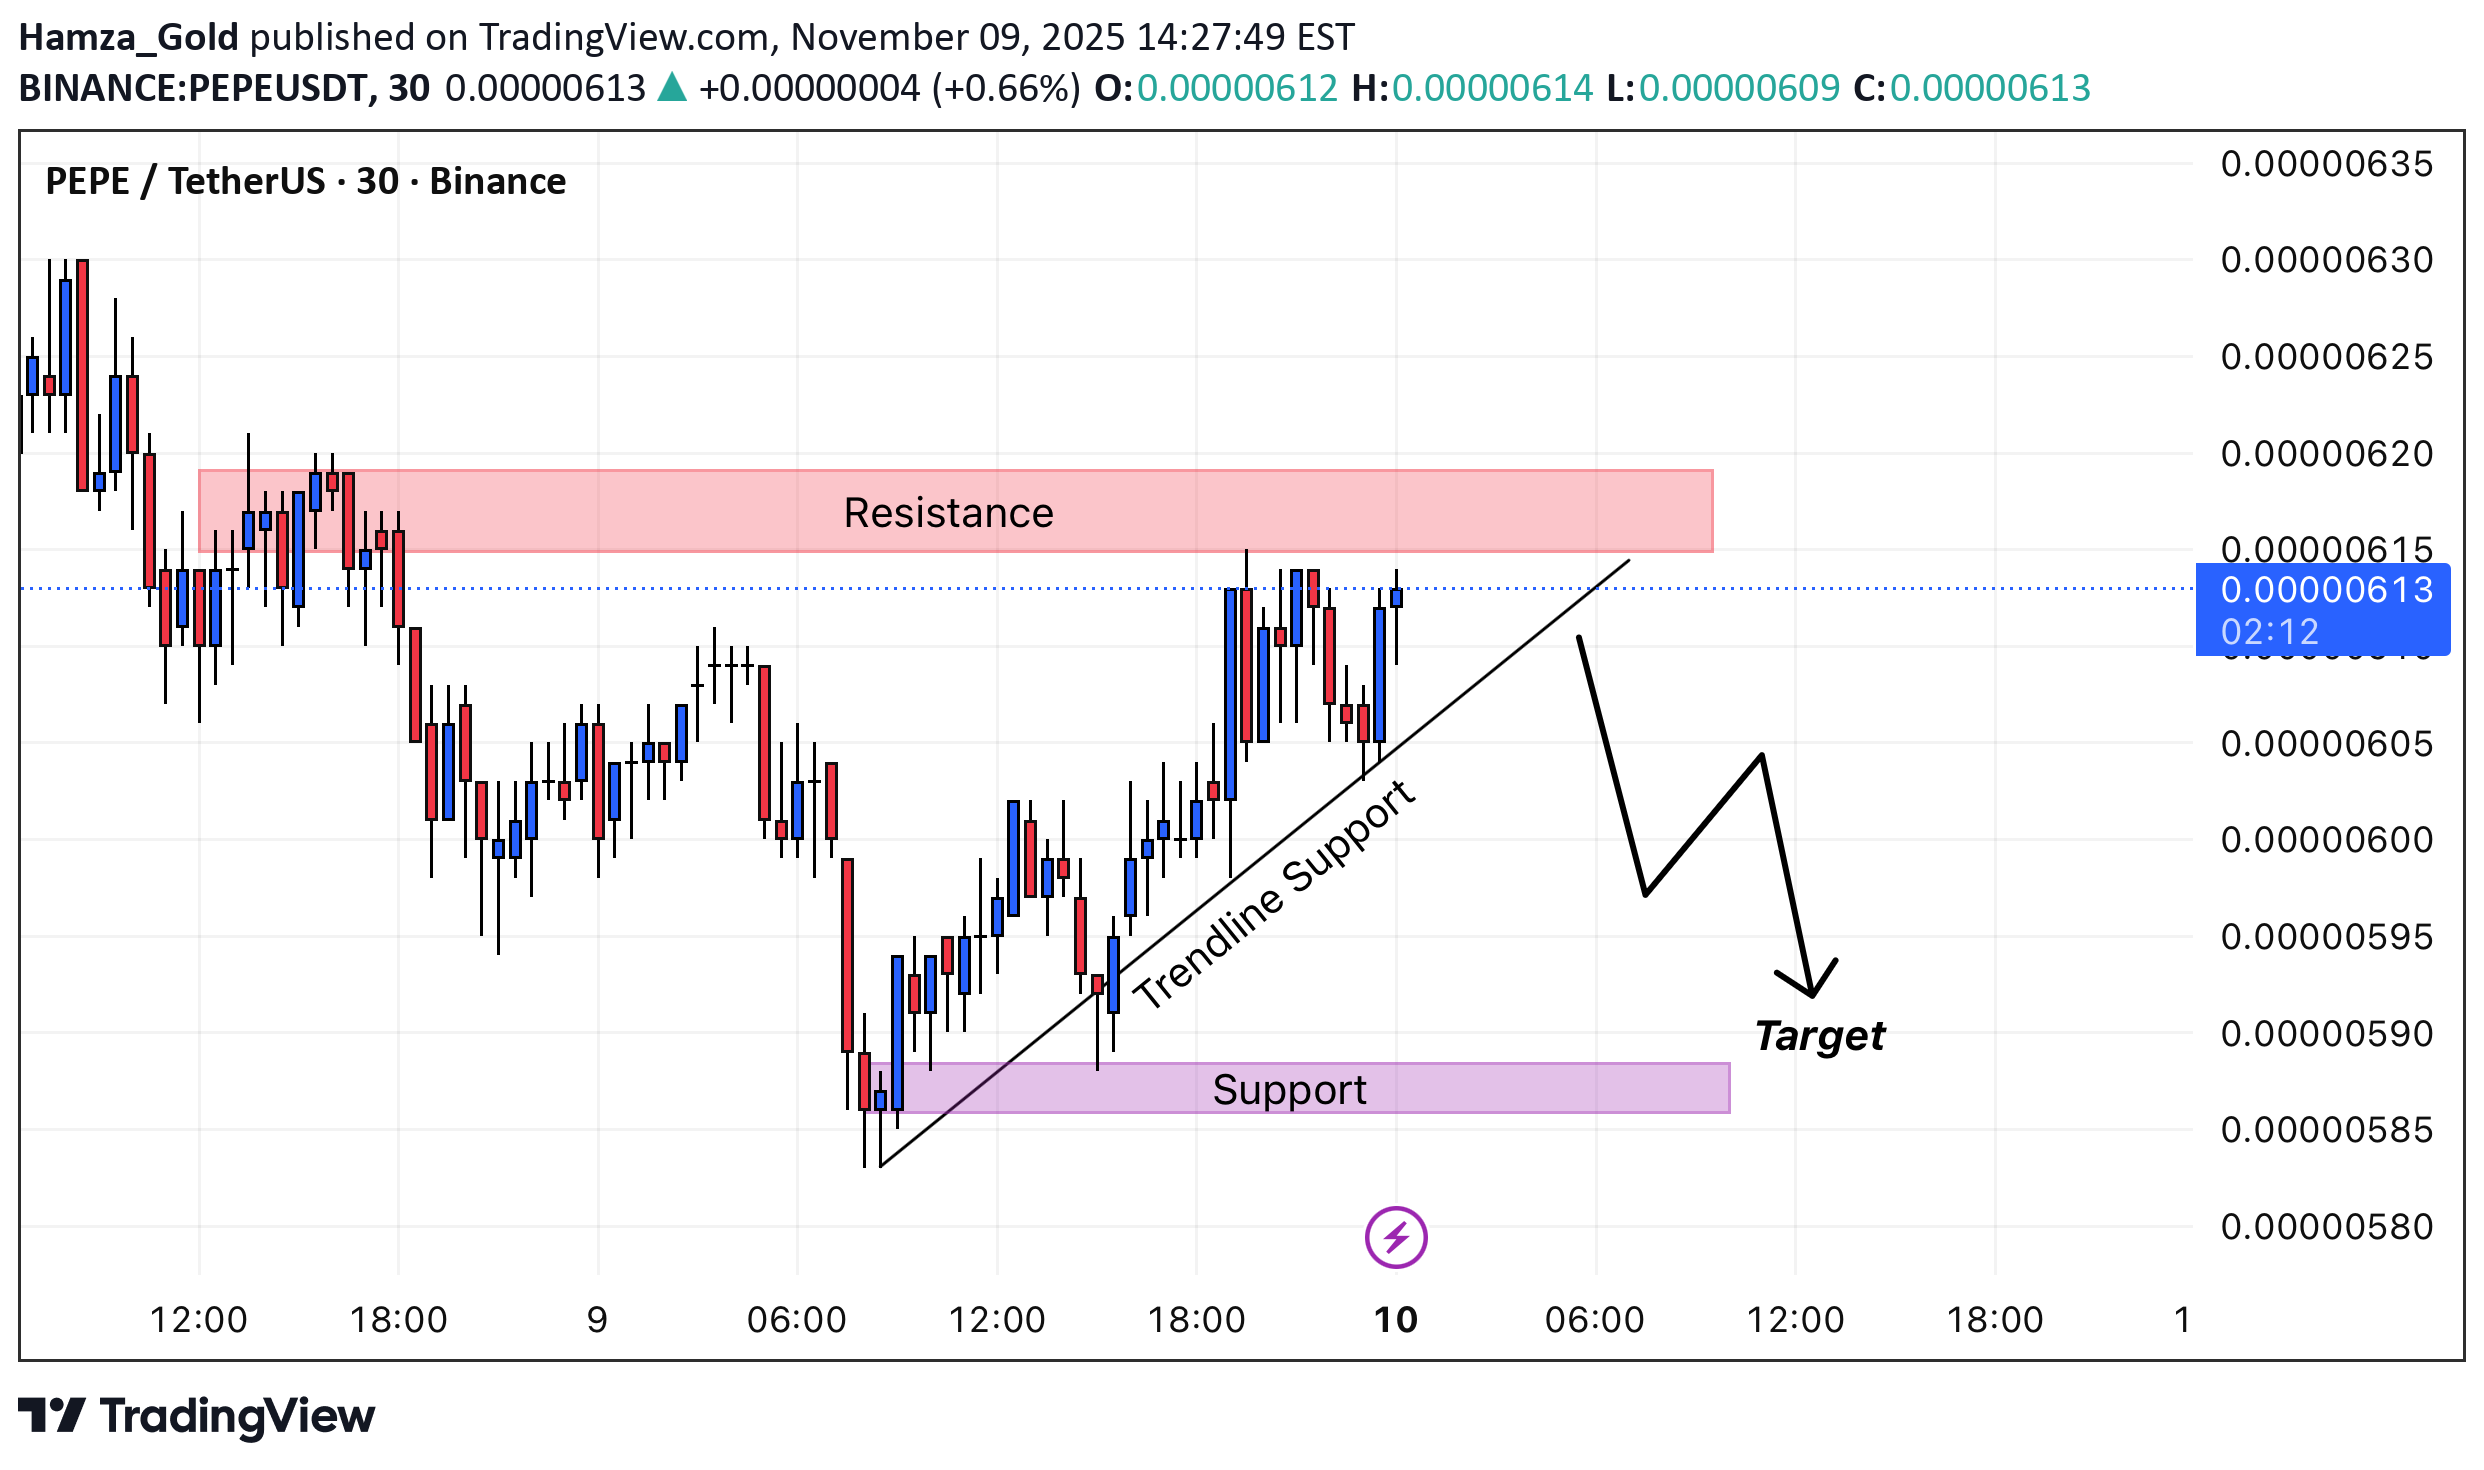
PEPE is currently testing a key resistance zone near 0.00000615, while maintaining a short-term trendline support. The recent rejections from this resistance indicate weakening bullish momentum. If the price breaks below the trendline support, it could trigger a bearish move toward the 0.00000590–0.00000585 support area, which aligns with previous structural lows. Key levels: Resistance: 0.00000615–0.00000620 Support/Target: 0.00000590–0.00000585 Bias: Bearish below resistance
TheHunters_Company
خرید پپه (PEPE) پس از اصلاح قیمت: سیگنال ورود و اهداف جدید!

Hello friends Due to the good growth we had, the price has corrected and formed a flag pattern and this pattern has been broken by buyers and now with risk capital management and in a stepwise manner, you can buy and move with it to the specified targets. *Trade safely with us*

Cryptojobs
تحلیل انفجاری پپه (PEPE): آماده صعود هیجانی با خطوط جادویی!
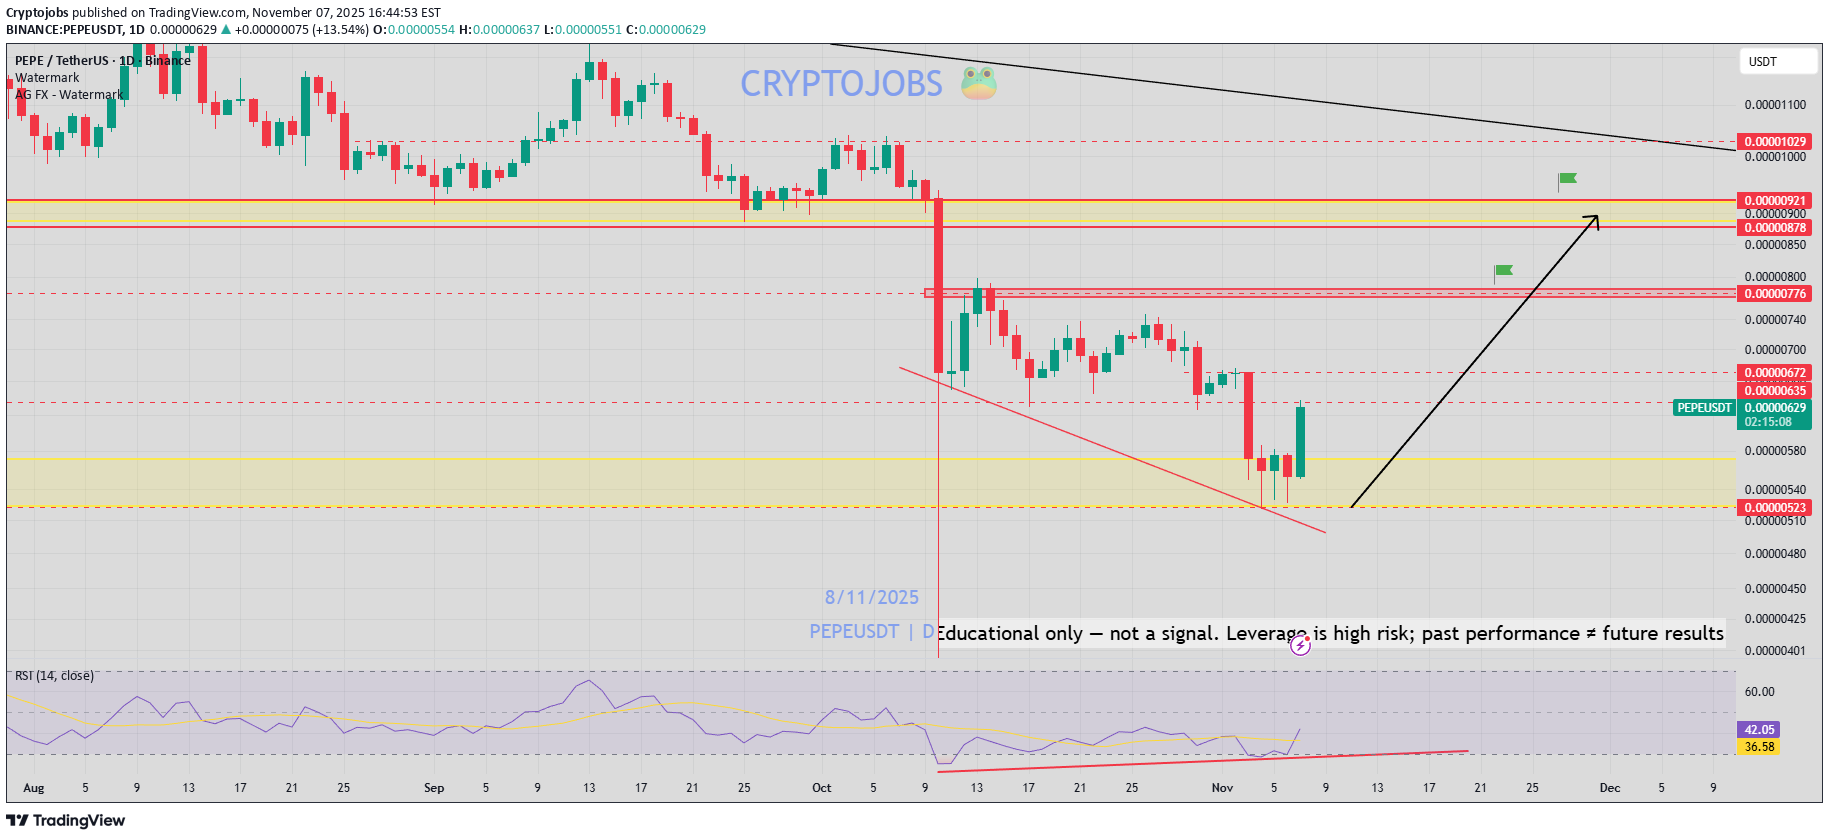
PEPE - bullish setup above yellow zone 🚀 Key demand zone weekly📈 Bull div RSI daily 📈 Beautifull chart, Unstable area & oversell one, subject to a bull correction. FOMO retracement could be see. Long term resistance to be break: 0.00007800$. I just share a 90%+ success view, I draw the magic lines, you decide. #NFA
Pepe چیست؟
معرفی پروژه پپه
آیا ارز دیجیتال پپه ارزش دارد؟
قیمت پپه (PEPE)
آیا ارز دیجیتال پپه (PEPE) برای سرمایهگذاری مناسب است؟
Disclaimer
Any content and materials included in Sahmeto's website and official communication channels are a compilation of personal opinions and analyses and are not binding. They do not constitute any recommendation for buying, selling, entering or exiting the stock market and cryptocurrency market. Also, all news and analyses included in the website and channels are merely republished information from official and unofficial domestic and foreign sources, and it is obvious that users of the said content are responsible for following up and ensuring the authenticity and accuracy of the materials. Therefore, while disclaiming responsibility, it is declared that the responsibility for any decision-making, action, and potential profit and loss in the capital market and cryptocurrency market lies with the trader.