
Hamza_Gold
@t_Hamza_Gold

What symbols does the trader recommend buying?
Purchase History
پیام های تریدر
Filter
Hamza_Gold
بیت کوین زیر حمایت کلیدی شکست خورد: آیا سقوط به ناحیه هدف ادامه مییابد؟
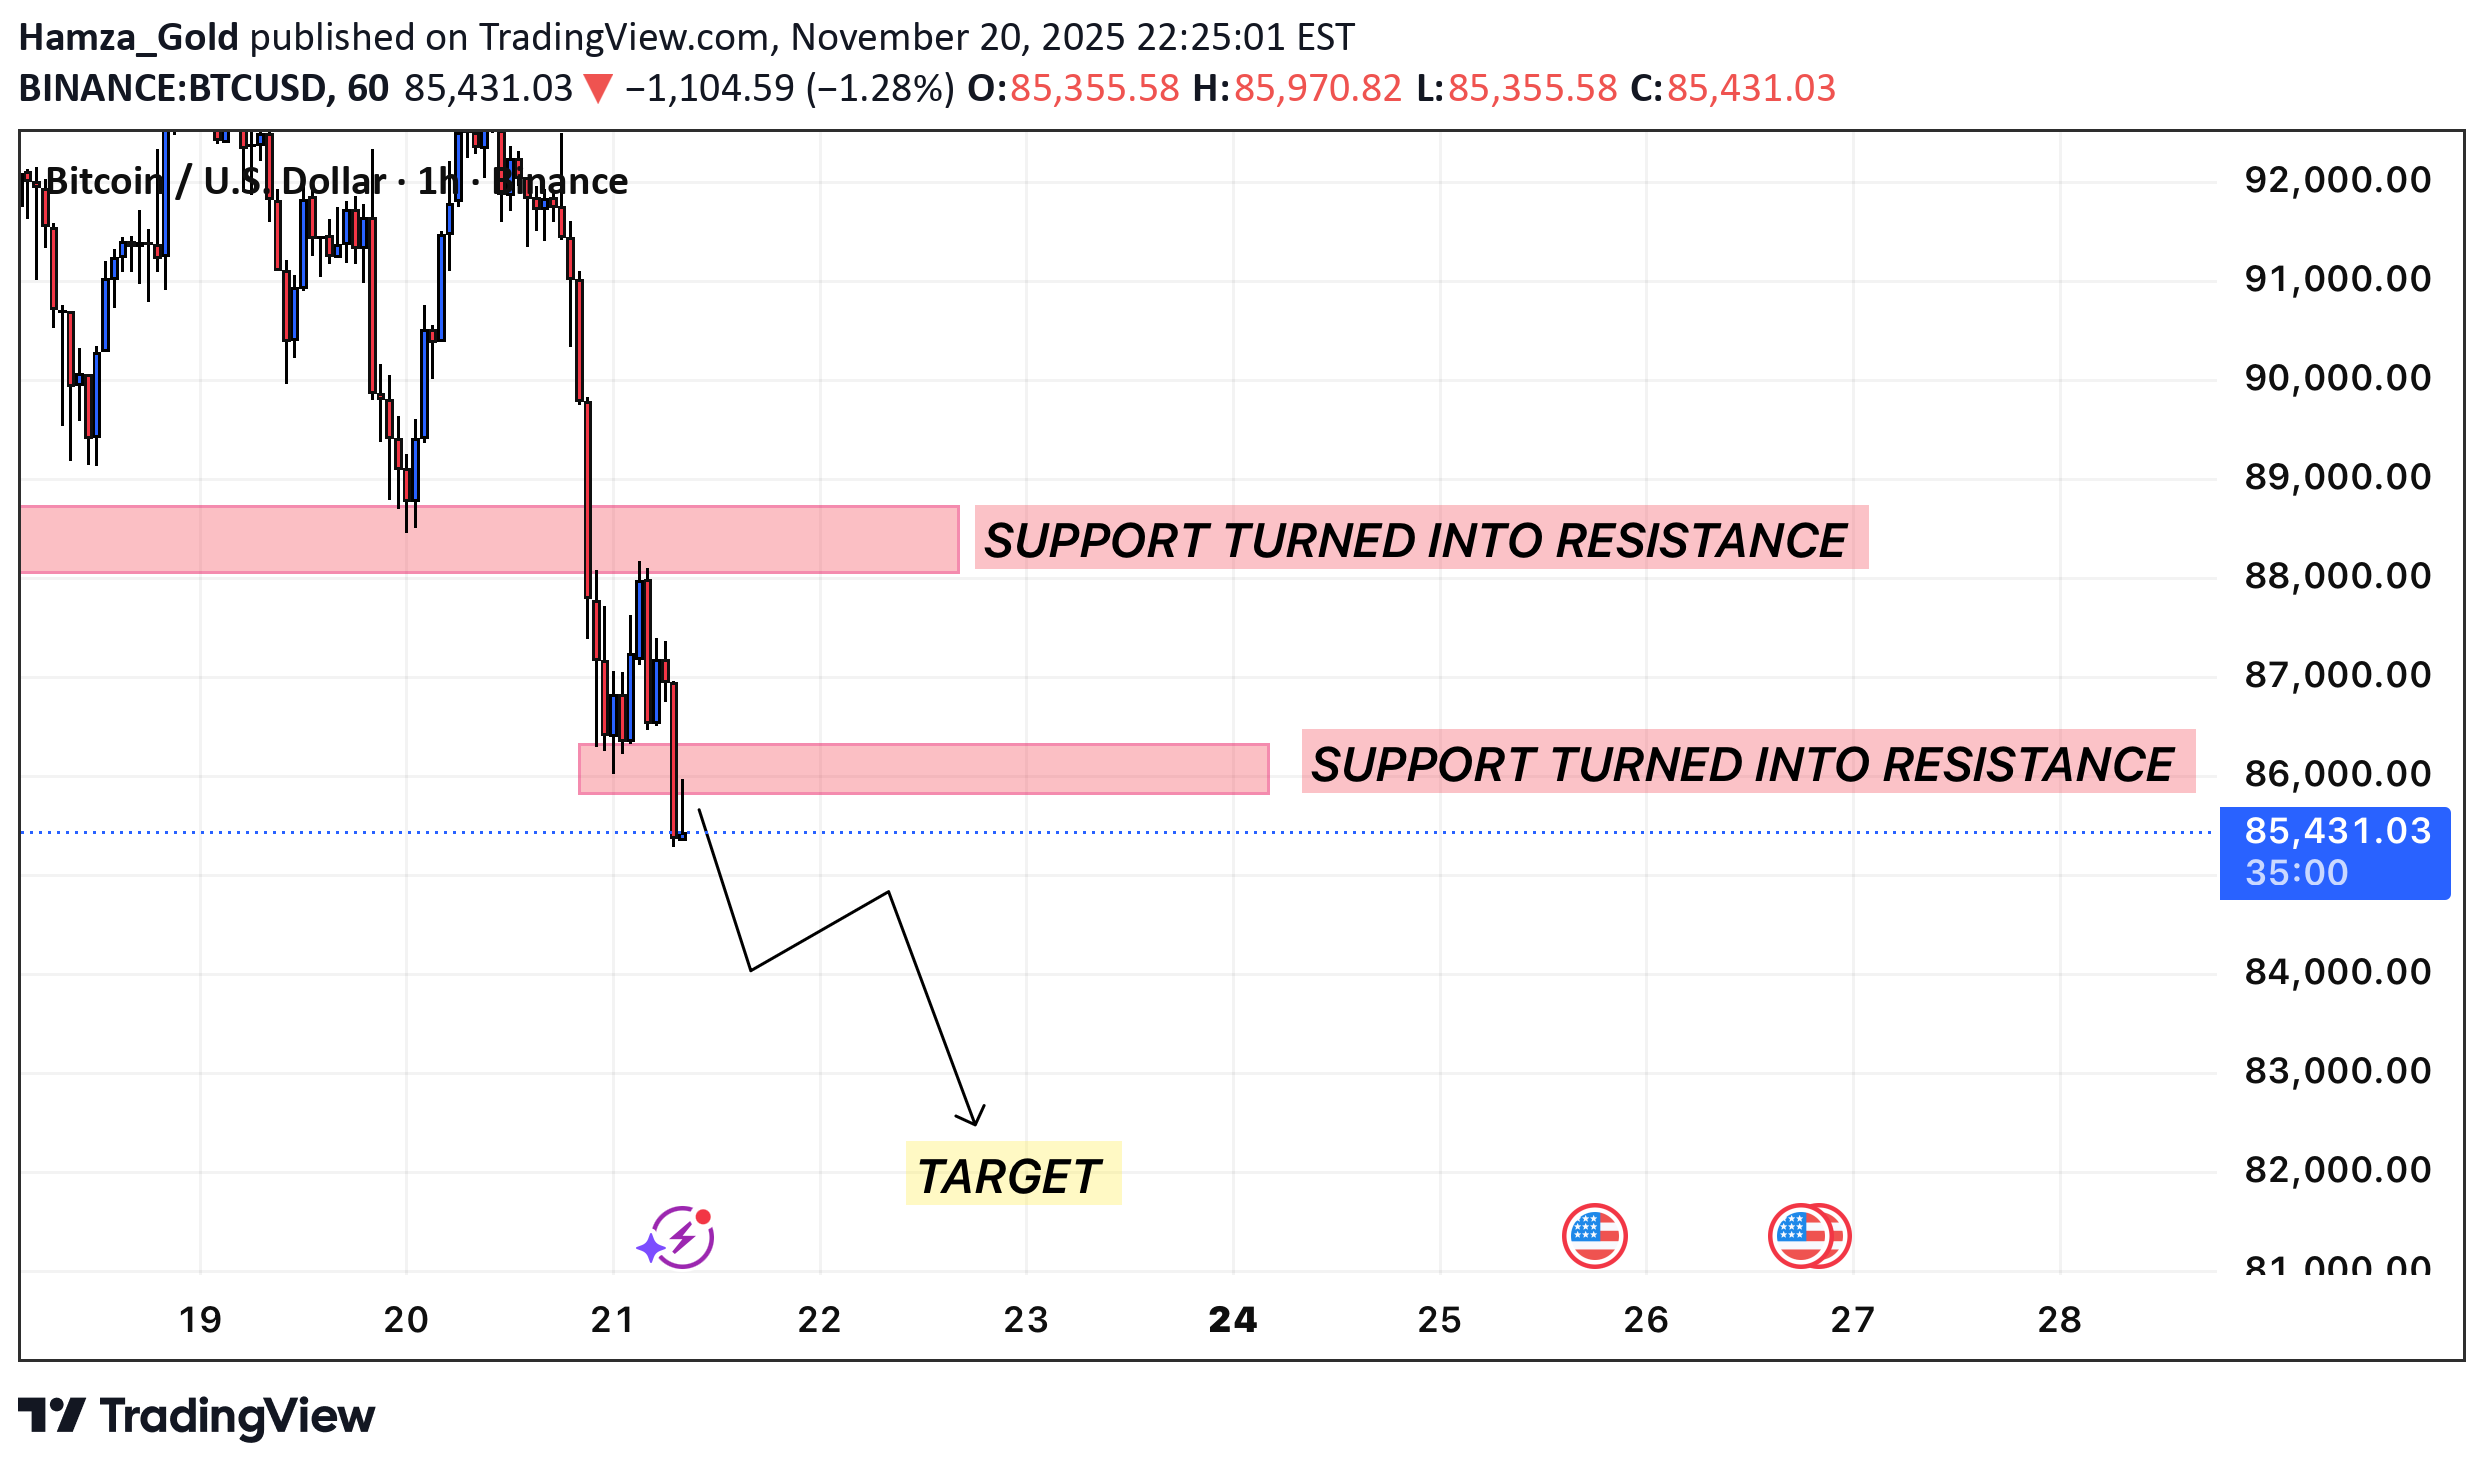
Bitcoin has broken below a key support zone, which has now flipped into resistance on both the upper and lower highlighted regions. These zones have already been respected multiple times, confirming a shift in market structure from bullish support to bearish resistance. Price is currently pulling back toward the nearest resistance zone. As long as BTC remains below this level, the bias stays bearish. 🔍 Market Structure Previous support levels have turned into resistance, signaling sellers are in control. Breakdown followed by consolidation below resistance suggests continuation to the downside. The projected TARGET zone aligns with the next major demand area where buyers may attempt to re-enter. 📉 Bearish Scenario (Primary Bias) Price retests the lower resistance zone. Rejection keeps momentum bearish. BTC moves toward the TARGET area marked on the chart for potential reaction. 📈 Bullish Invalidation A strong close back above the resistance zone would invalidate the current bearish structure. This could open a path toward reclaiming higher levels. ⚠️ Notes Market remains vulnerable while below resistance, so watch for rejection signals or continuation patterns.
Hamza_Gold
بیت کوین در آستانه سقوط؟ | سیگنال فروش قوی پس از شکست خط روند!
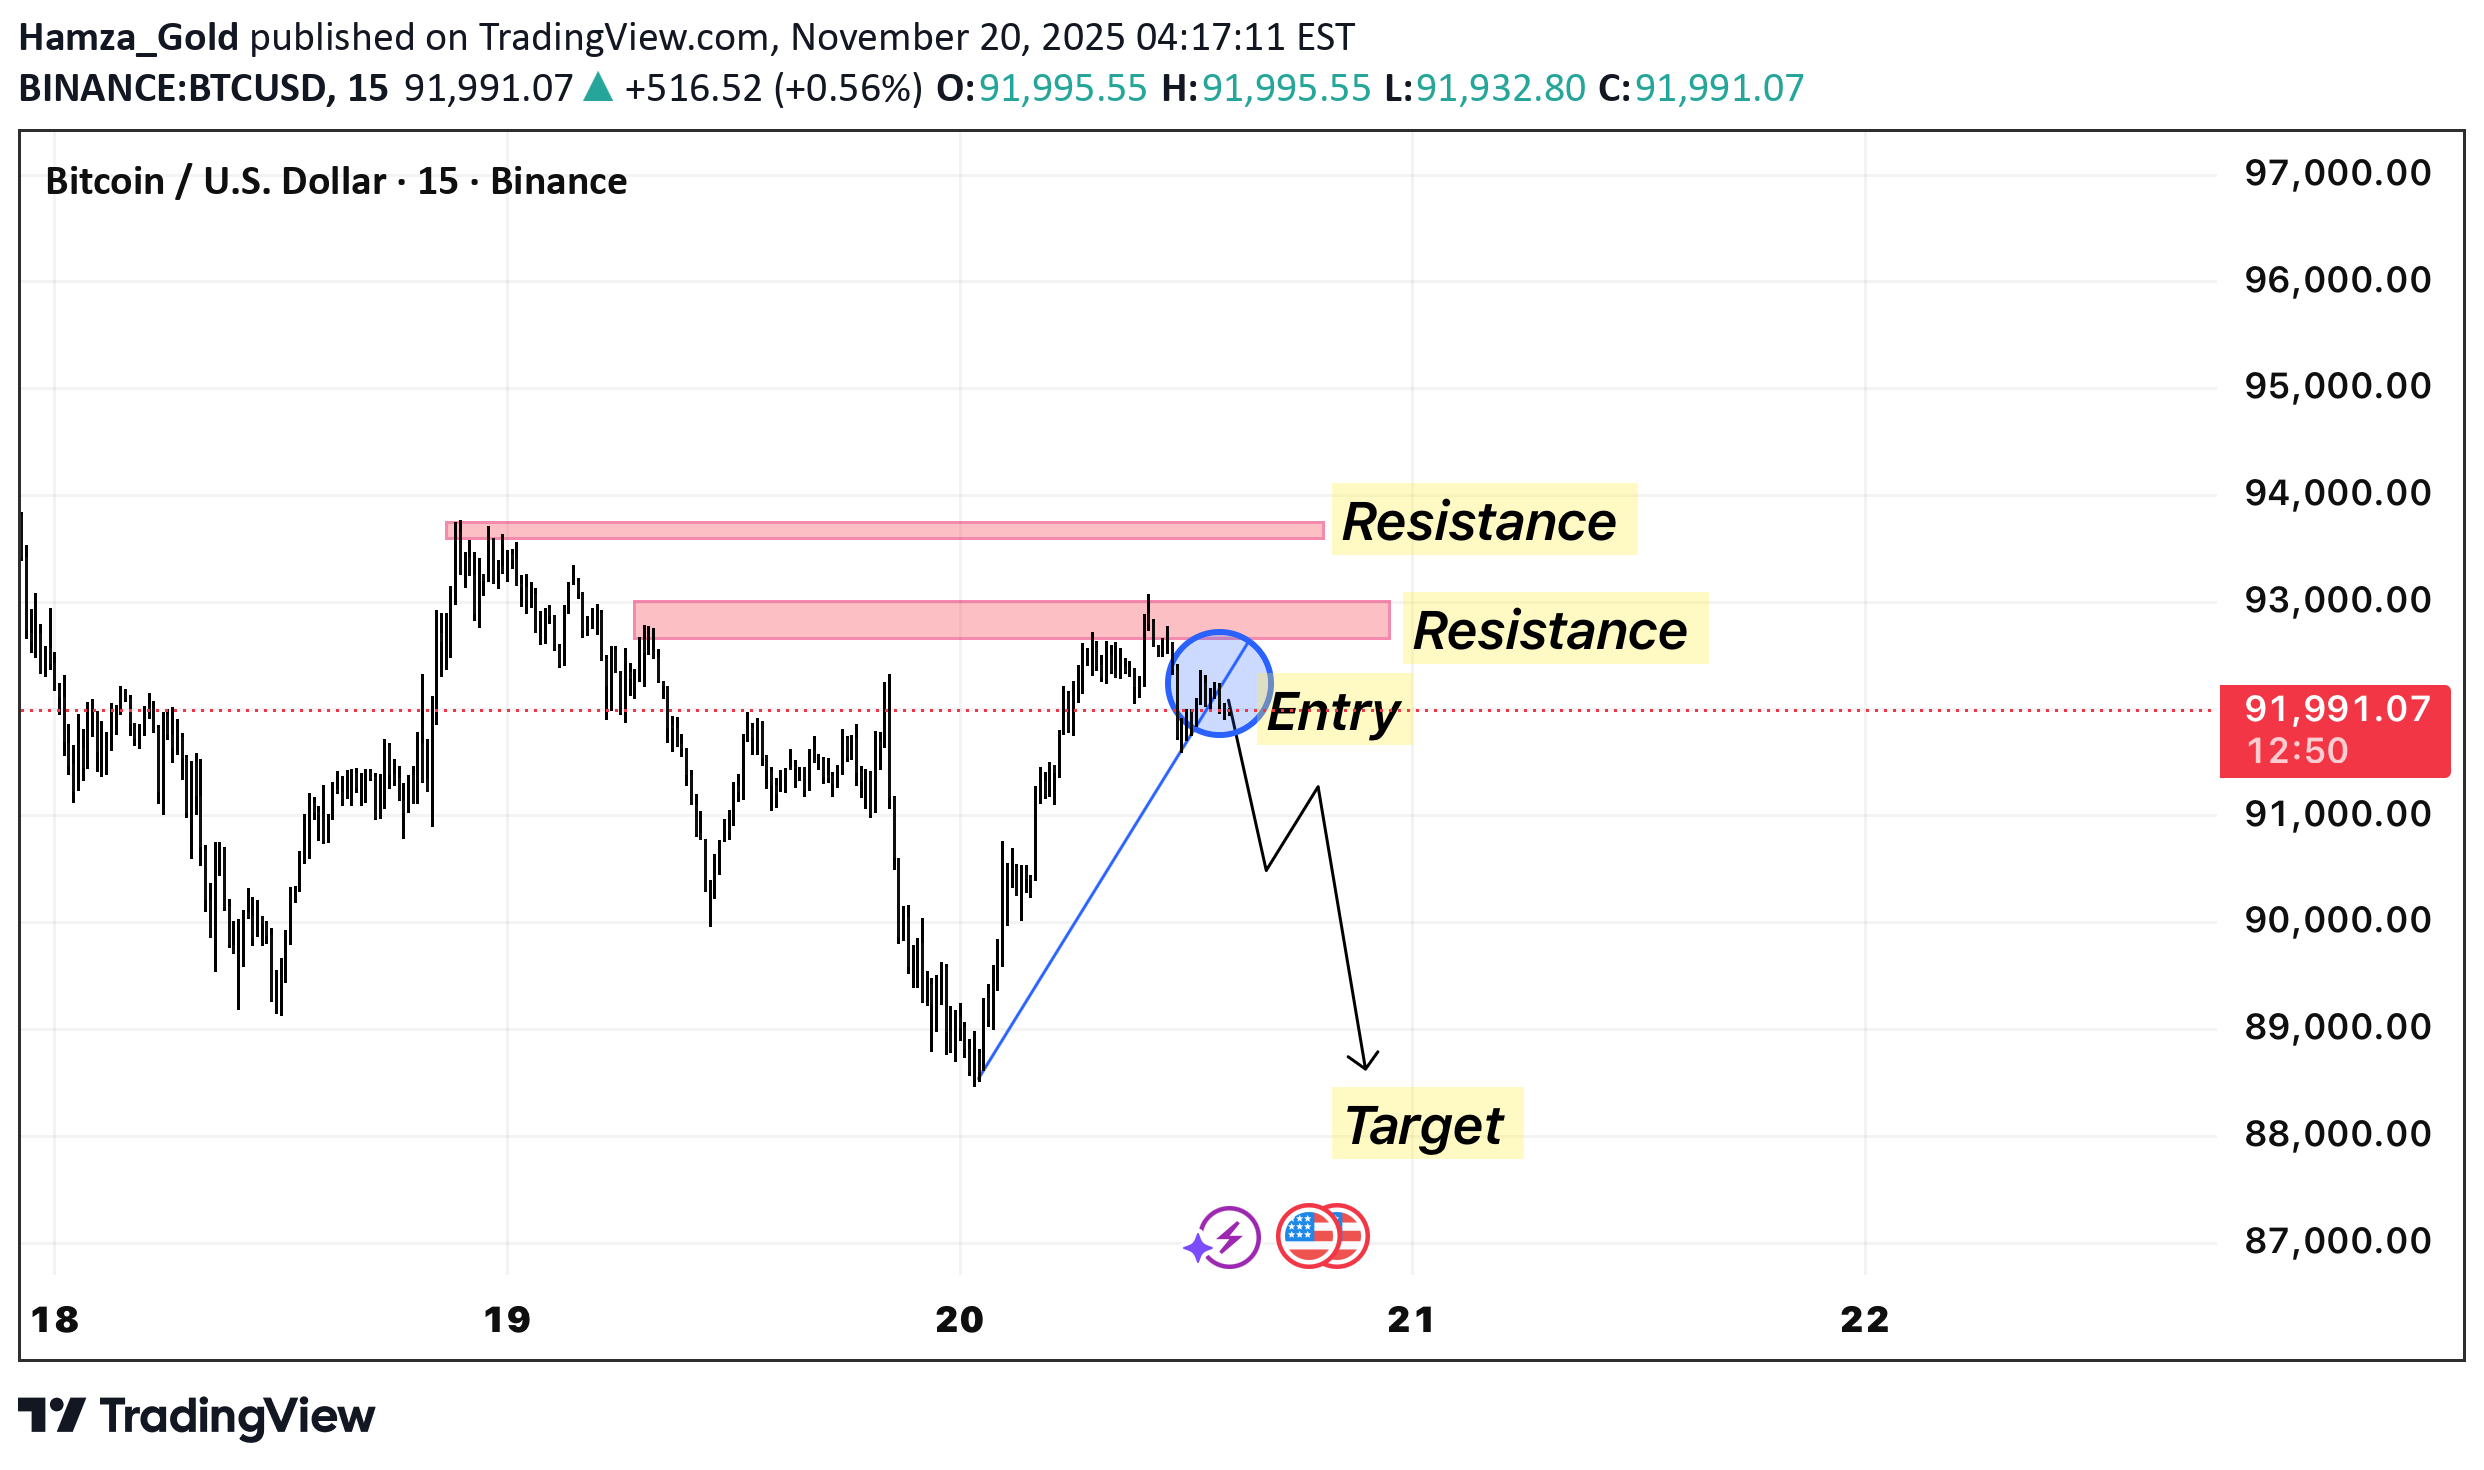
Price has pushed into a stacked resistance zone between ~92,000–93,000, where two previously rejected supply areas overlap. After a strong impulsive move upward, BTC formed a lower high within this resistance block and is now showing early signs of exhaustion. A potential short setup forms at the blue-circled area, where price retests the underside of the trendline break and fails to reclaim resistance. This aligns with a classic break–retest–continuation pattern. If sellers maintain control: Entry Zone: Retest of broken trendline / underside of resistance Bias: Bearish continuation Target: Downward liquidity zone around 89,500–90,000 Invalidation: A clean breakout above the upper resistance band (~93,000) Overall, the chart suggests a short-term pullback scenario unless bulls regain the resistance region.
Hamza_Gold
بیت کوین در دوراهی ۹۳ هزار یا ۸۶ هزار دلار: نبرد کلیدی در محدوده قیمتی مهم!
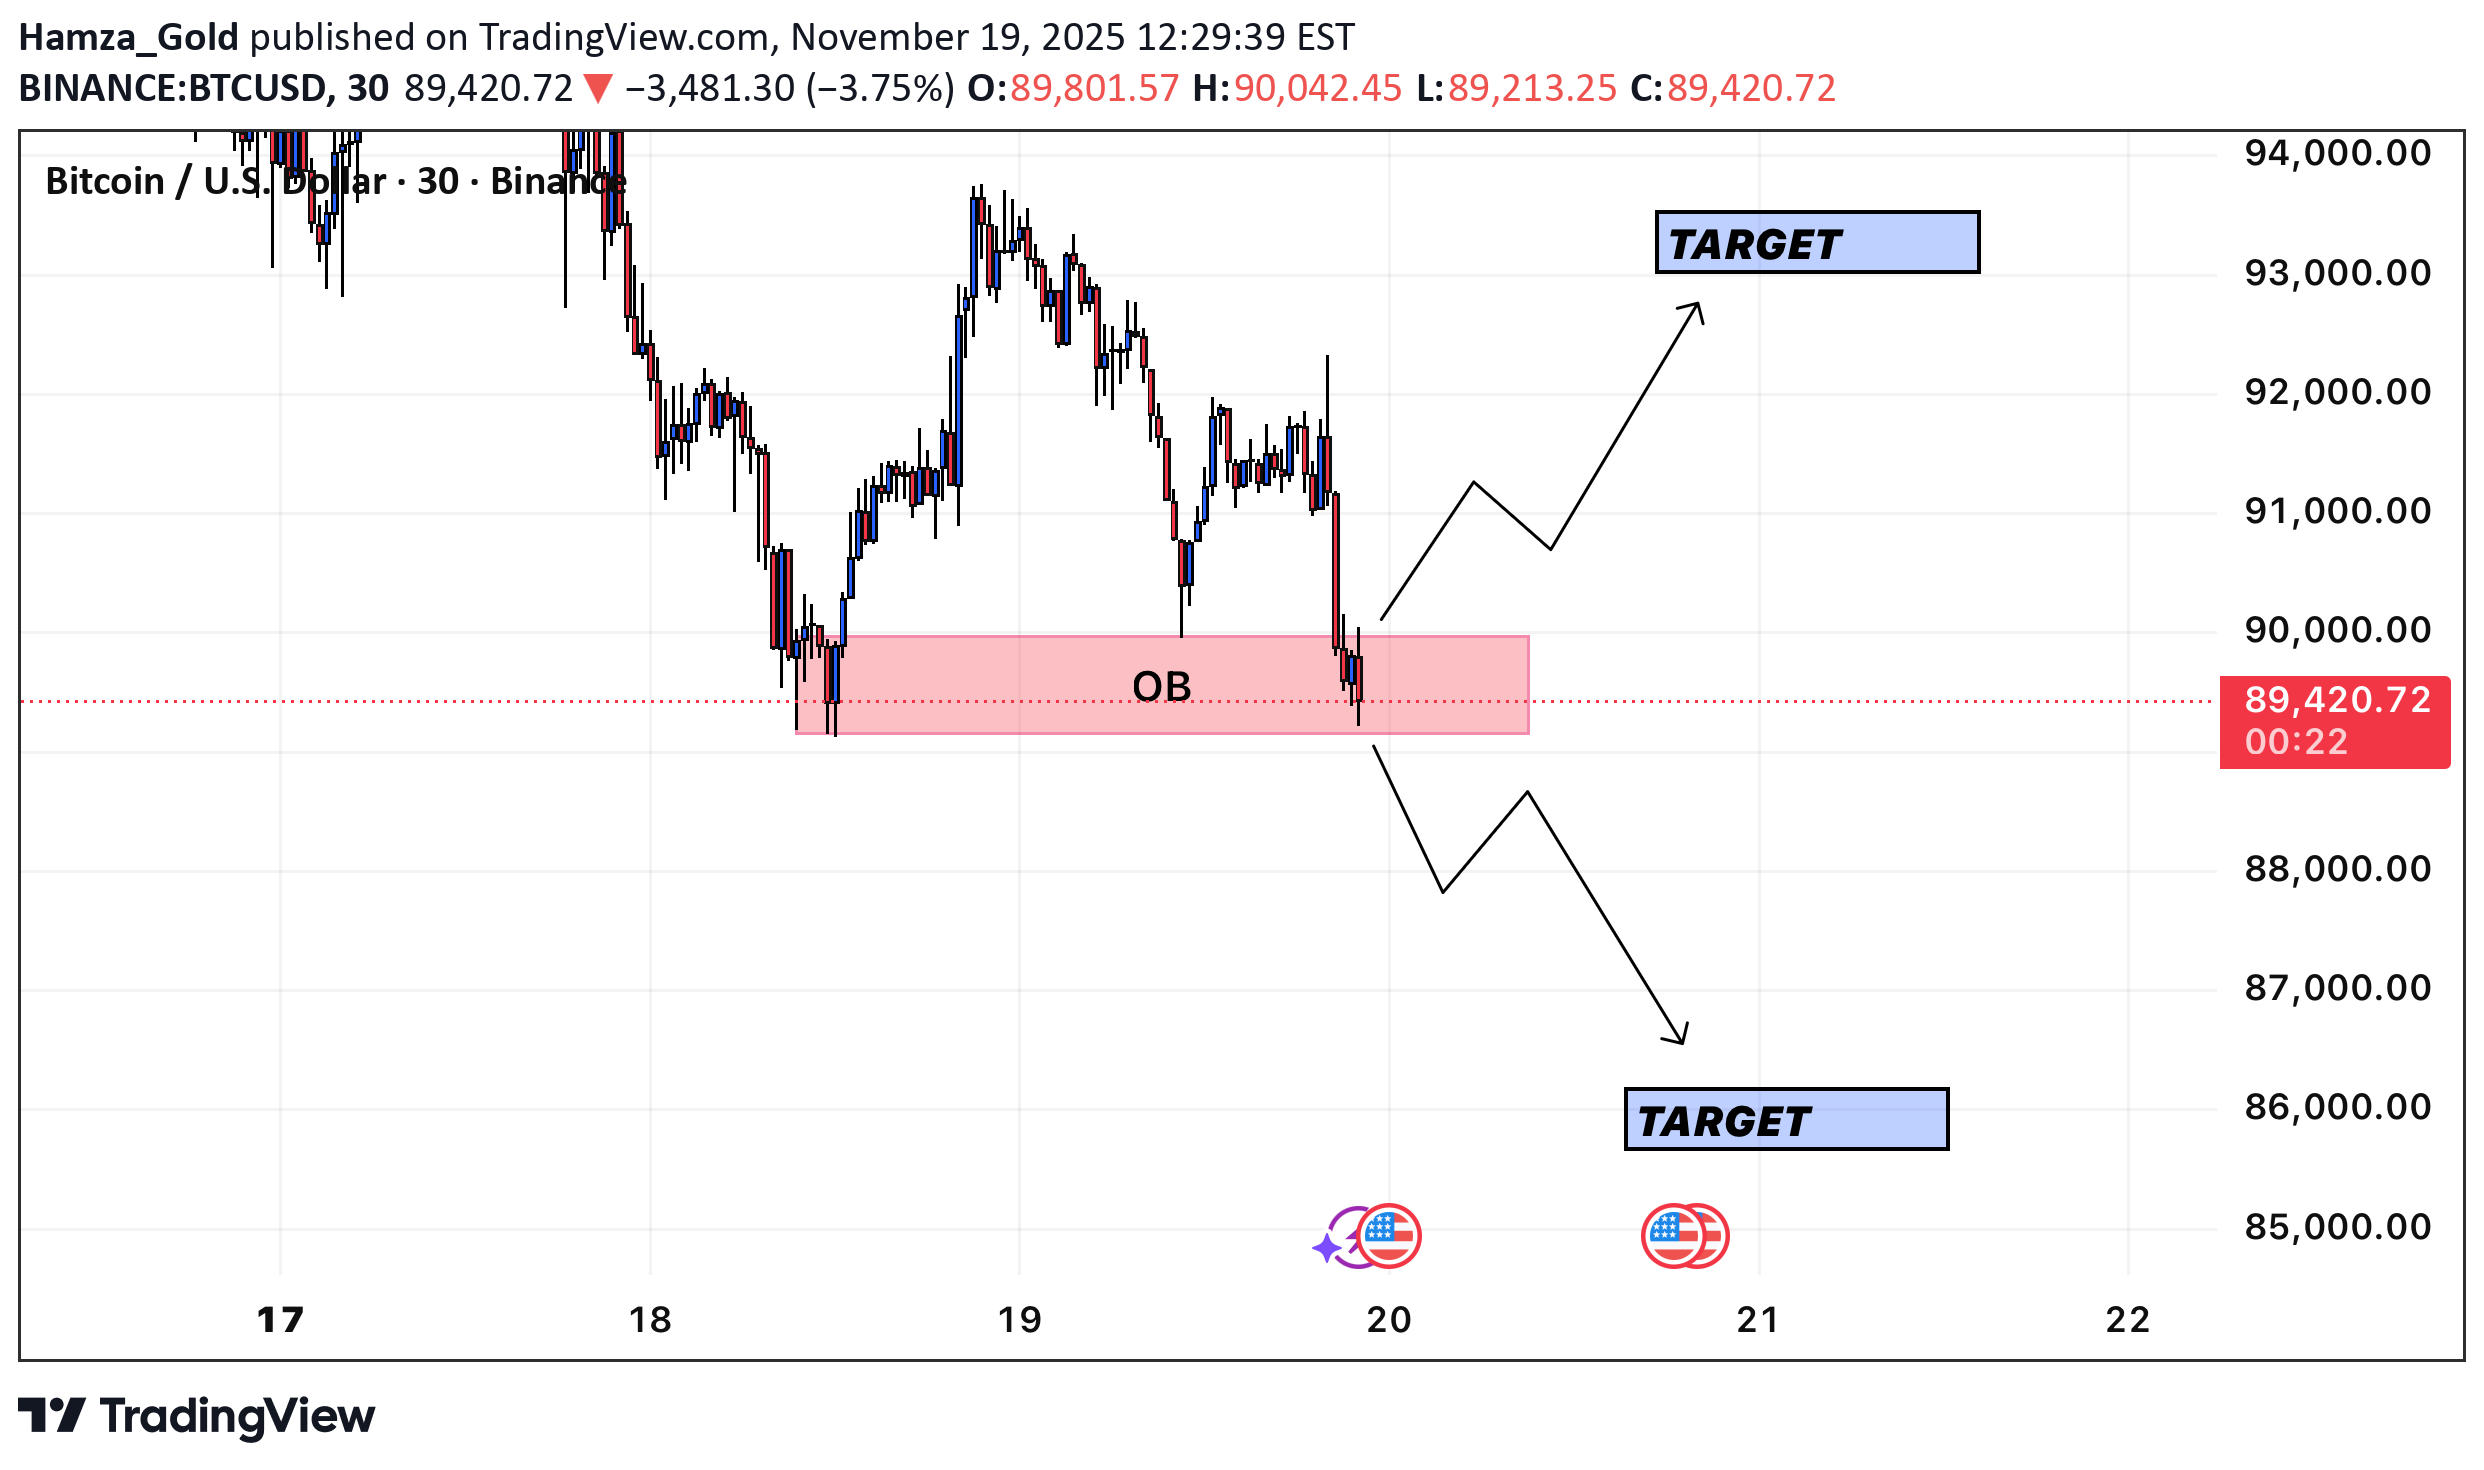
Key Technical Observations • Order Block (OB) Identification: The red rectangular zone, approximately between $89,500 and $90,000, is labeled as an OB. This zone represents a price level where institutional orders were likely executed, making it a critical area of potential support or resistance when the price revisits it. • Current Price Action: The price is currently retesting the lower boundary of this OB, trading at approximately $89,320.31. • Dual Possibilities: The chart illustrates two potential paths forward, suggesting a high-volatility decision point at the current level. 📈 Scenario 1: Bullish Reversal (Uptrend Continuation) • Condition: The price successfully holds the Order Block (OB) area as support and shows a strong rejection of the lower prices. This would imply that the buy-side institutional orders at the OB were successfully 'filled' and are now pushing the price back up. • Entry Signal: A clear break and close of a 30-minute candle above the OB (e.g., above $90,000) or a bullish candle pattern forming right on the support. • Target: The move is projected to target the upper level at approximately $93,000. 📉 Scenario 2: Bearish Breakout (Downtrend Continuation) • Condition: The price breaks decisively below the Order Block (OB) area. This would indicate that the selling pressure has overwhelmed the buy orders in the OB, leading to a breakdown of a key structural level. • Entry Signal: A clear break and close of a 30-minute candle below the OB (e.g., below $89,500) and/or confirmation of the OB zone flipping to new resistance on a retest. • Target: The move is projected to target the lower level at approximately $86,000. 🔥 Trade Strategy Recommendation Traders should wait for confirmation of which scenario is playing out: 1. For a Long Position (Scenario 1): Wait for a strong bounce and candle close above the OB zone to confirm support is holding, with a stop-loss placed just below the low of the OB structure. 2. For a Short Position (Scenario 2): Wait for a clear 30-minute candle close below the OB zone to confirm the breakdown, with a stop-loss placed just above the high of the OB structure. Disclaimer: This is a technical analysis based on a single chart and does not constitute financial advice. Always perform your own research and manage your risk carefully.
Hamza_Gold
بیت کوین در آستانه انفجار صعودی: شکار نقدینگی هوشمندانه قبل از جهش بزرگ!
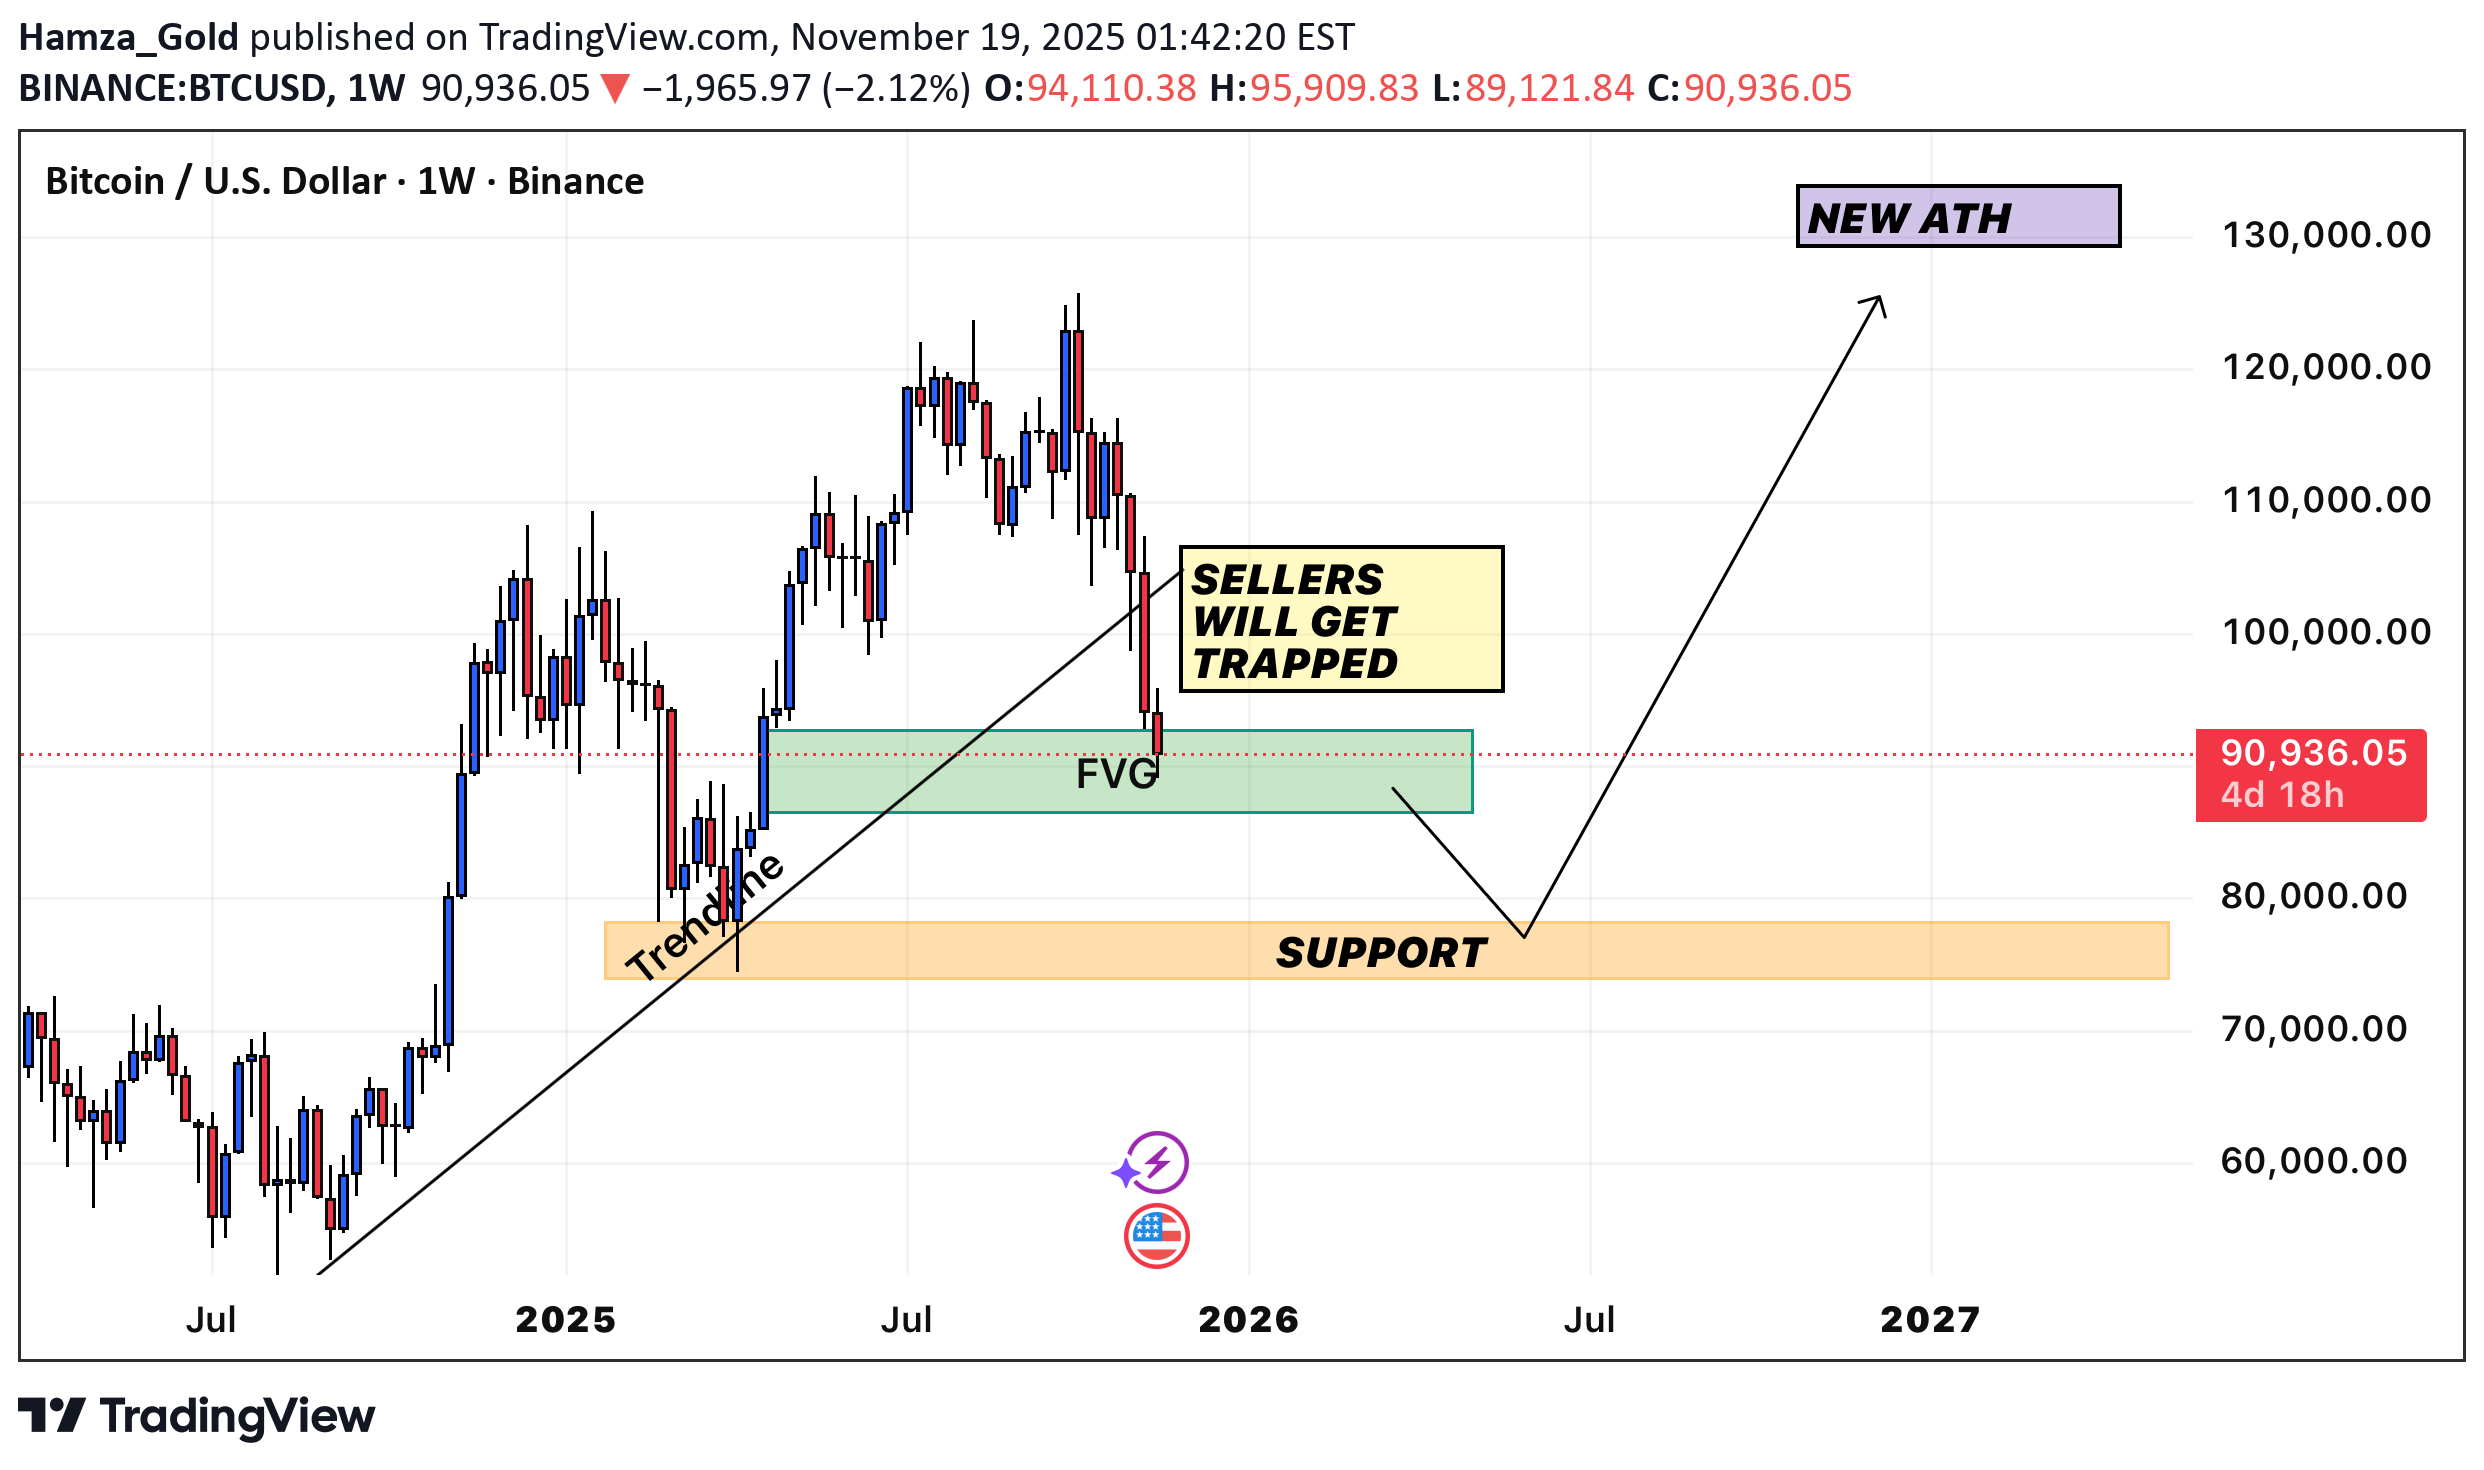
Bitcoin is currently correcting into a higher-timeframe weekly imbalance (FVG) after breaking down from a short-term distribution range. Price has tapped into the upper portion of the green FVG zone, where liquidity is likely being engineered to trap late sellers. The wick reaction suggests that the market may be accumulating long positions while incentivizing shorts to enter below the recent swing. Below the FVG sits a major HTF demand / support zone, aligned with a prior consolidation and a retested trendline area. This orange zone represents the highest-probability area for a strong bullish response, as it holds unmitigated demand and external liquidity from previous lows. If price sweeps liquidity beneath the FVG and taps deeper into the HTF support, it would complete a classic SMC sequence: 1.Liquidity grab below FVG 2.Mitigation of untested HTF demand 3.Reaccumulation phase 4.Bullish displacement A bullish market structure shift from this zone would confirm the continuation of the macro uptrend. Once demand is confirmed, price would likely target: •Inefficiencies left above •Old highs serving as liquidity pools •A potential rally toward a new all-time high (ATH) as drawn on your projection. The overall structure remains bullish as long as the HTF support zone holds. This current corrective move appears to be a retracement designed to rebalance price and accumulate liquidity before the next expansion leg upward.
Hamza_Gold
طلا (XAUUSD) در آستانه انفجار قیمتی: حمایت شکسته میشود یا مقاومت؟
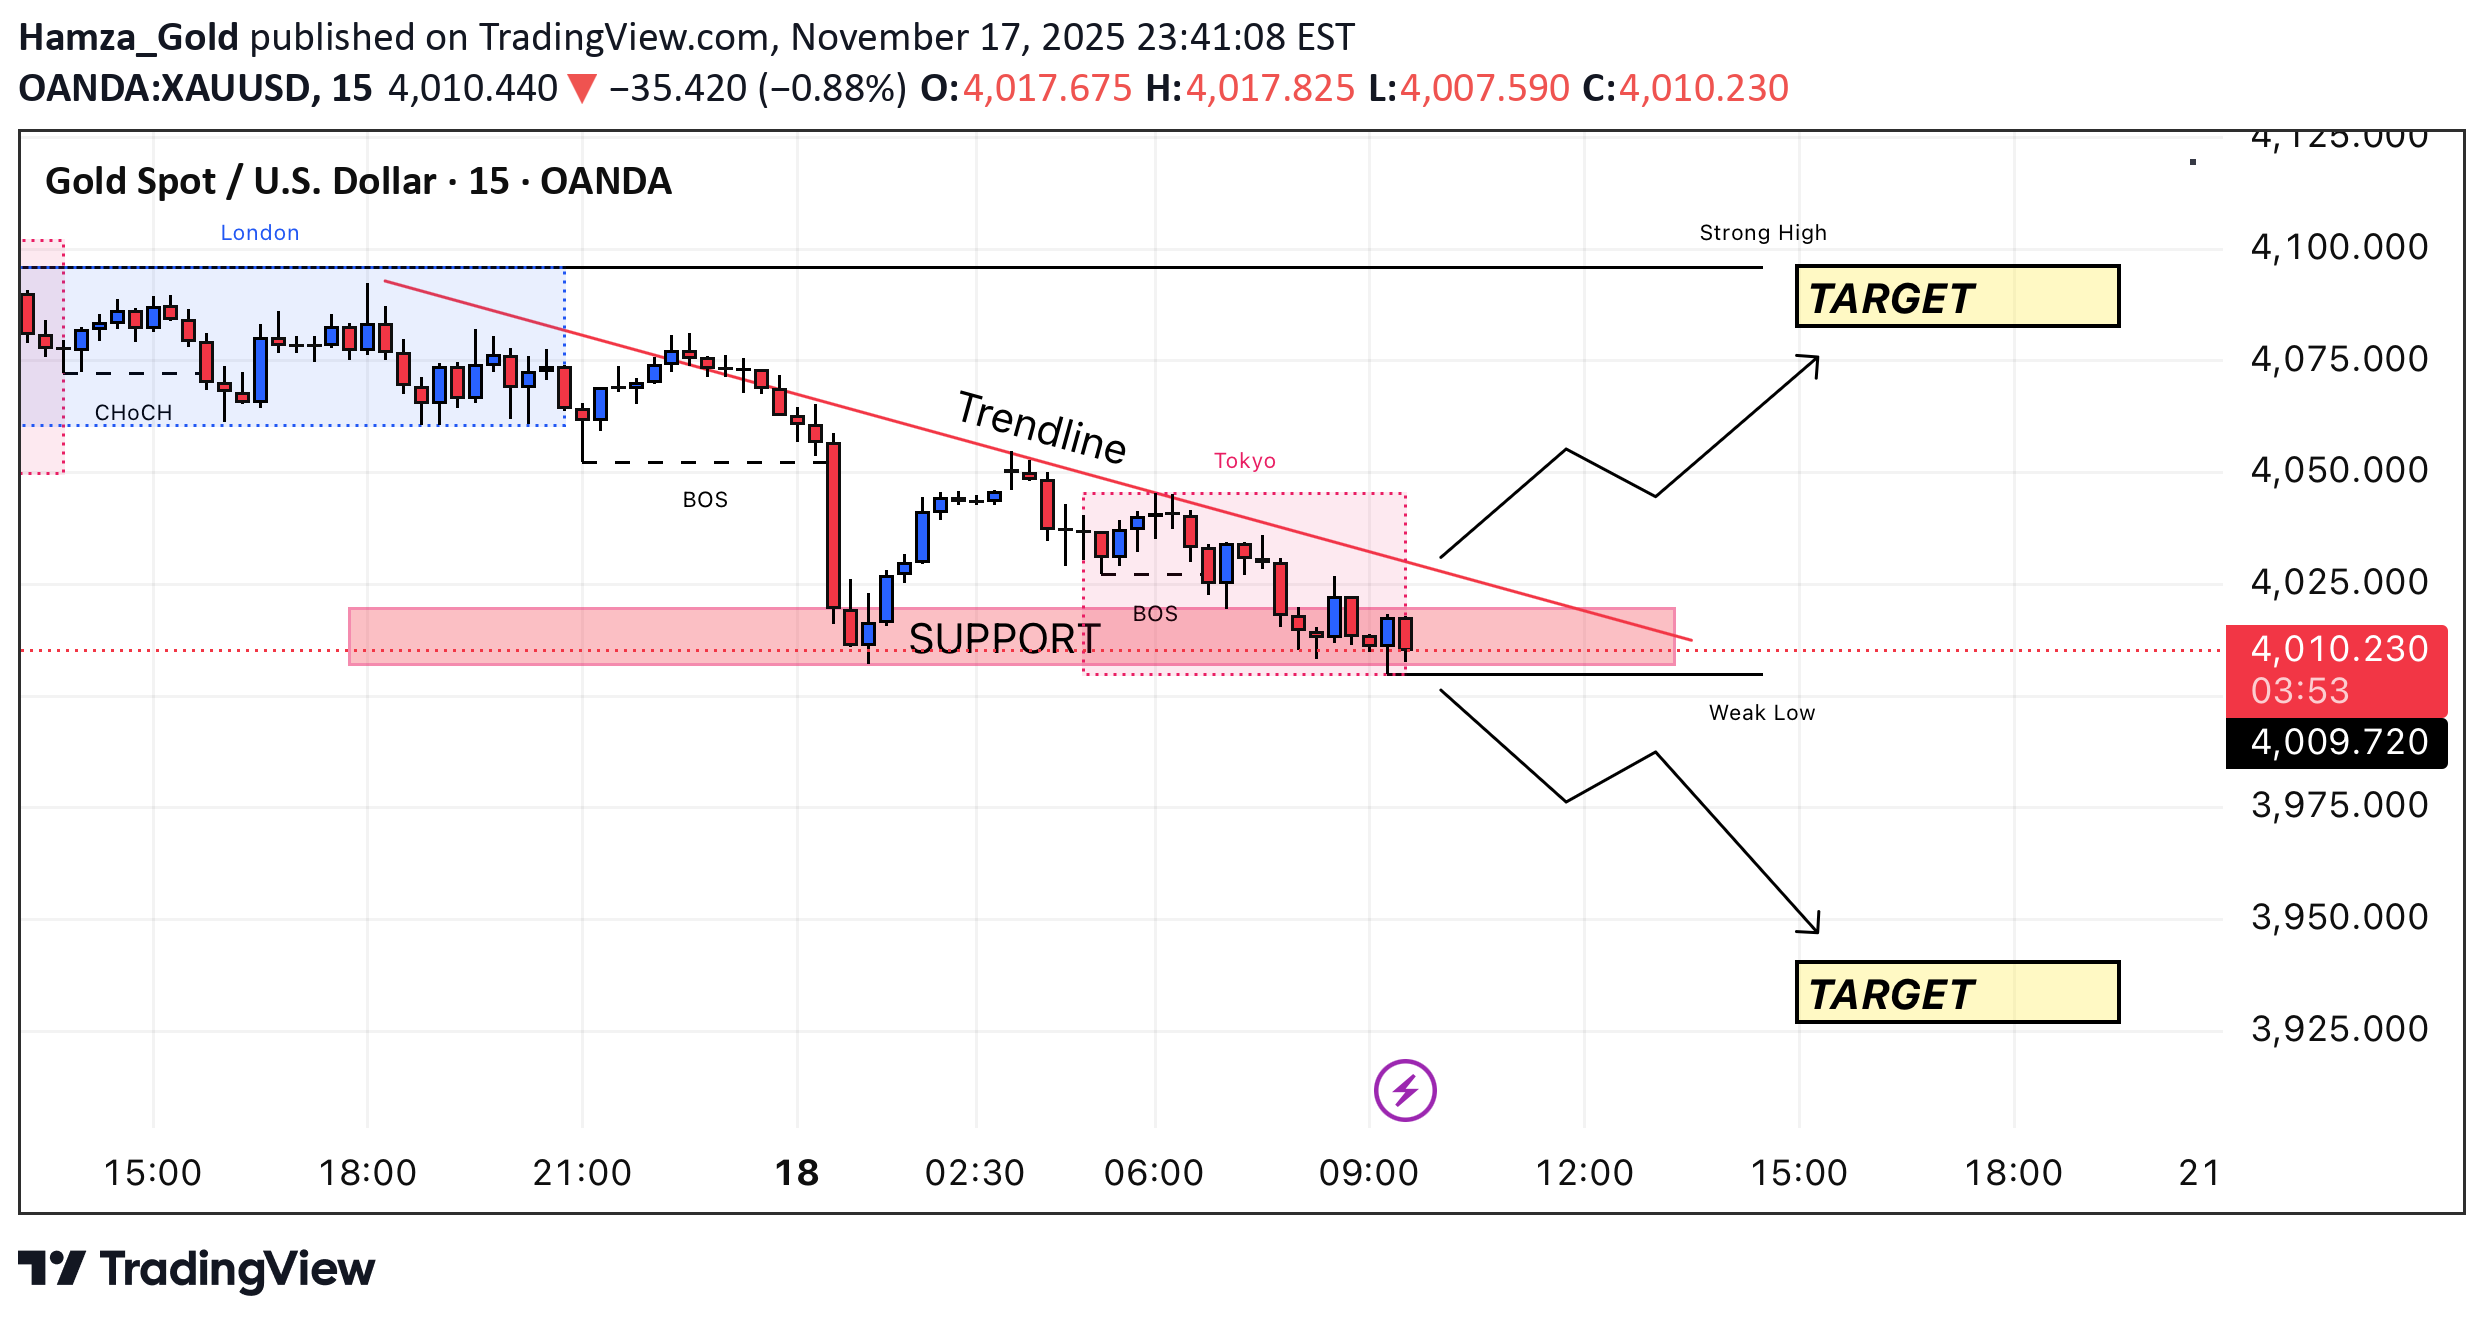
Price continues to trade within a descending structure, respecting a clear trendline acting as dynamic resistance. Each retest of the trendline has produced lower highs, confirming bearish order flow. Key Observations 🔹 Support Zone (Demand Area): Price is currently resting inside a strong support zone highlighted in red. This zone has previously generated bullish reactions, but recent candles show weakening demand. 🔹 Break of Structure (BOS): Multiple BOS levels confirm bearish momentum, suggesting sellers are still in control. 🔹 Weak Low Formation: The recent low is labeled as weak, indicating it may be targeted for liquidity before a potential reversal. 🔹 Tokyo Session Range: Price consolidated during Tokyo, forming a small distribution inside the trendline. Possible Scenarios 📈 Bullish Scenario If price rejects the support zone strongly and breaks above the descending trendline, we could see a bullish retracement toward the Strong High, targeting the upper yellow target zone (≈ 4080–4100). 📉 Bearish Scenario If support fails and price breaks below the weak low, expect continuation downward into the lower target zone (≈ 3940) where liquidity sits. Bias Short-term bearish as long as price remains under the trendline. Potential bullish reversal only if structure shifts (ChoCH/BOS to the upside).
Hamza_Gold
تست مجدد شکست ساختار طلا: آمادهسازی برای ریزش بزرگ بعدی!
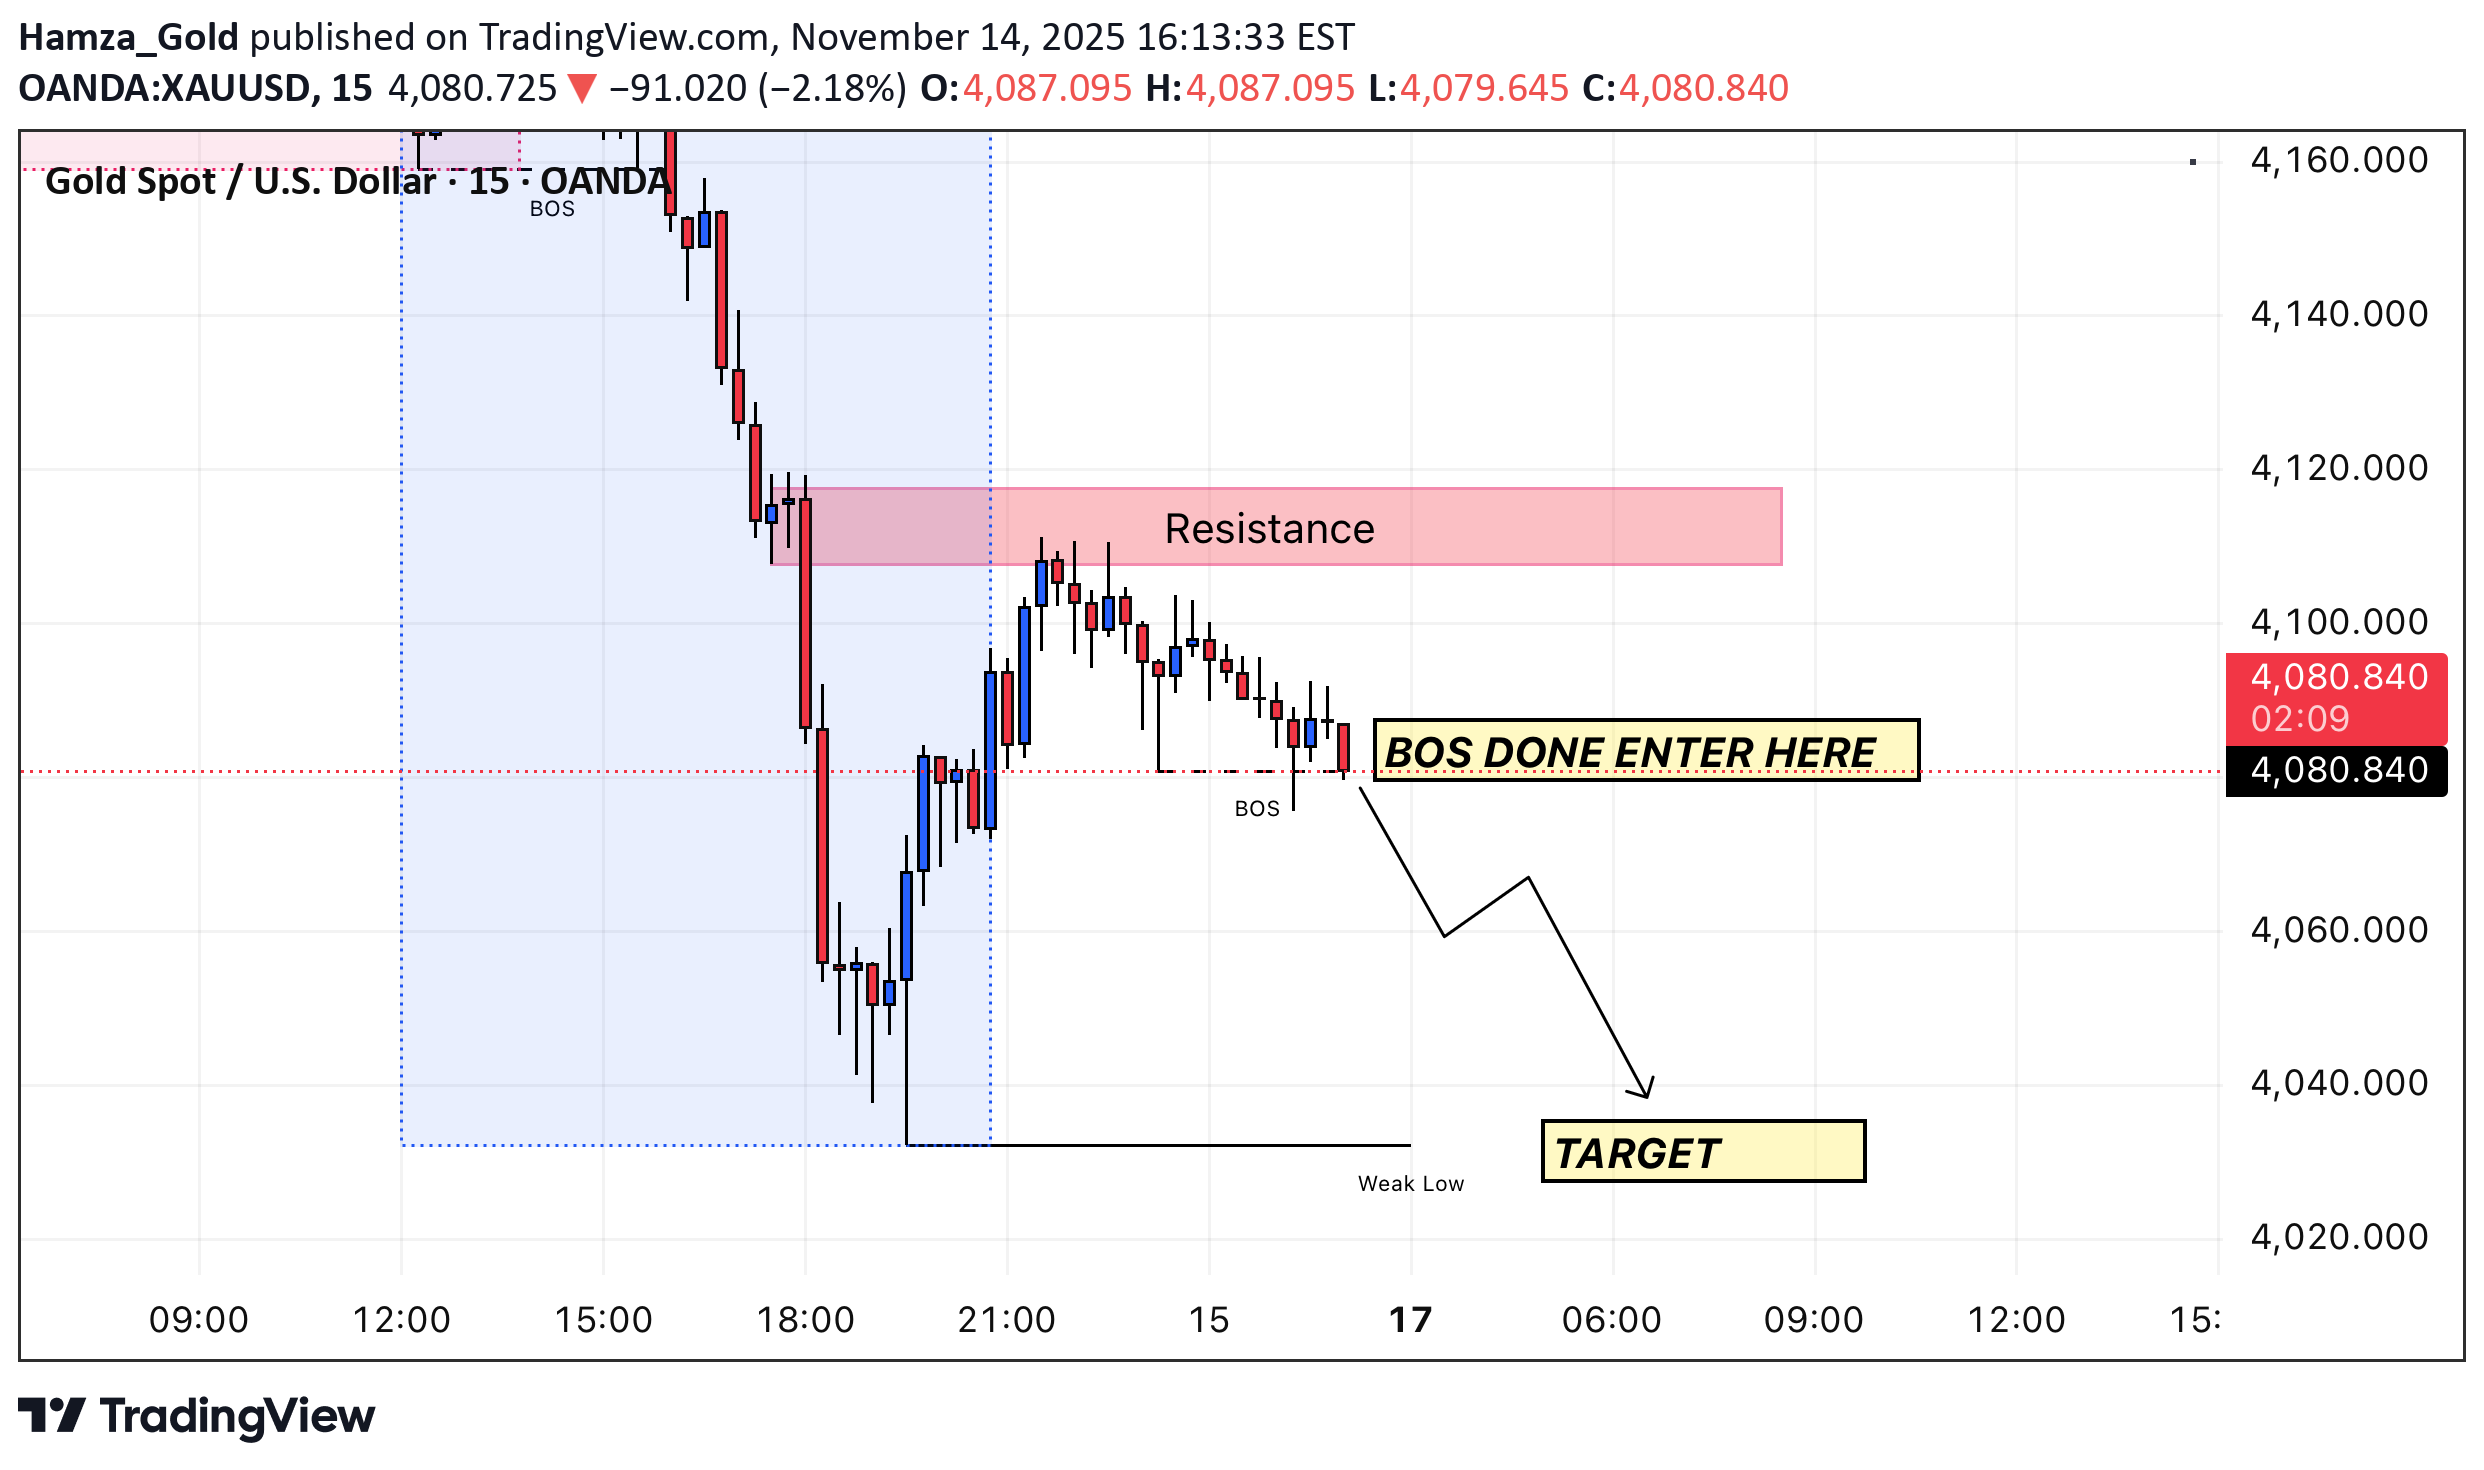
Price has recently reacted from a major resistance zone, showing clear selling pressure after tapping into the highlighted supply area. Following the strong bearish impulse, the market created a Break of Structure (BOS) to the downside, confirming bearish intent. After the BOS, price pulled back with a series of weak bullish candles, forming a corrective structure. This aligns with a typical lower-timeframe retracement before continuation. Price is now approaching the marked entry zone, where the market completed its BOS retest. As long as price remains below the resistance zone, bearish continuation remains the higher-probability scenario. Bearish Expectations •Entry: At BOS retest level (as marked on chart) •Bias: Sell continuation •Target: Sweep of the weak low, with potential extension toward lower liquidity levels •Invalidation: A clean break and hold above the resistance zone Overall sentiment remains bearish unless buyers reclaim structure above resistance.
Hamza_Gold
تحلیل طلا (XAU/USD) در تایم فریم 15 دقیقه: شکار نقدینگی با روش SMC
1. Macro & Higher Timeframe Bias (H4/D1) The higher timeframe (H4/Daily) suggests a [Bullish/Bearish] bias, currently consolidating after a recent [major impulse move/retracement]. The current M15 move is interpreted as a [short-term continuation/complex pullback] within that larger structure. We are approaching key liquidity zones defined by the H4 swing [High/Low] at [Price Level 1]. 2. Current M15 Market Structure • Previous Structural Break (BOS): Price recently executed a Break of Structure (BOS) to the [Upside/Downside] at [Price Level 2], confirming the immediate short-term bias. • Current Inducement/Liquidity: The structure has created clear short-term liquidity [Above/Below] the current price action, specifically a visible equal [Highs/Lows] area around [Price Level 3]. This liquidity is the primary target for the next impulsive move. • Key Reversal (ChoCH): Should price violate the last confirmed swing low (or high) at [Price Level 4], it would represent a Change of Character (ChoCH), signaling a likely shift in the M15 bias and invalidating the current structural view. 3. Point of Interest (POI) & Trading Plan Our focus is on the unmitigated Point of Interest (POI) created during the last impulsive structural move. Scenario: [Long/Short] Setup 1. POI Identified: The most favorable Order Block (OB) / Fair Value Gap (FVG) sits between [Entry Price High] and [Entry Price Low]. This zone is located [after/before] the sweep of the short-term liquidity at [Price Level 3]. 2. Entry Condition: Wait for price to aggressively tap the POI and show an M1/M5 Confirmation Entry (e.g., a mini-ChoCH or rejection candle) before execution. 3. Target (TP): The primary target is the major external liquidity, specifically the [previous swing high/equal highs] at [Target Price]. 4. Invalidation (SL): The protective stop-loss is placed securely [X] pips beyond the Order Block/POI at [Stop-Loss Price], invalidating the setup if the Order Block is fully breached. Summary: We are waiting for a clear sweep of liquidity, a tap into the unmitigated demand/supply POI, and subsequent lower timeframe confirmation to execute the [Long/Short] trade.
Hamza_Gold
بیت کوین در آستانه ریزش؛ اصلاح قیمت به کدام سطح میرسد؟
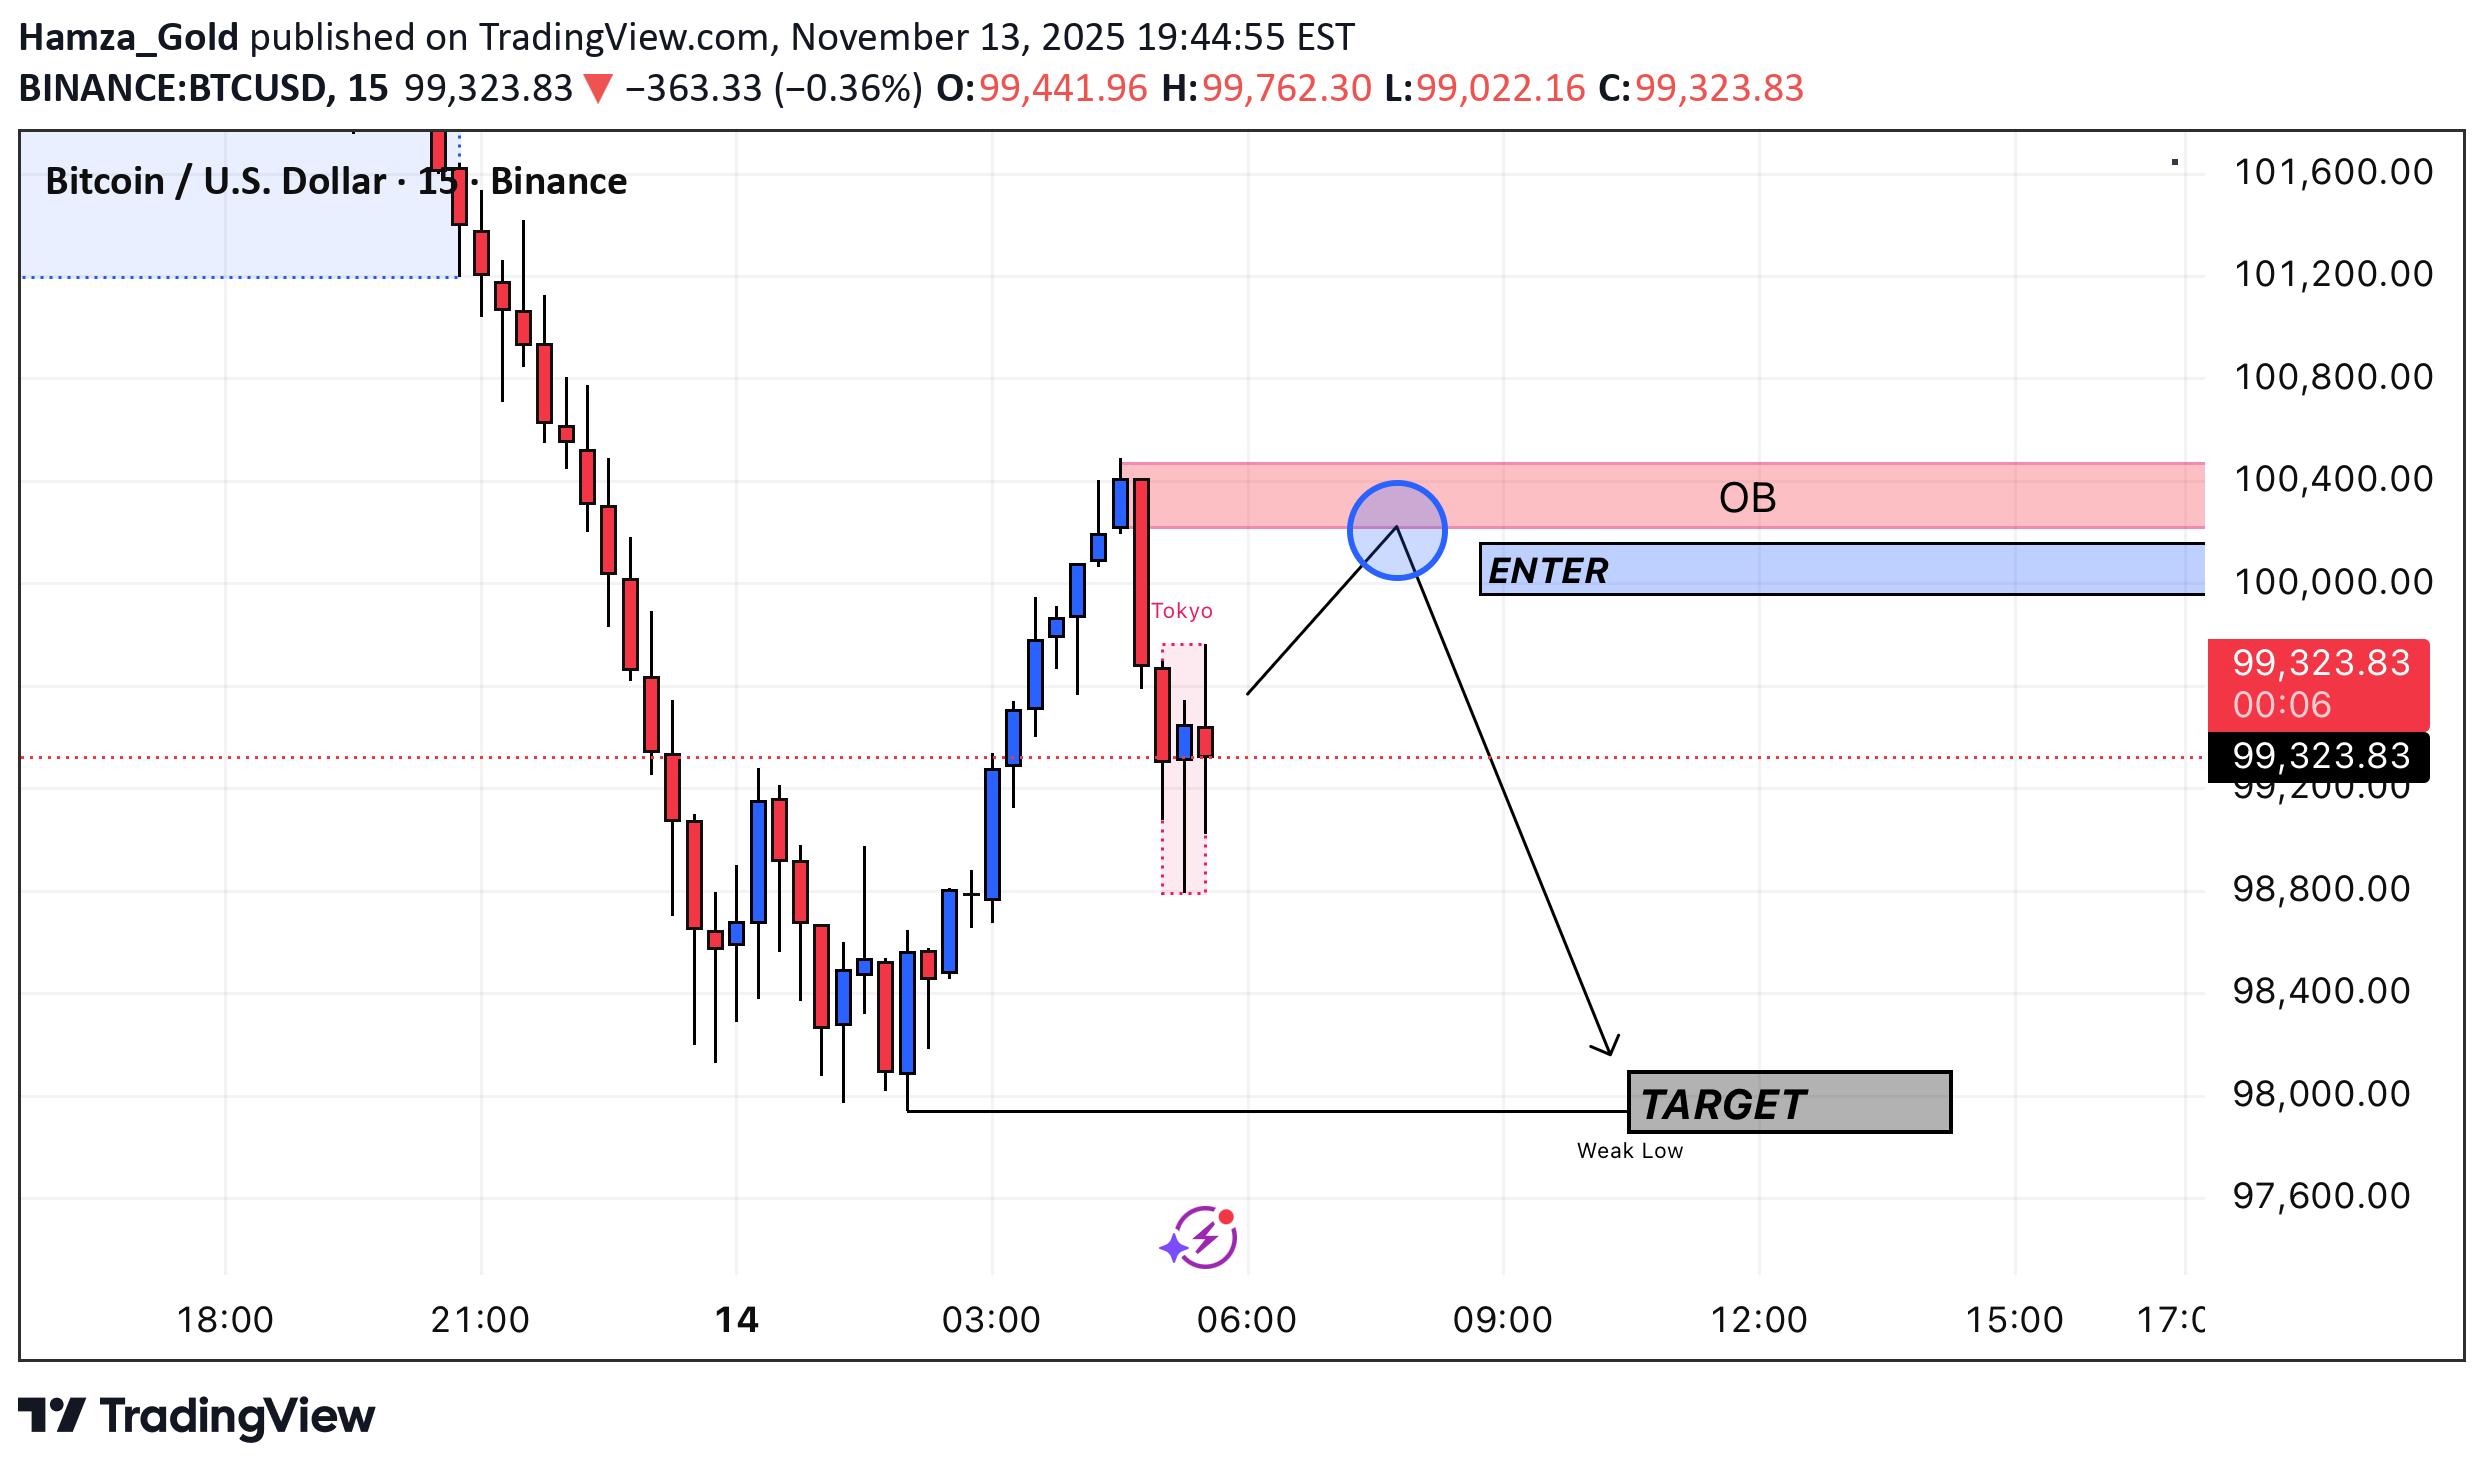
Price is expected to retrace into the 100,000–100,400 OB,targeting the weak low at 98,000.
Hamza_Gold
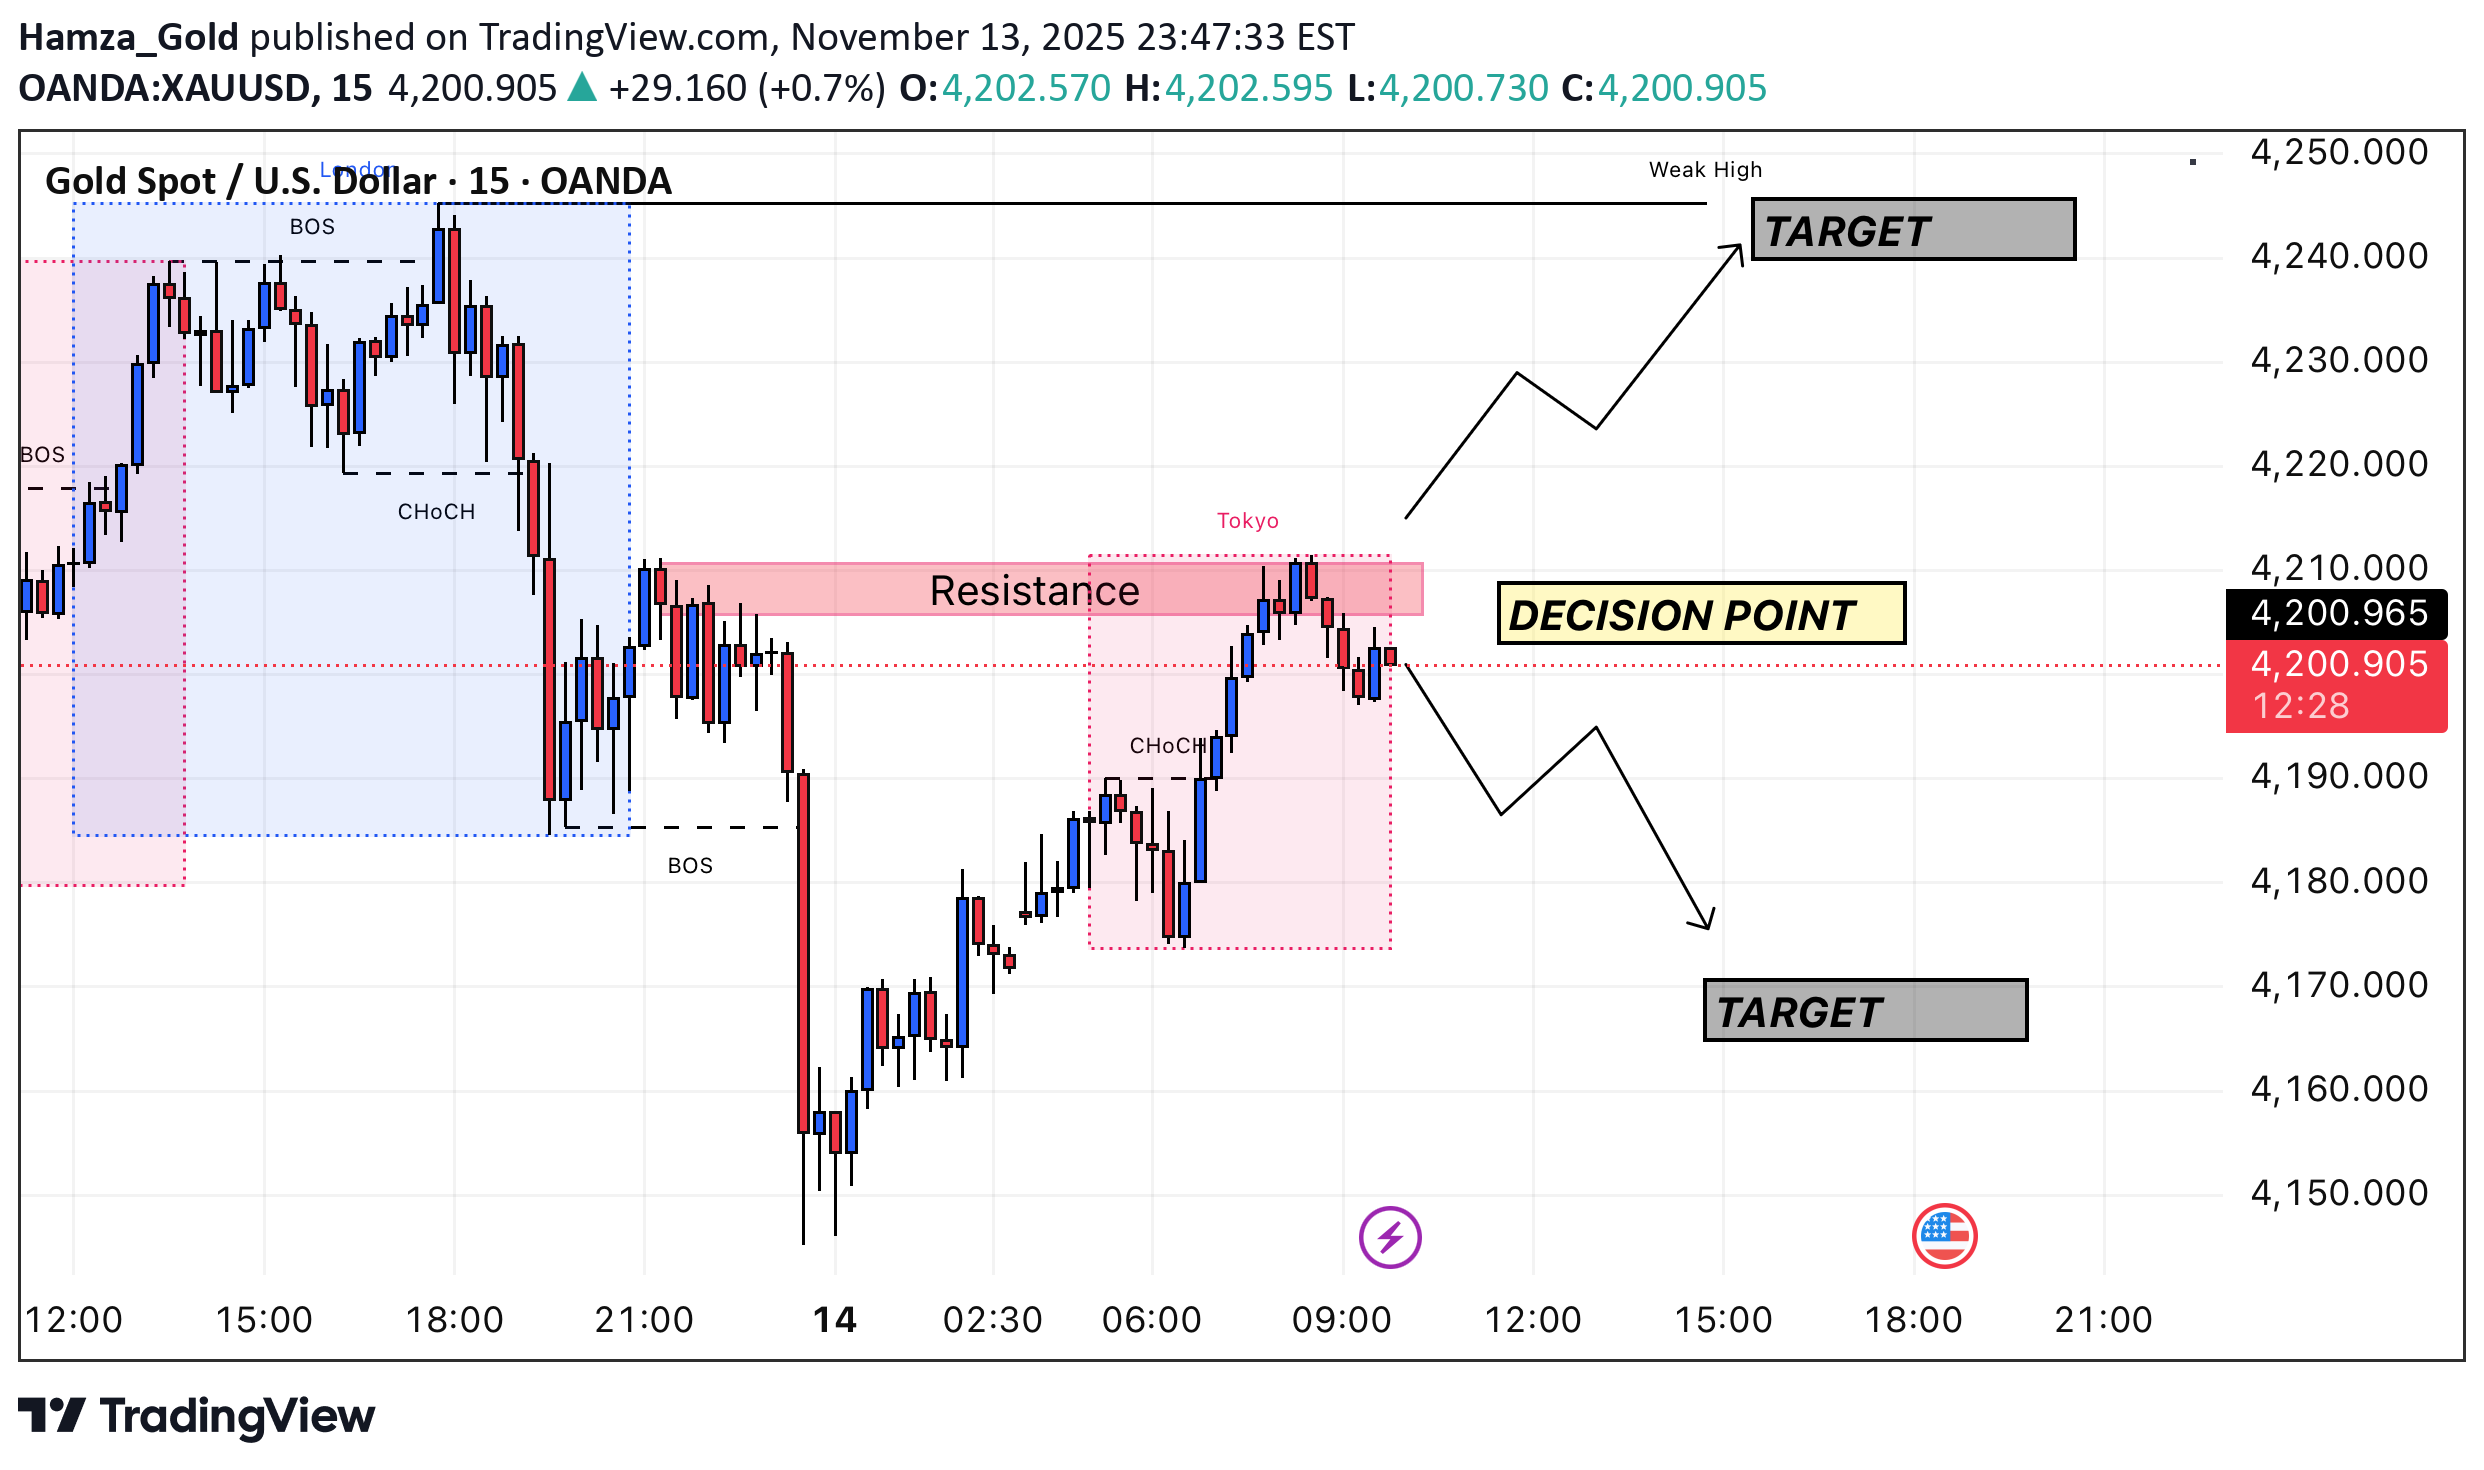
طلا و دلار (XAUUSD): نشانههای قوی برگشت صعودی پس از نفوذ به شکاف قیمتی!
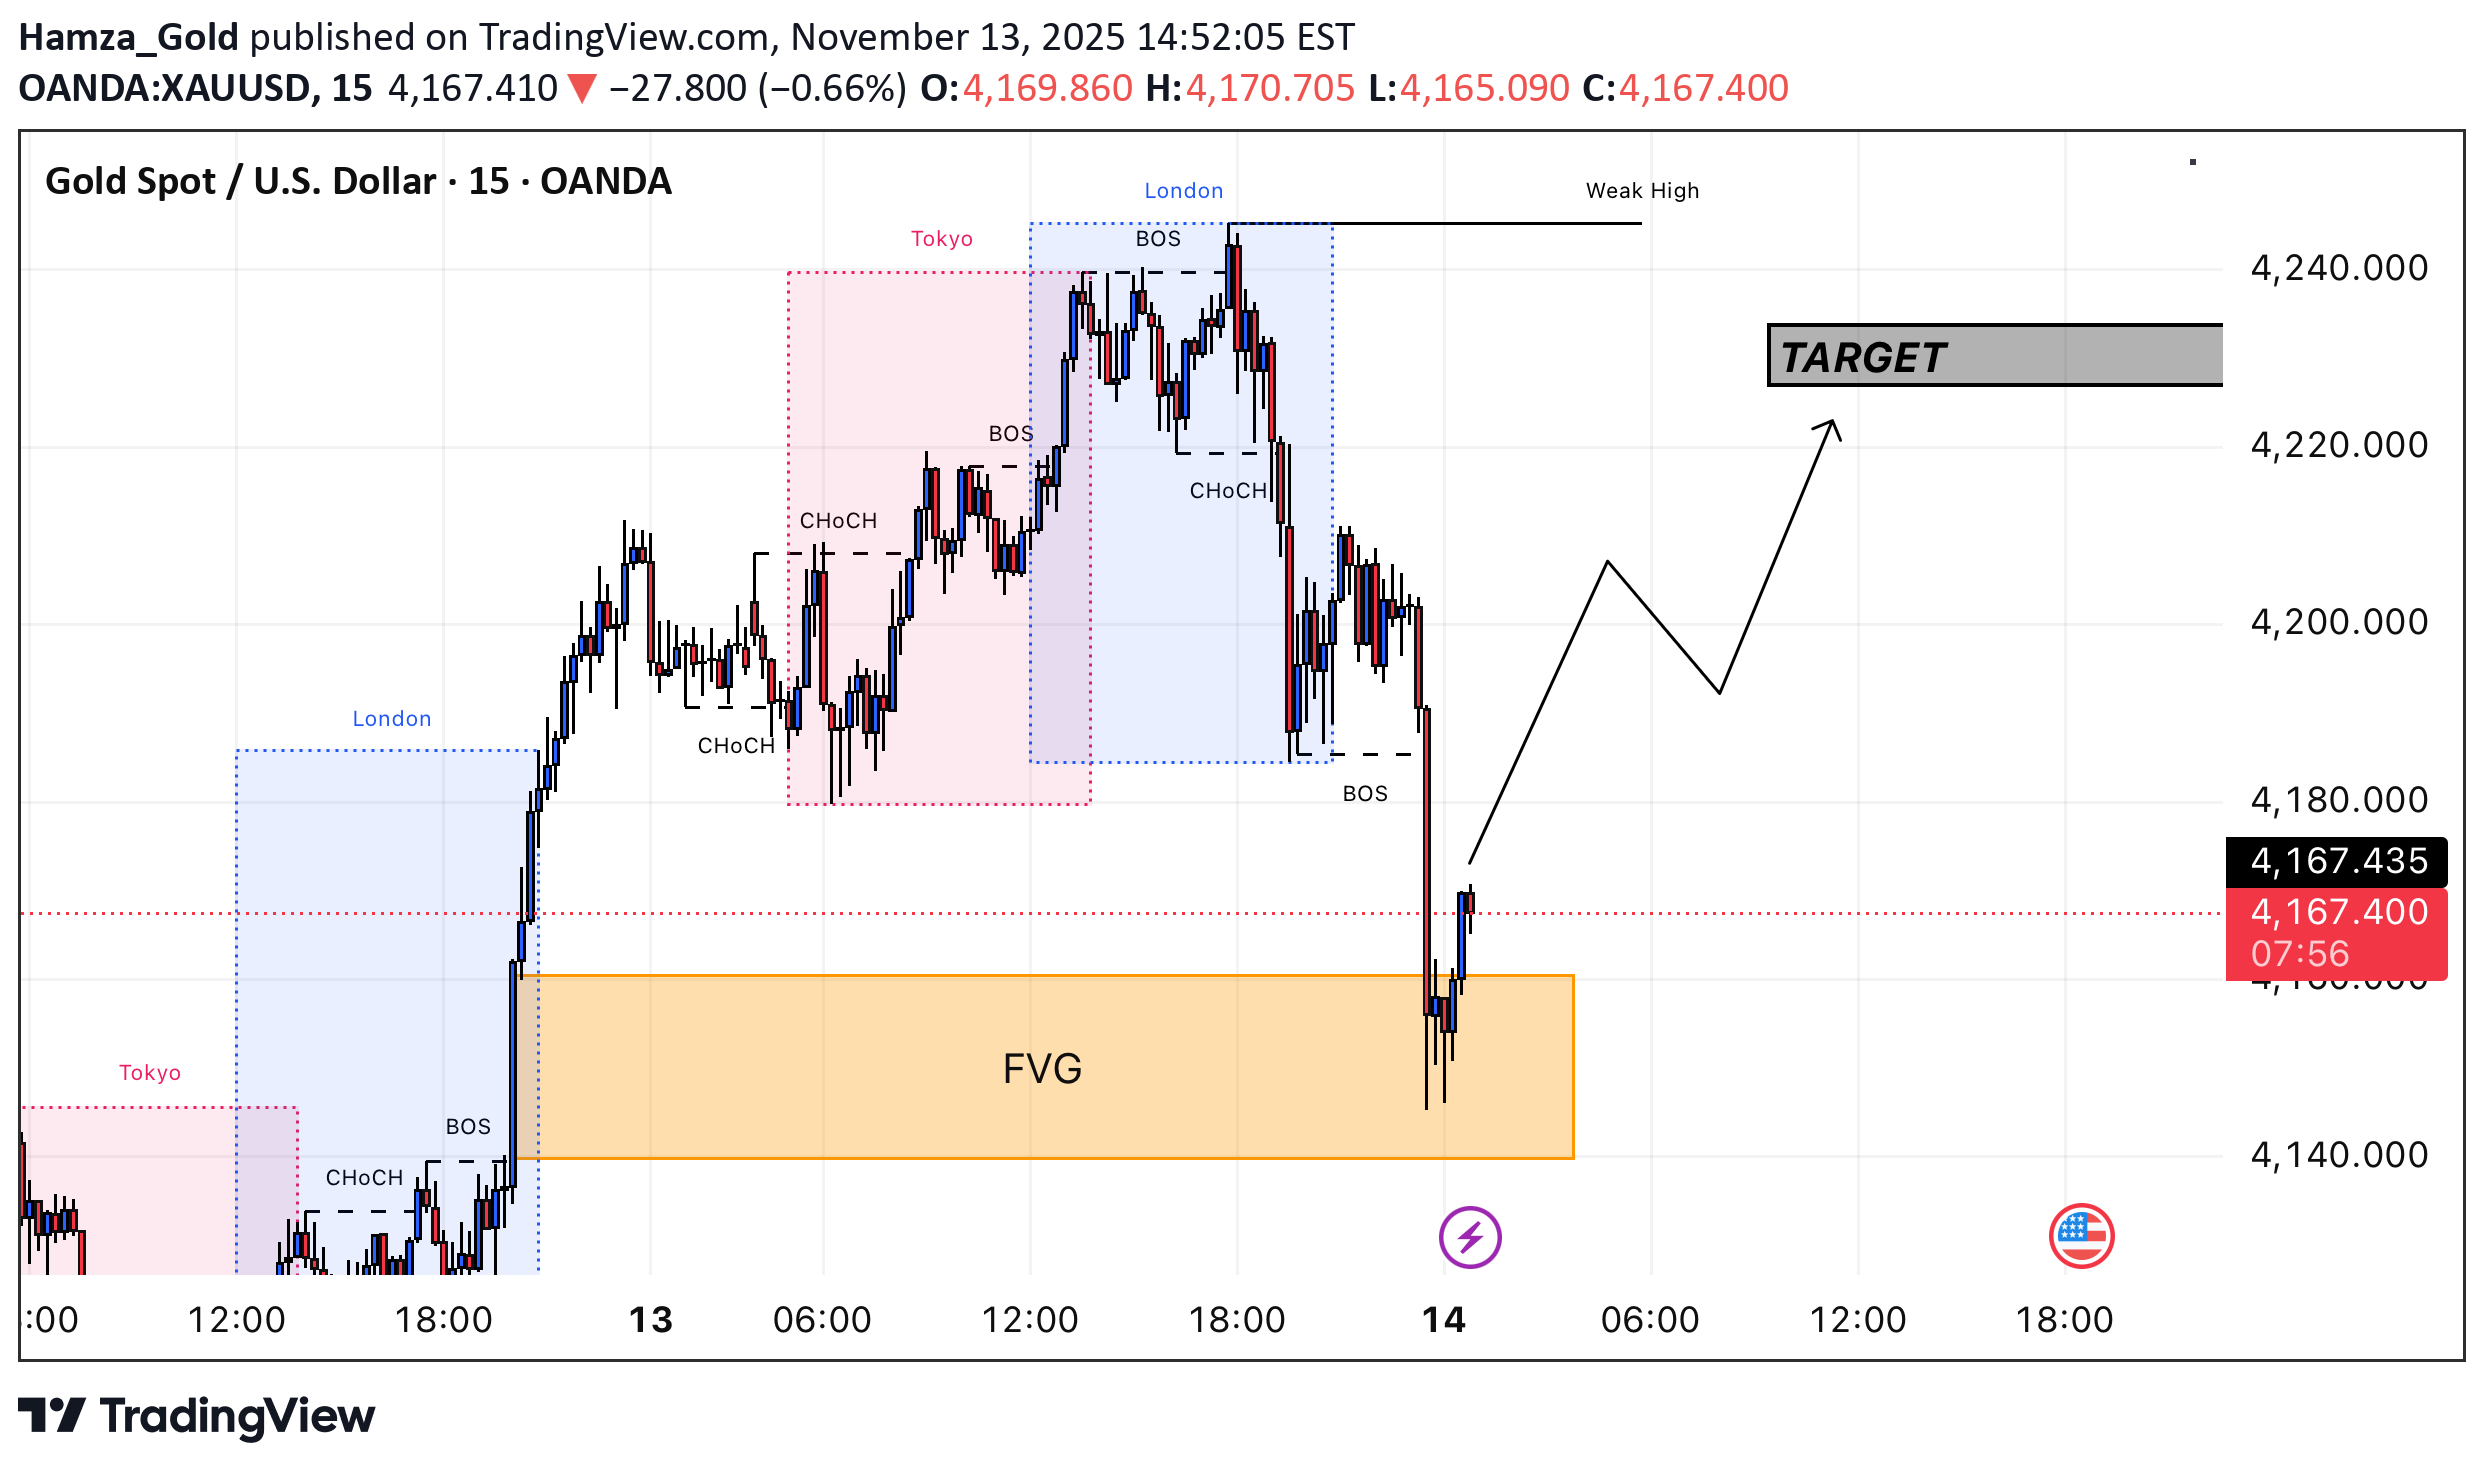
Price has recently delivered a strong sell-side sweep into the marked FVG (Fair Value Gap) inside the discount zone of the current swing range. After tapping into this imbalance, buyers stepped in, showing a sharp reaction and a potential shift back toward bullish order flow. 🔍 Key Observations •CHoCH & BOS sequences across multiple sessions (Tokyo / London) indicate transitions in liquidity and directional intent. •The latest BOS to the upside after rejecting the FVG suggests that price may be ready to retrace higher. •The prior London session high is marked as a Weak High, making it a likely target for liquidity engineering. •Current price action shows early signs of forming a higher-low structure, aligning with a bullish continuation model. 🎯 Bullish Scenario If price maintains support above the FVG mitigation and continues forming higher highs/higher lows, the next upside objectives are: •Inefficiency fill •Sweep of the Weak High •Target zone around 4,220 as illustrated ❗️Invalidation A clean break back below the FVG with displacement would invalidate the bullish scenario and open the door for deeper downside.
Hamza_Gold
دگرگونی صعودی بیت کوین از حمایت کلیدی؛ ورود برای سود در کانال 105 هزار دلاری!
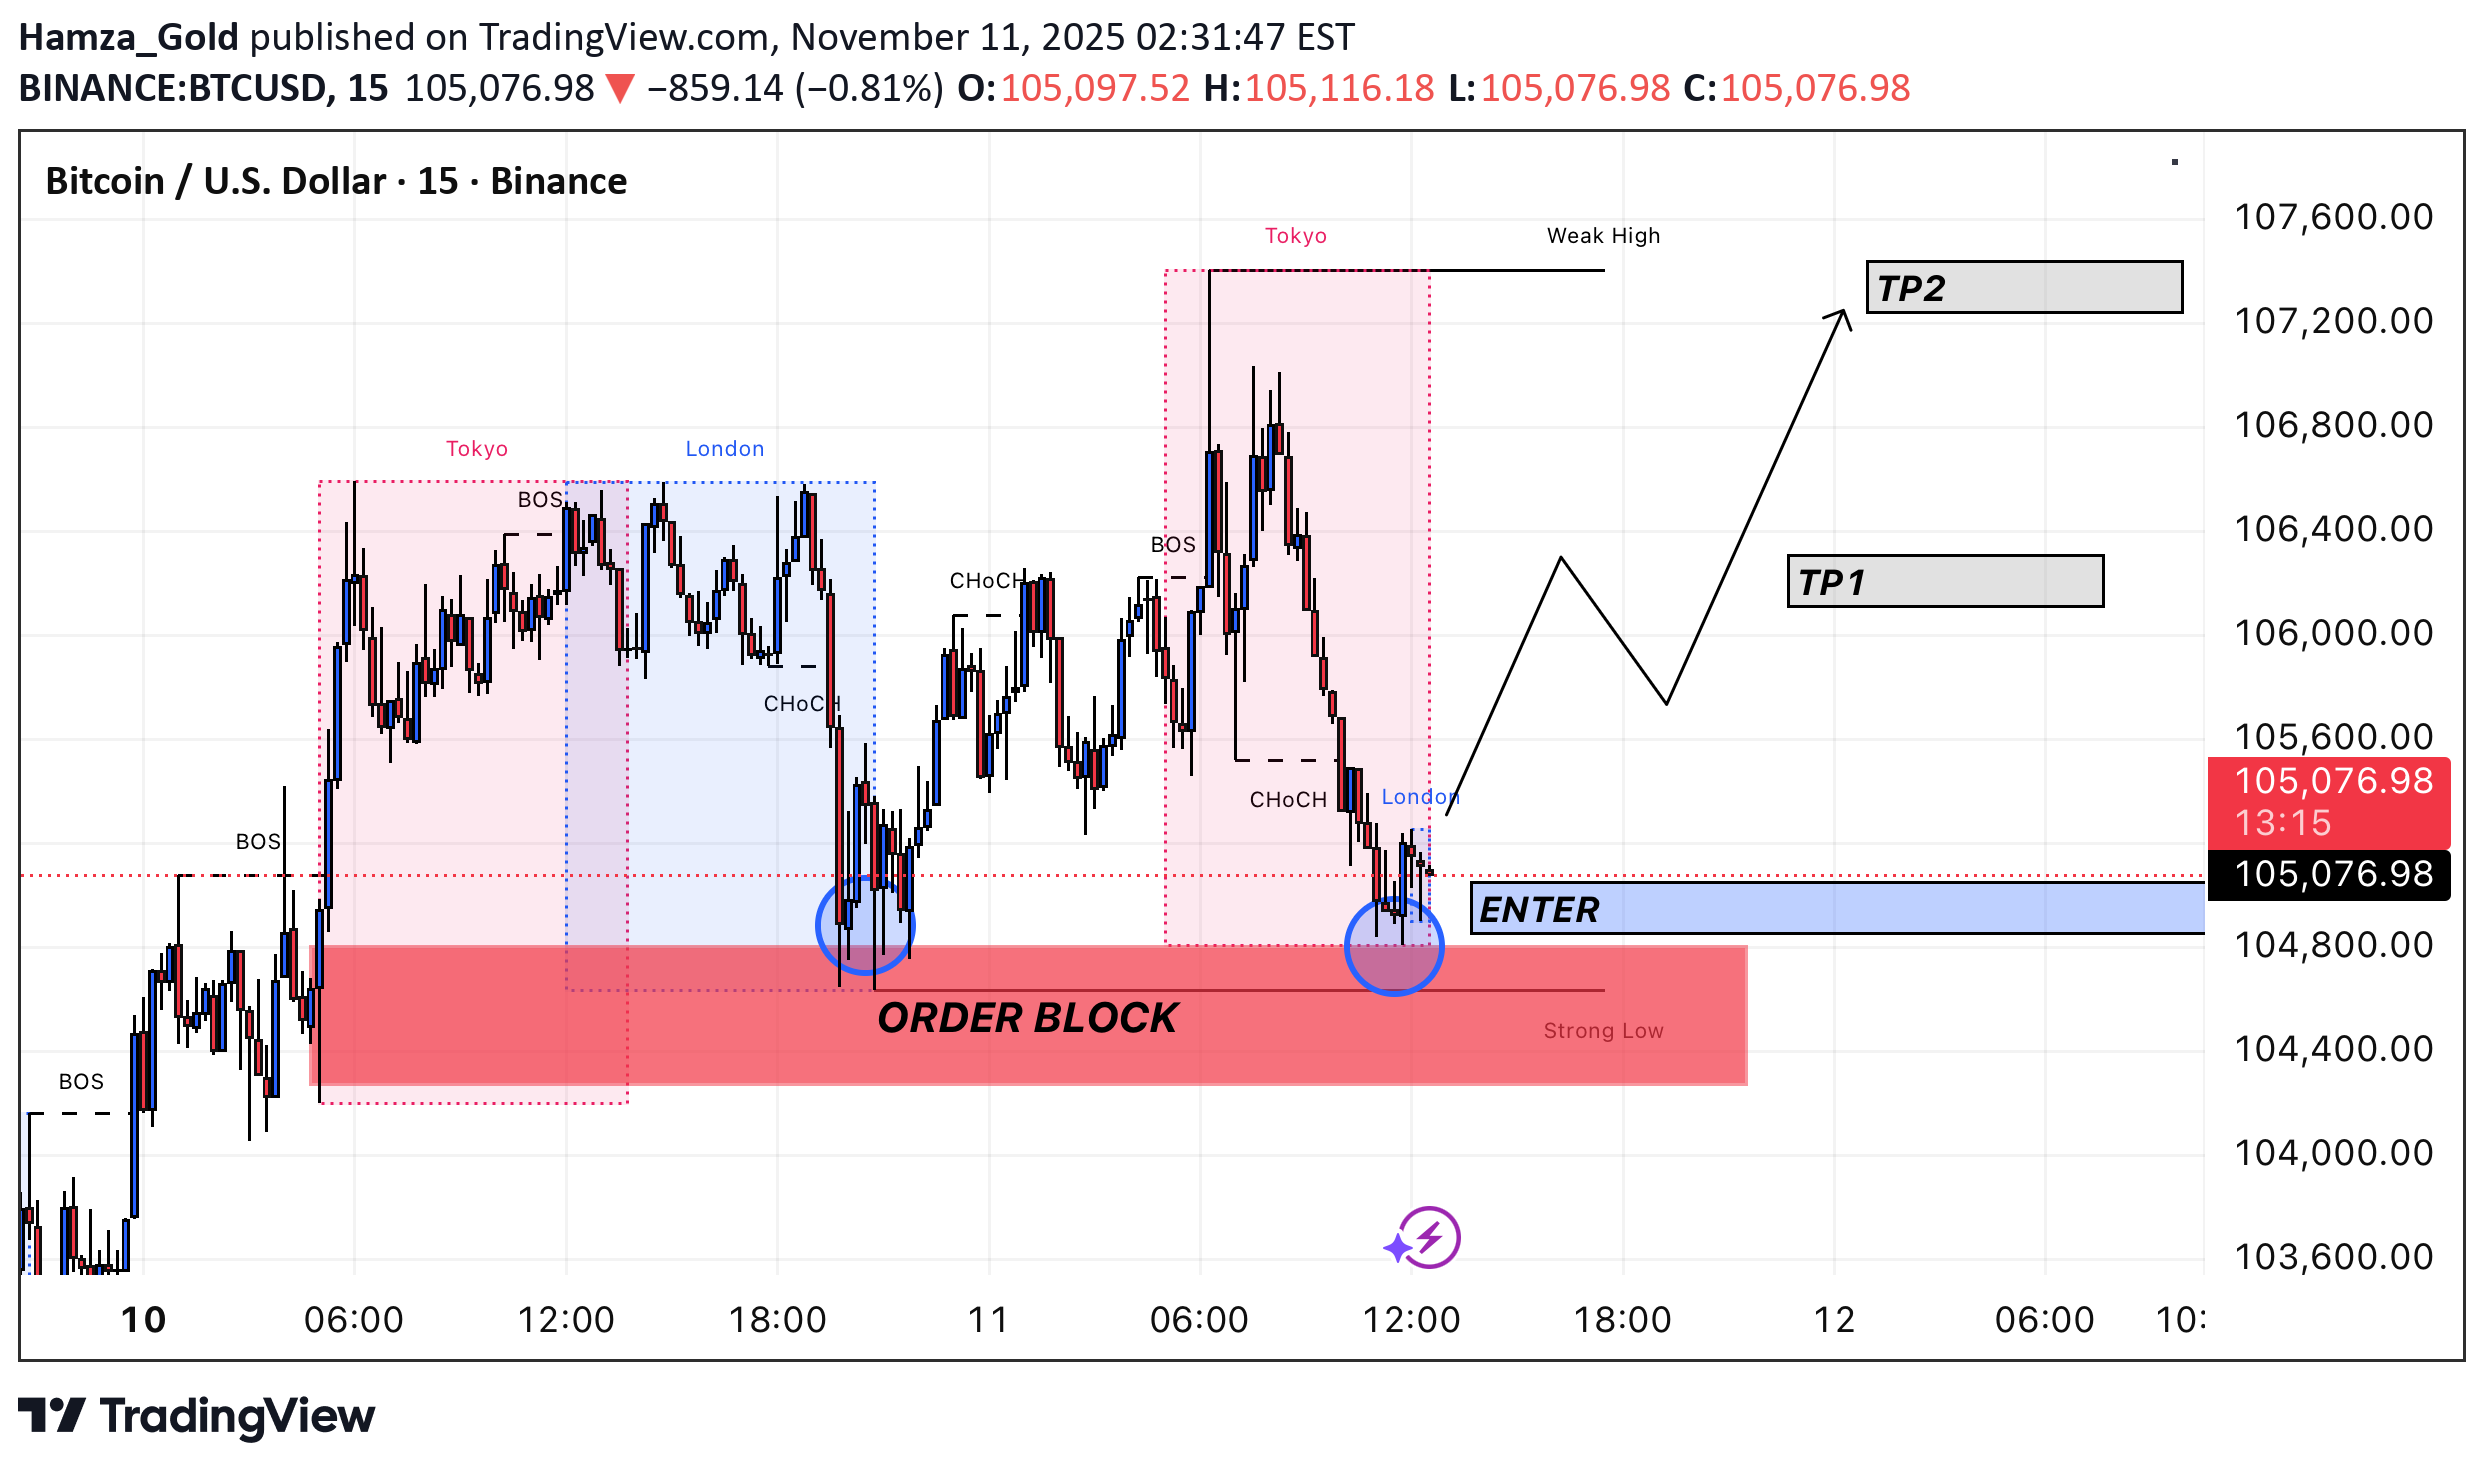
Price is currently reacting from a key bullish order block after forming a clear CHoCH near the strong low, suggesting potential accumulation and bullish intent. As long as the order block holds, buyers may drive price toward higher liquidity areas. Buy Entry: 104,900 – 105,100 Targets: TP1: 106,400 TP2: 107,200 Invalidation: Break below 104,700
Disclaimer
Any content and materials included in Sahmeto's website and official communication channels are a compilation of personal opinions and analyses and are not binding. They do not constitute any recommendation for buying, selling, entering or exiting the stock market and cryptocurrency market. Also, all news and analyses included in the website and channels are merely republished information from official and unofficial domestic and foreign sources, and it is obvious that users of the said content are responsible for following up and ensuring the authenticity and accuracy of the materials. Therefore, while disclaiming responsibility, it is declared that the responsibility for any decision-making, action, and potential profit and loss in the capital market and cryptocurrency market lies with the trader.