
OXT
Orchid
| تریدر | نوع سیگنال | حد سود/ضرر | زمان انتشار | مشاهده پیام |
|---|---|---|---|---|
No results found. | ||||
Price Chart of Orchid
سود 3 Months :
سیگنالهای Orchid
Filter
Sort messages by
Trader Type
Time Frame

Crypto_alphabit
تحلیل کامل و استراتژی خرید ارز دیجیتال OXT (اسپات): اهداف قیمتی و نکات طلایی ورود
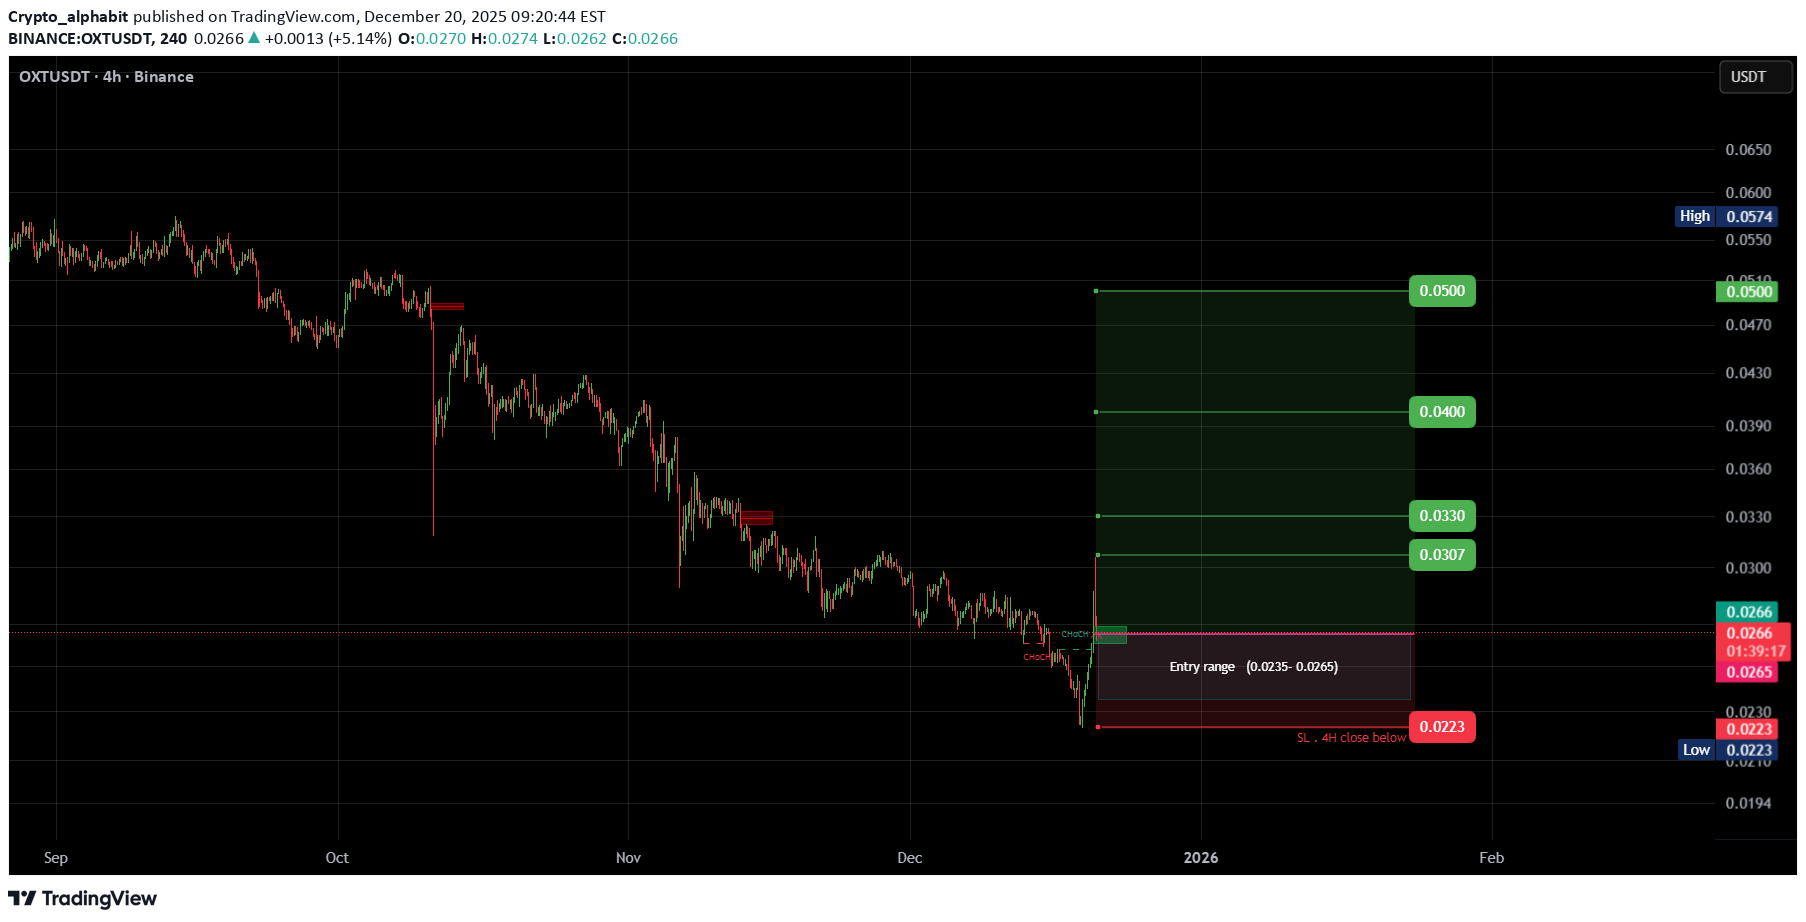
OXTUSDT #OXT/ USDT Entry range (0.0235- 0.0265) SL 4H close below 0.0223 T1 0.0307 T2 0.0330 T3 0.0400 T4 0.0500 _______________________________________________________ Golden Advices. ******************** * collect the coin slowly in the entry range. * Please calculate your losses before the entry. * Do not enter any trade you find it not suitable for you. * No FOMO - No Rush , it is a long journey.

BandForBands
معامله OXT: تحلیل ریسکی با استراتژی قوی و نقطه حمایت کلیدی!
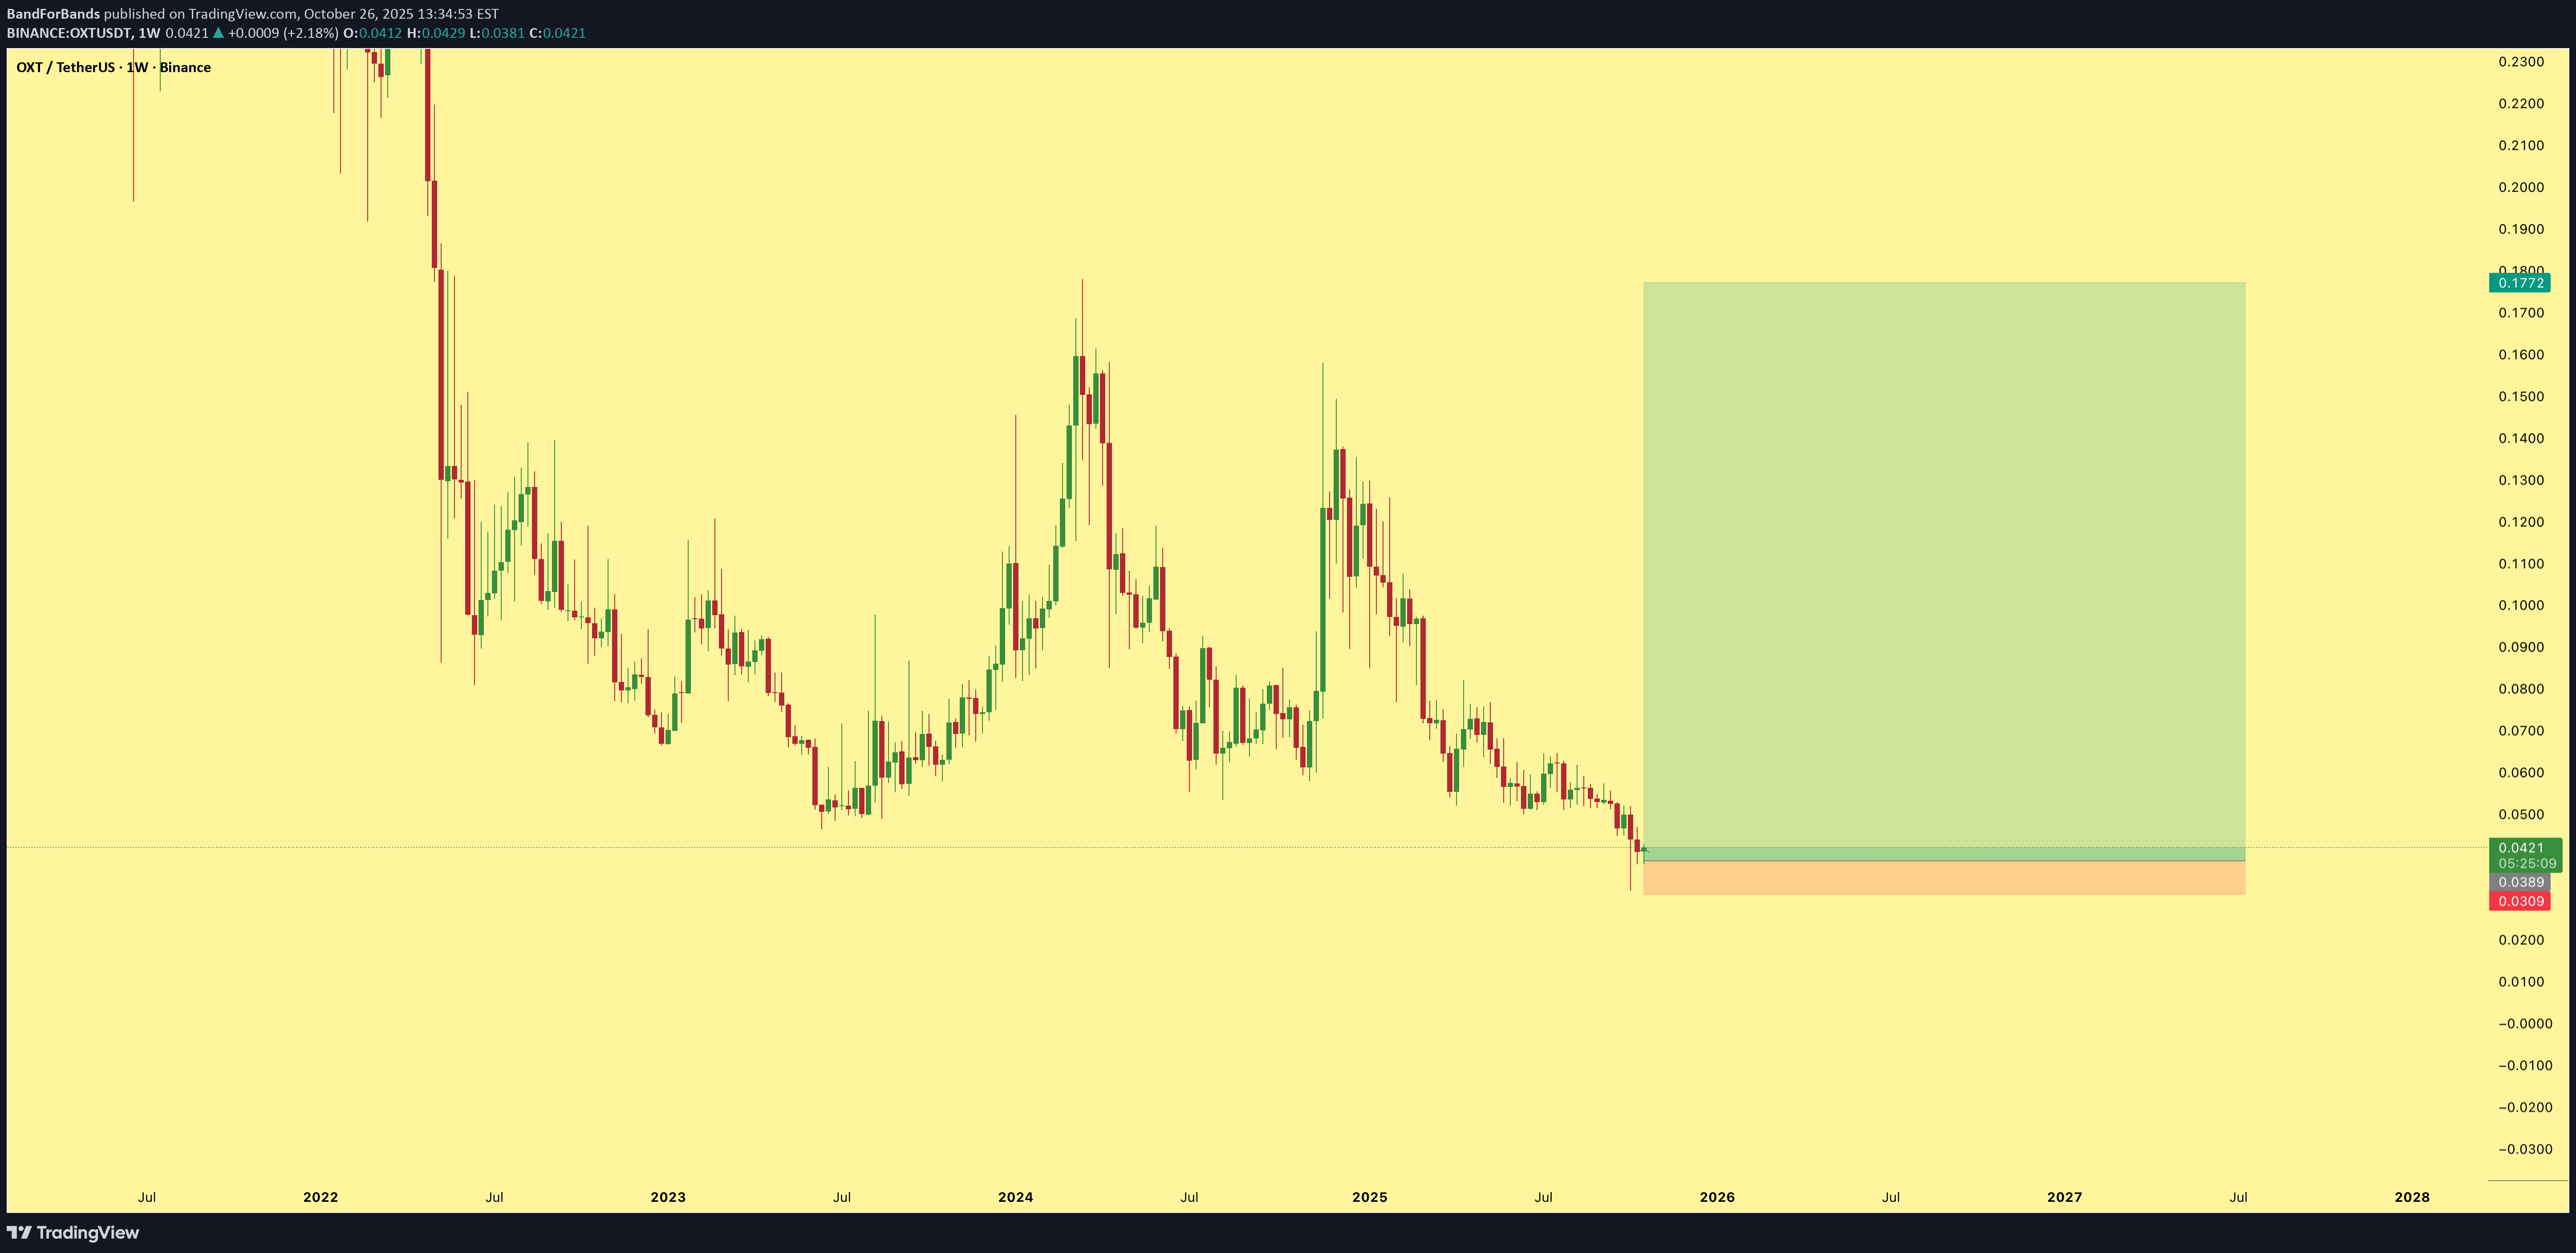
I’m taking some risk here with this $OXT trade, the setup looks solid with clear stop loss and target levels. Structure is defined, and I’m confident in the R:R if price respects the support zone.

Se7enSkies
Bearish Price Action Continuation

Technically, a falling wedge should be a bullish pattern, but with OXT every pattern is a Bearish pattern. OXT has been in a downtrend for close to 6 years and it continues to form lower highs and lower lows. OXT broke below its all time low. Price has broken and closed below the support line of the falling wedge. Price has been struggling to get back into the falling wedge which could mean that the bottom is not in for OXT and there is more downside price action awaiting for this failed project. Failed VPN, Failed GenAi. OXT started with good ideas, but all of them have failed. OKX delisting did not help this project in the middle of a bull market. Let me be clear, the crypto market is in a bull market, but OXT is in a bear market. Suspension of X account added to Orchid’s misery. The launch of GenAi has only tried to keep Orchid relevant in the crypto space, but it has utterly failed in keeping Orchid relevant in a competitive environment. The price chart reflects the failure of the team and when the chart is studied properly, it becomes evident that this failed token is used for many pumps and dump scams as well, which may be a reason to delist OXT in many major crypto exchanges in a near future.

Bithereum_io
OXTUSDT 1D
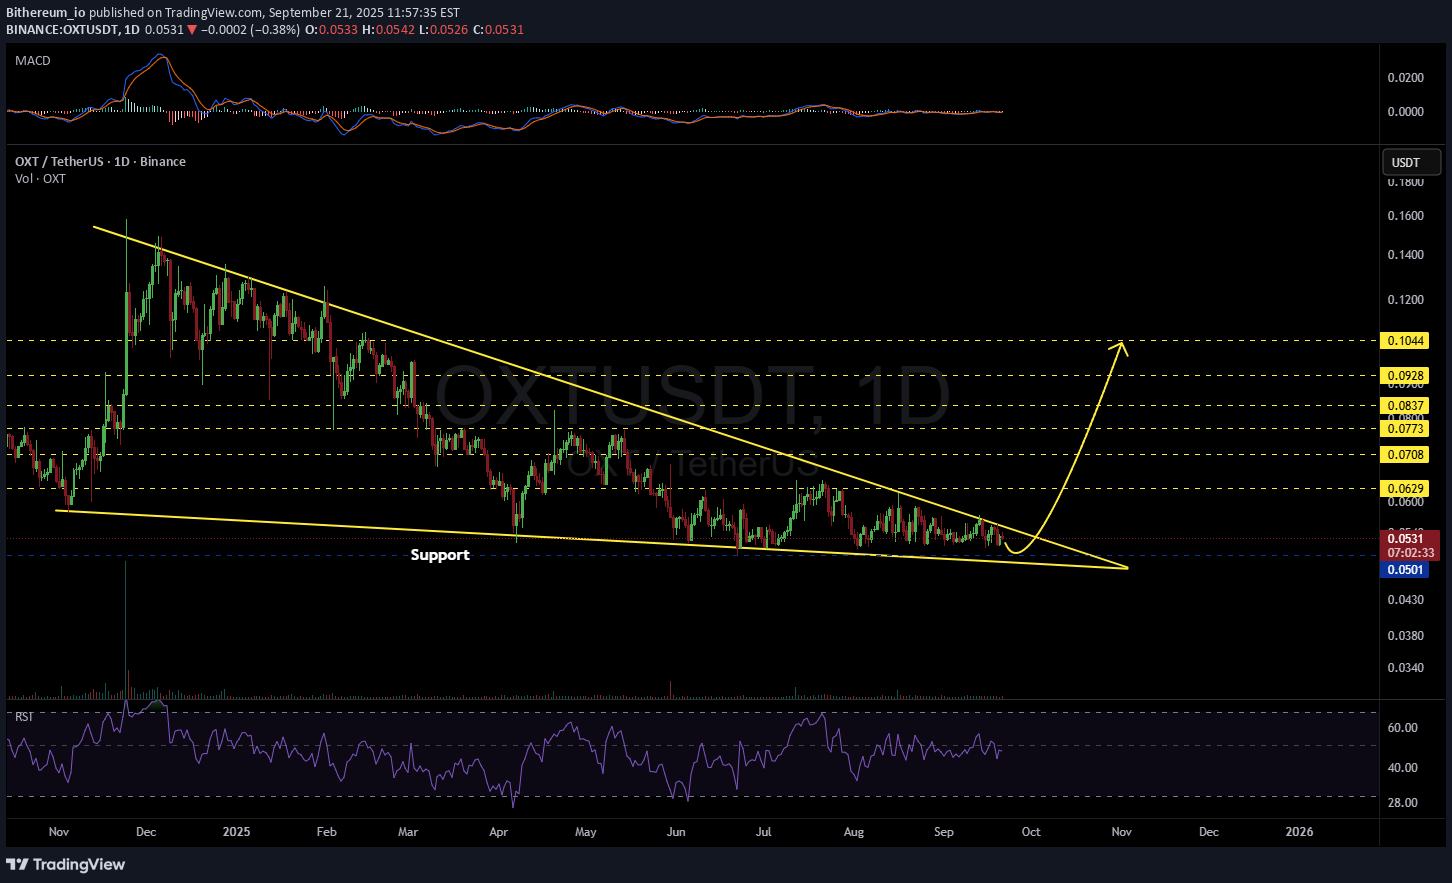
#OXT is moving inside a falling wedge pattern on the daily chart. Consider buying here at the current price and near the support level of: 🛡 $0.0501 In case of a breakout above the wedge resistance, the potential targets are: 🎯 $0.0629 🎯 $0.0708 🎯 $0.0773 🎯 $0.0837 🎯 $0.0928 🎯 $0.1044 ⚠️ Always remember to use a tight stop-loss and follow proper risk management.

CryptoNuclear
OXT/USDT — Decision Zone: Reversal or Breakdown?
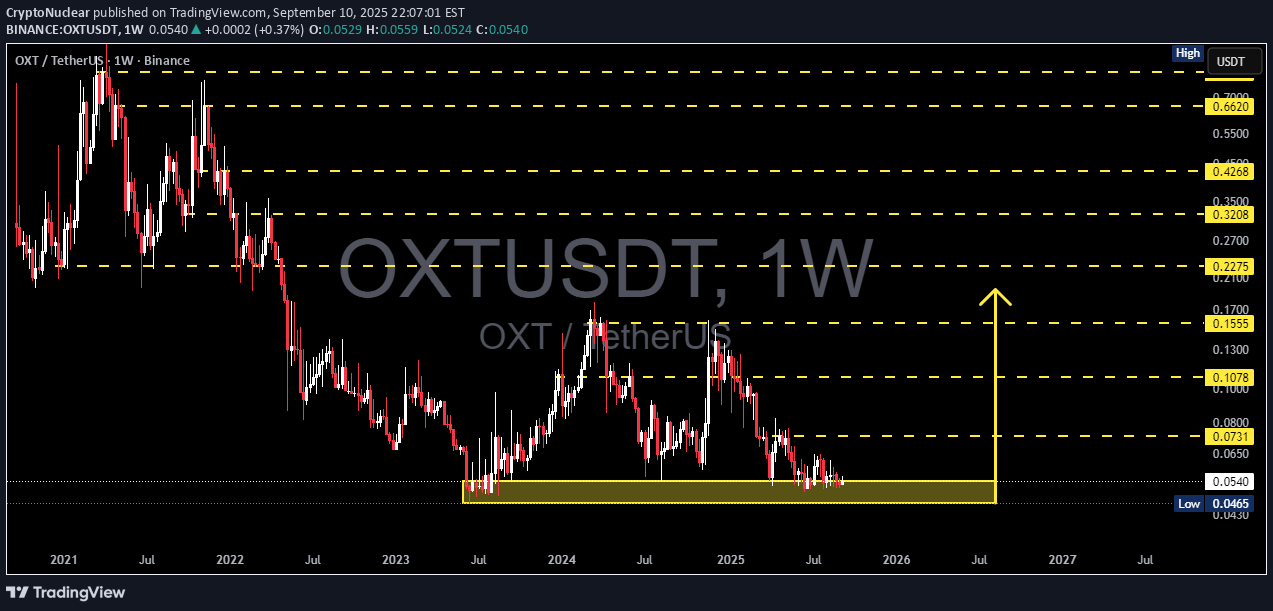
🔎 Overview The OXT/USDT pair is currently sitting at a critical juncture. Since the 2021 peak, the price has been under consistent bearish pressure, forming a series of lower highs. On the other hand, from 2023 until now, OXT has repeatedly held the historical support zone at 0.0465 – 0.0600 (highlighted yellow box). This area signals a potential accumulation phase, where long-term investors may view the price as “undervalued.” Simply put, the market is balancing between two extremes — a multi-year reversal (triple-bottom) or a breakdown into new lows. --- 🟢 Bullish Scenario — Reversal from Multi-Year Support The accumulation zone (0.0465 – 0.0600) has held for more than 2 years, forming a potential triple-bottom structure. A weekly close above 0.0731 would be the first signal of recovery momentum. Stronger bullish confirmation comes at a breakout above 0.1078, which would mark the first higher high after years of decline. Potential upside targets: 🎯 0.1555 (mid-level resistance) 🎯 0.2275 (major swing target) 🎯 0.3208 – 0.4268 (longer-term distribution zone if trend reversal extends). If validated, this area could represent a “generational buy zone” for long-term investors. --- 🔴 Bearish Scenario — Breakdown & Continuation of Downtrend Failure to defend 0.0465 with a confirmed weekly close below this level would invalidate the 2-year base. A breakdown could trigger a capitulation wave, with price seeking new, lower support levels (not visible on current chart). Psychologically, losing this long-held support could fuel panic selling, making the decline sharper than previous moves. Bearish continuation is only confirmed with a weekly close below the yellow support box, not just a wick. --- 📐 Pattern & Structure Main trend: Bearish since 2021 (lower highs remain intact). Current structure: Multi-year range/consolidation → possible accumulation. Formations: Triple-bottom / Accumulation zone (if held). Descending structure remains in play (as long as 0.1078 is not reclaimed). Interpretation: OXT is at the psychological tipping point between “capitulation” or the early stage of a new trend. --- ⚖️ Conclusion The 0.0465 – 0.0600 zone is the make-or-break area for OXT/USDT. Bullish case: Multi-year reversal potential if weekly closes above 0.0731 → 0.1078. Bearish case: Weekly close below 0.0465 = breakdown and continuation of long-term downtrend. For swing traders and investors, the current area may offer the best risk-reward zone — but weekly close confirmation remains the key. --- #OXT #Oxen #USDT #Crypto #AltcoinAnalysis #TechnicalAnalysis #SupportResistance #Accumulation #Breakout #TripleBottom #BearishVsBullish #SwingTrading
CryptoNuclear
OXT/USDT — Accumulation Before a Breakout or Further Decline?
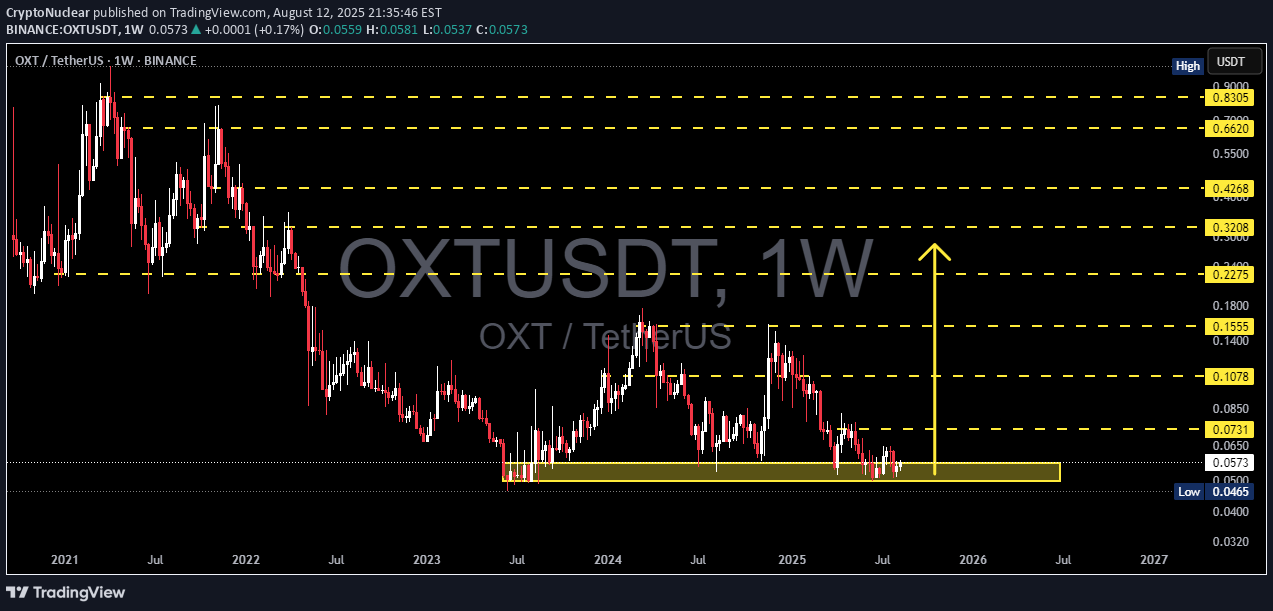
📌 Overview OXT/USDT is currently at a critical stage on the weekly chart, consolidating within the strong demand zone at 0.0465–0.0650 (yellow box) that has been tested multiple times since mid-2023. This area acts as the last line of defense for buyers before price enters uncharted multi-year lows. The macro structure remains in a long-term downtrend since the 2021 peak, but the base formation in this low zone opens up a significant opportunity for a medium-term relief rally if a breakout is confirmed. --- 1. Key Technical Levels Main Support / Demand Zone (yellow box): 0.0465 – 0.0650 → This is the “floor” that has been holding price for nearly two years. Minor Support: 0.0500 (psychological & repeated reaction level) Layered Resistance Levels: 0.0731 → 0.1078 → 0.1555 → 0.2275 → 0.3208 → 0.4268 → 0.6620 → 0.8305 --- 2. Structure & Patterns Macro Trend: A sequence of lower highs since 2021 → indicating the primary trend is still bearish. Potential Pattern: Base / Accumulation Range near multi-year lows → resembles an early rounding bottom, but not confirmed yet. Possible spring pattern: brief drop below main support followed by a sharp reclaim. Volume (not shown here): Often decreases near the bottom range, signaling sellers may be losing strength. --- 3. Bullish Scenario (Relief Rally Potential) 💡 Conservative confirmation: Break & weekly close above 0.0731. Step-by-step targets: 0.1078 → 0.1555 → 0.2275. 0.1078 is the key breakout pivot; clearing it could trigger large-scale short covering. ⚡ Aggressive setup: False breakdown below 0.0465 (spring) followed by a quick weekly close back above 0.050–0.055. Initial target: 0.0650, then 0.0731 if momentum continues. Best suited for swing traders aiming for high risk/reward. --- 4. Bearish Scenario (Trend Continuation) Clean weekly close below 0.0465 + failed retest (0.0465 turning into resistance). Downside targets: 0.0400 then 0.0320. Failure to break 0.0731 and forming another lower high would also indicate sellers remain in control. --- 5. Strategic Notes The 0.0465–0.0650 zone is the final battleground between long-term buyers and sellers controlling the macro trend. Patience is required on this 1W timeframe; valid breakouts may take several weekly candles to confirm. Aggressive traders may consider entries within the yellow box with tight stops below 0.0465, while conservative traders can wait for a confirmed breakout above key resistance. --- 6. Key Takeaway As long as price holds inside or above the yellow box, relief rally potential remains alive. Breaking 0.0731 will be the first major signal of sentiment shift. A breakdown below 0.0465 opens a new chapter in the long-term downtrend. #OXT #OXTUSDT #OrchidProtocol #CryptoAnalysis #PriceAction #WeeklyChart #SwingTrade #SupportResistance #BreakoutSetup #CryptoTrading

stanleycrypto_1
$OXT Breaks Out, 70% Rally on the Table
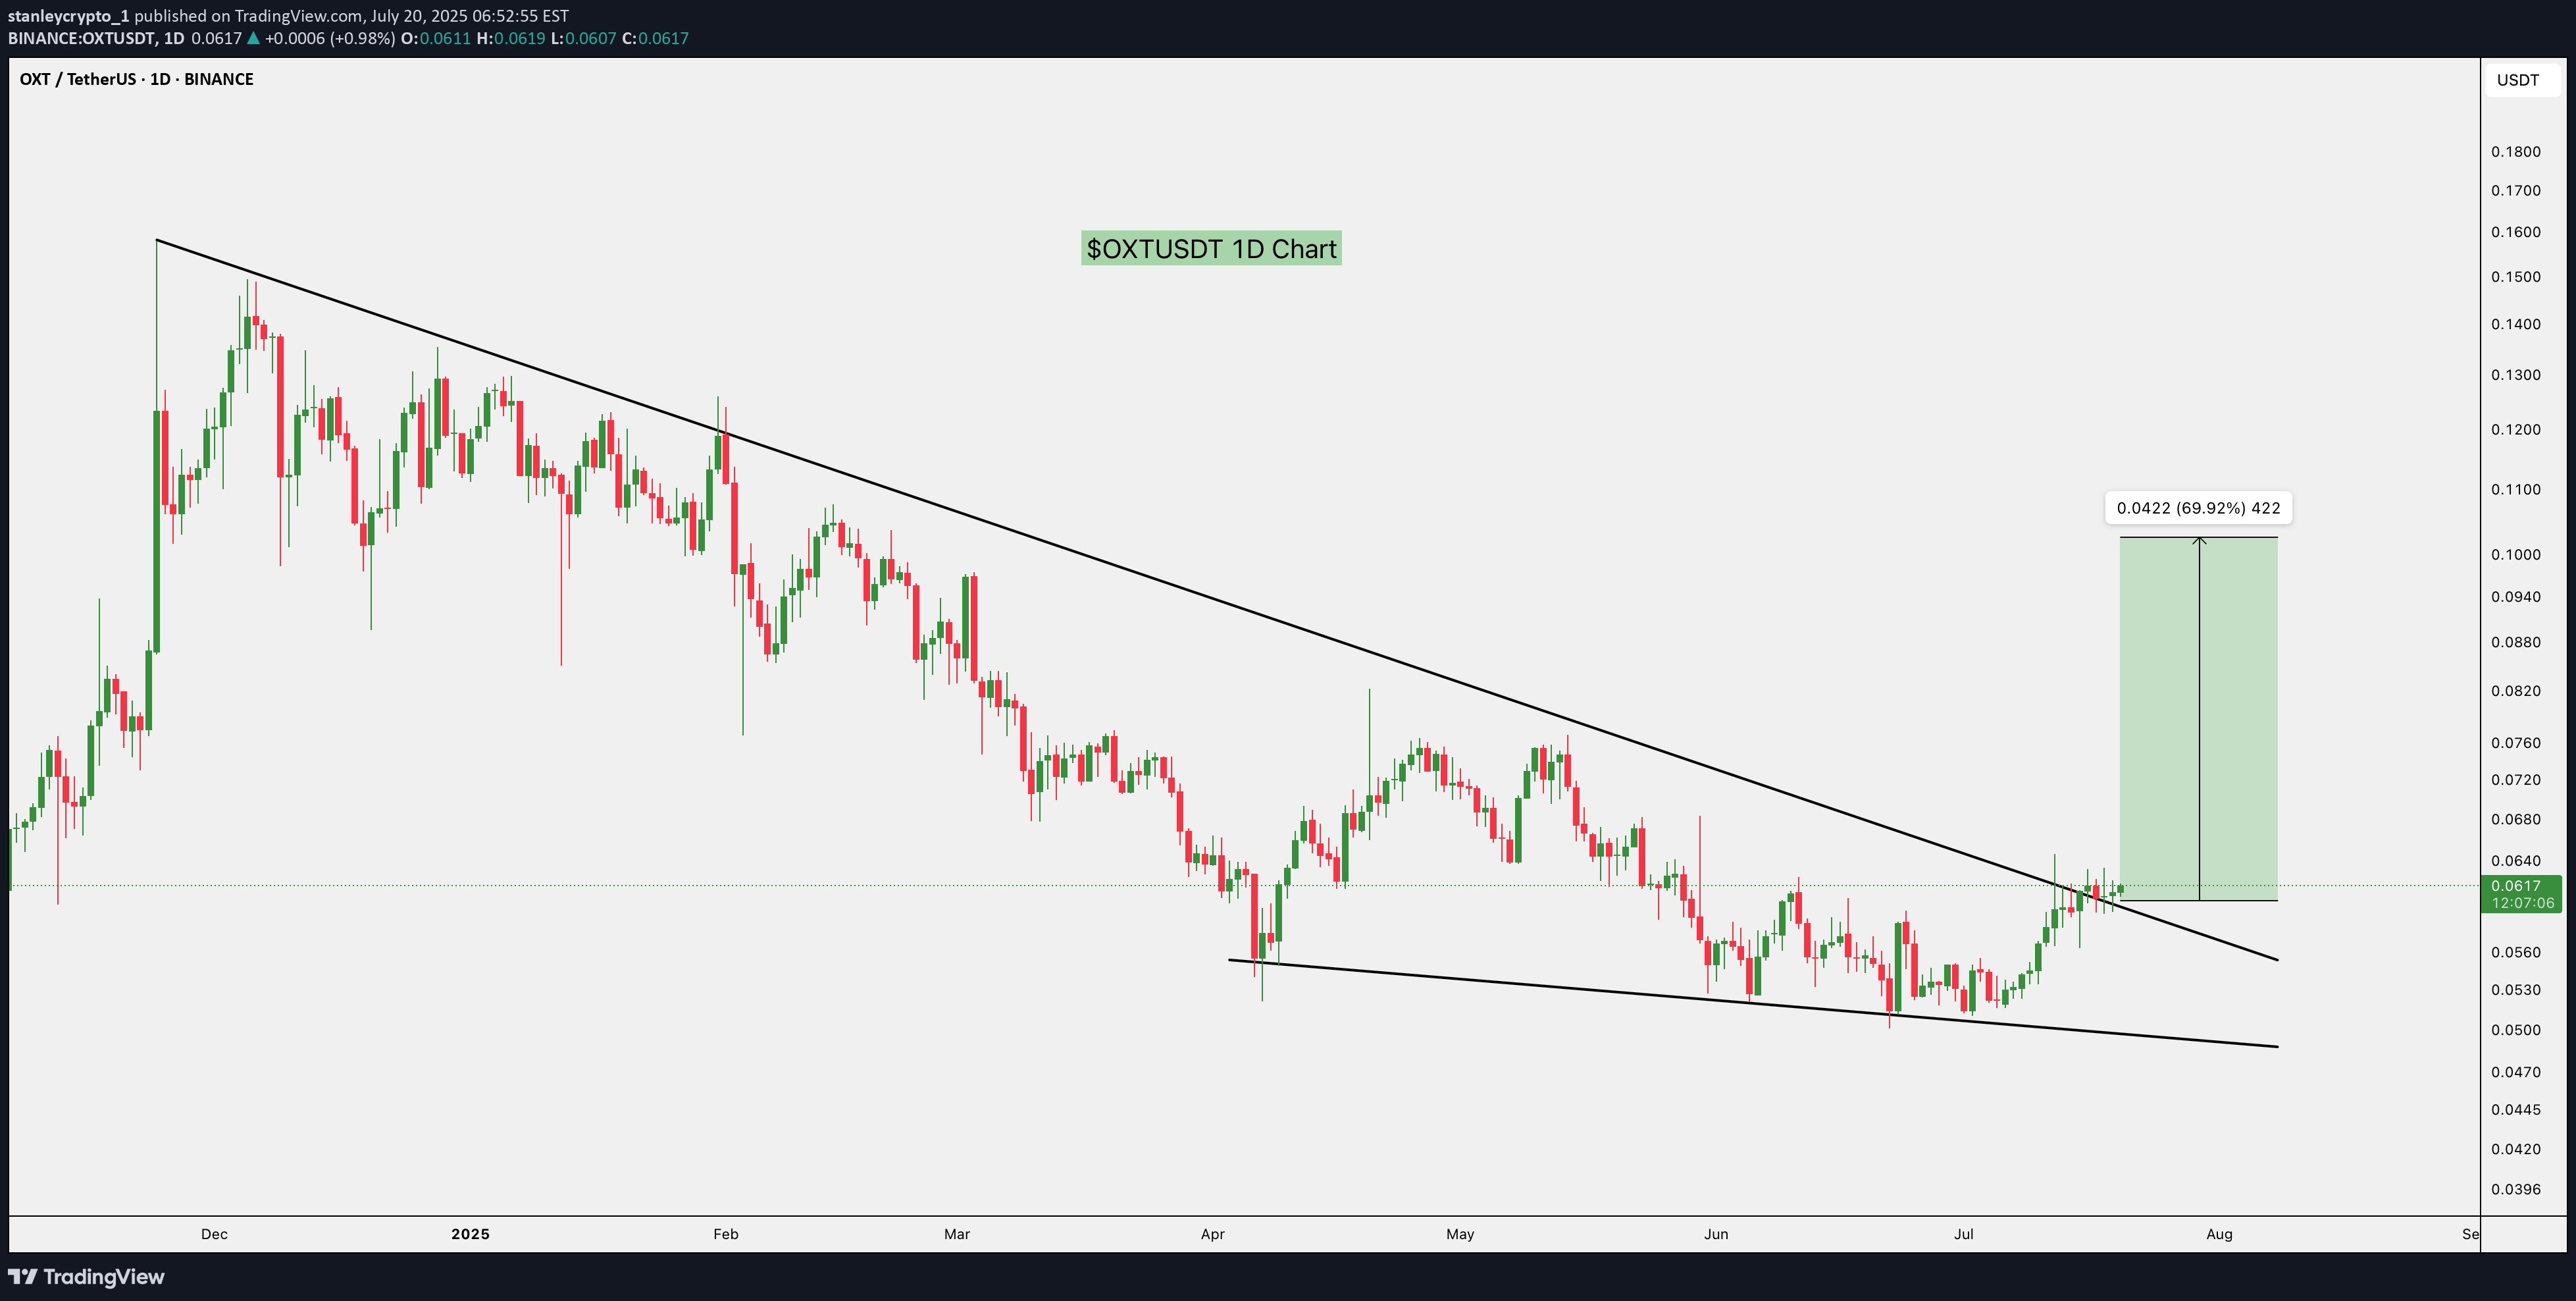
OXT has broken out of a long falling wedge, a bullish signal. If it holds, we could see a move toward $0.105 (+70%). Watch for a retest to confirm the breakout. DYOR, NFA
Se7enSkies
Se7enSkies
Speculation!
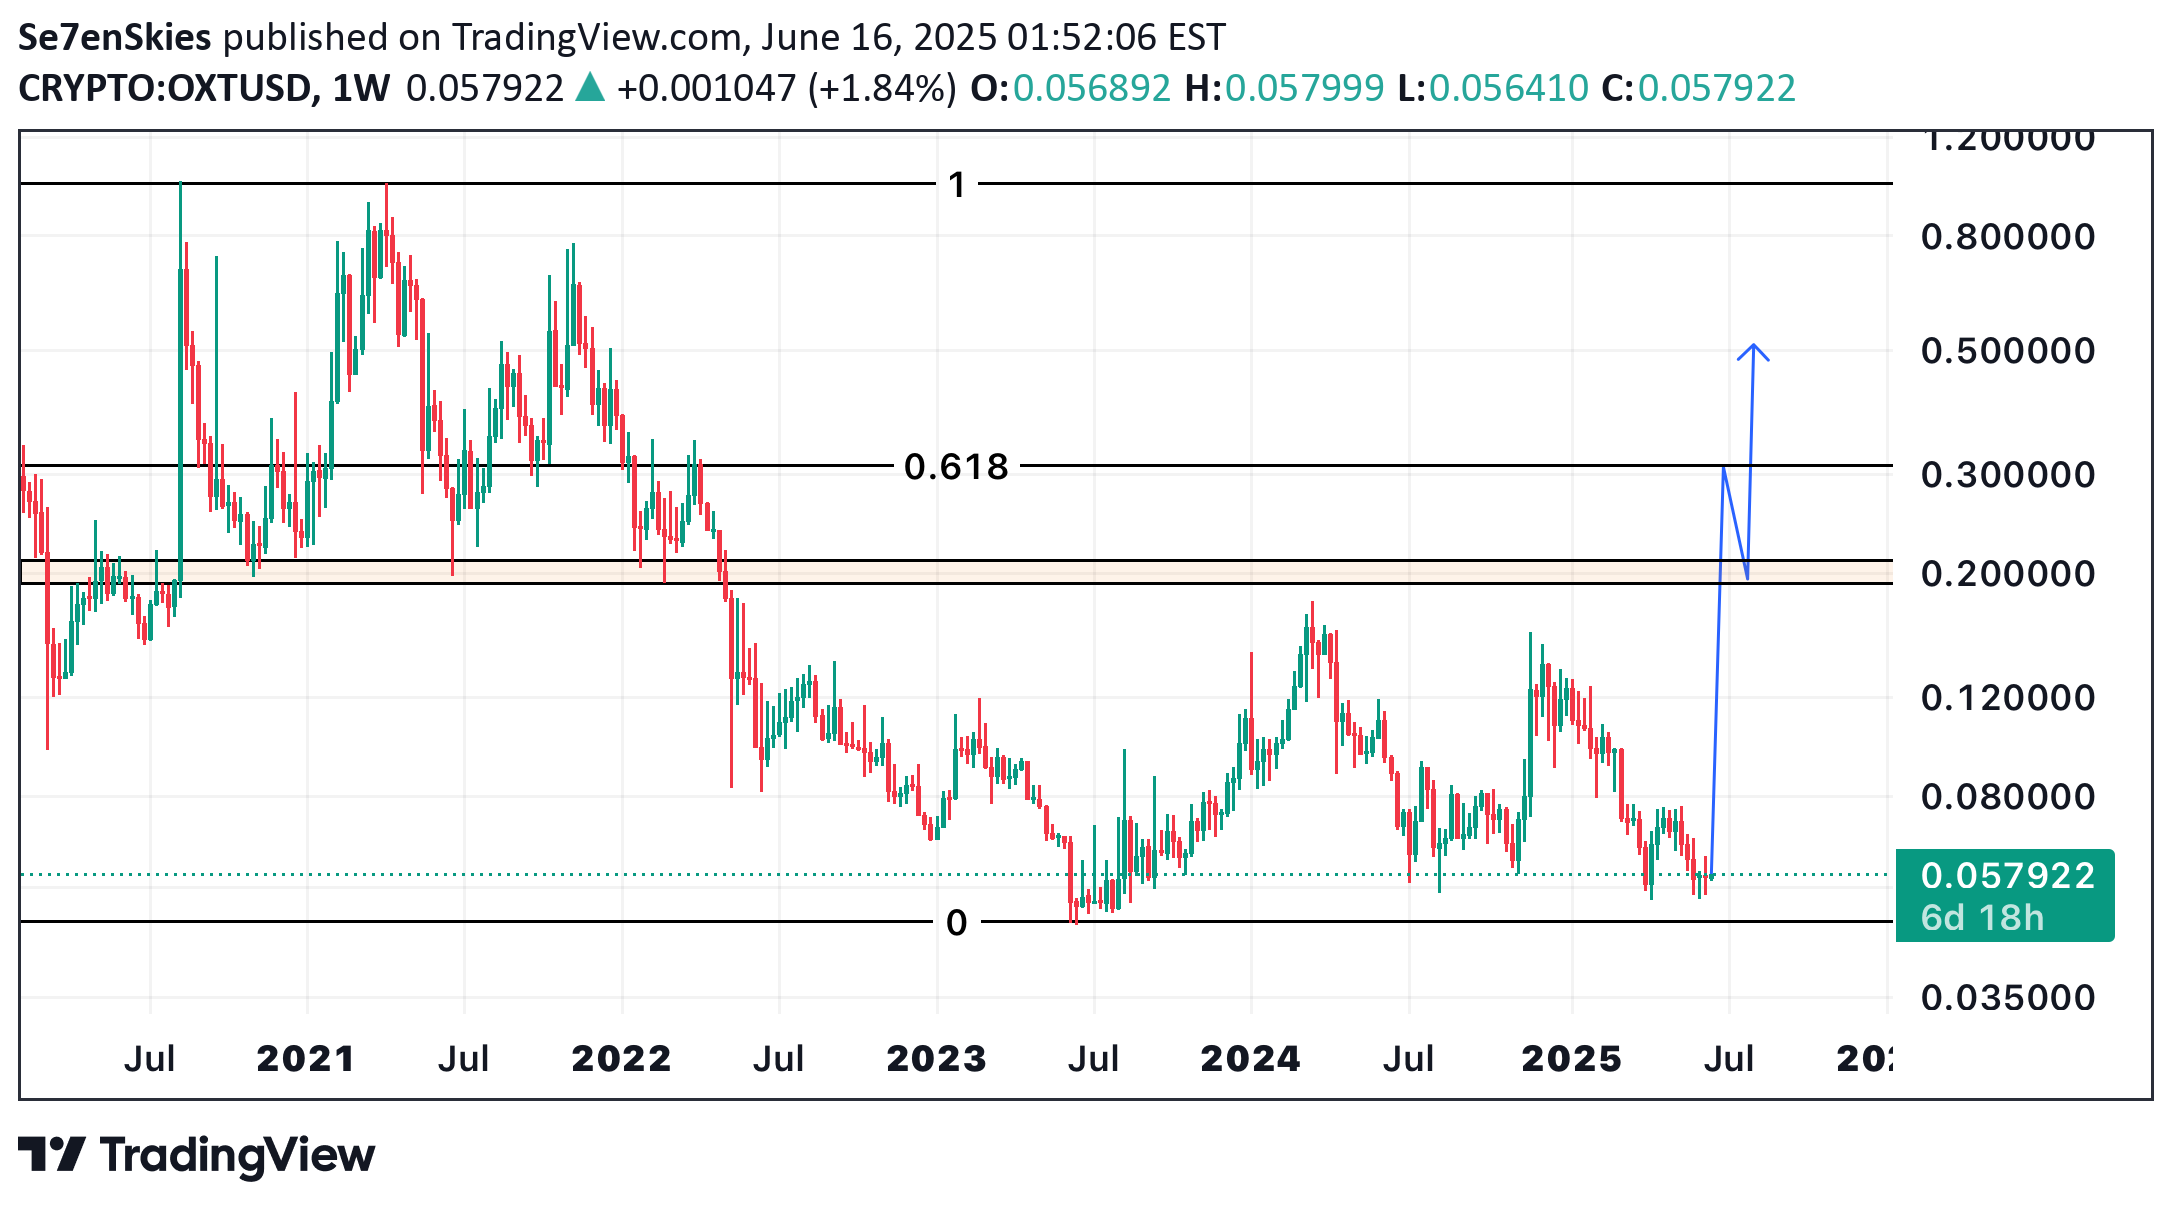
This is pure speculation based on probabilities and possibilities. Given where the market structure for OXT was broken and considering Fibonacci retracement levels, price has to touch the 0.618 fib level for initiating a bull market for this asset. That is a 400-500% price increase, which many may say is a far fetched target, but considering past price action, OXT has been able to print a 400% weekly candle when the market cap was much higher than today’s. Considering the low market cap and potential sudden massive trading volume spikes of this asset, I believe we will see 500% weekly candles again, but if you put money in this asset and lose your money, it’s on you. I have already wanrned you that I’m saying these things based on pure speculation.

MasterAnanda
Orchid 290% Profits Target, MA200 & Price Action Fractal
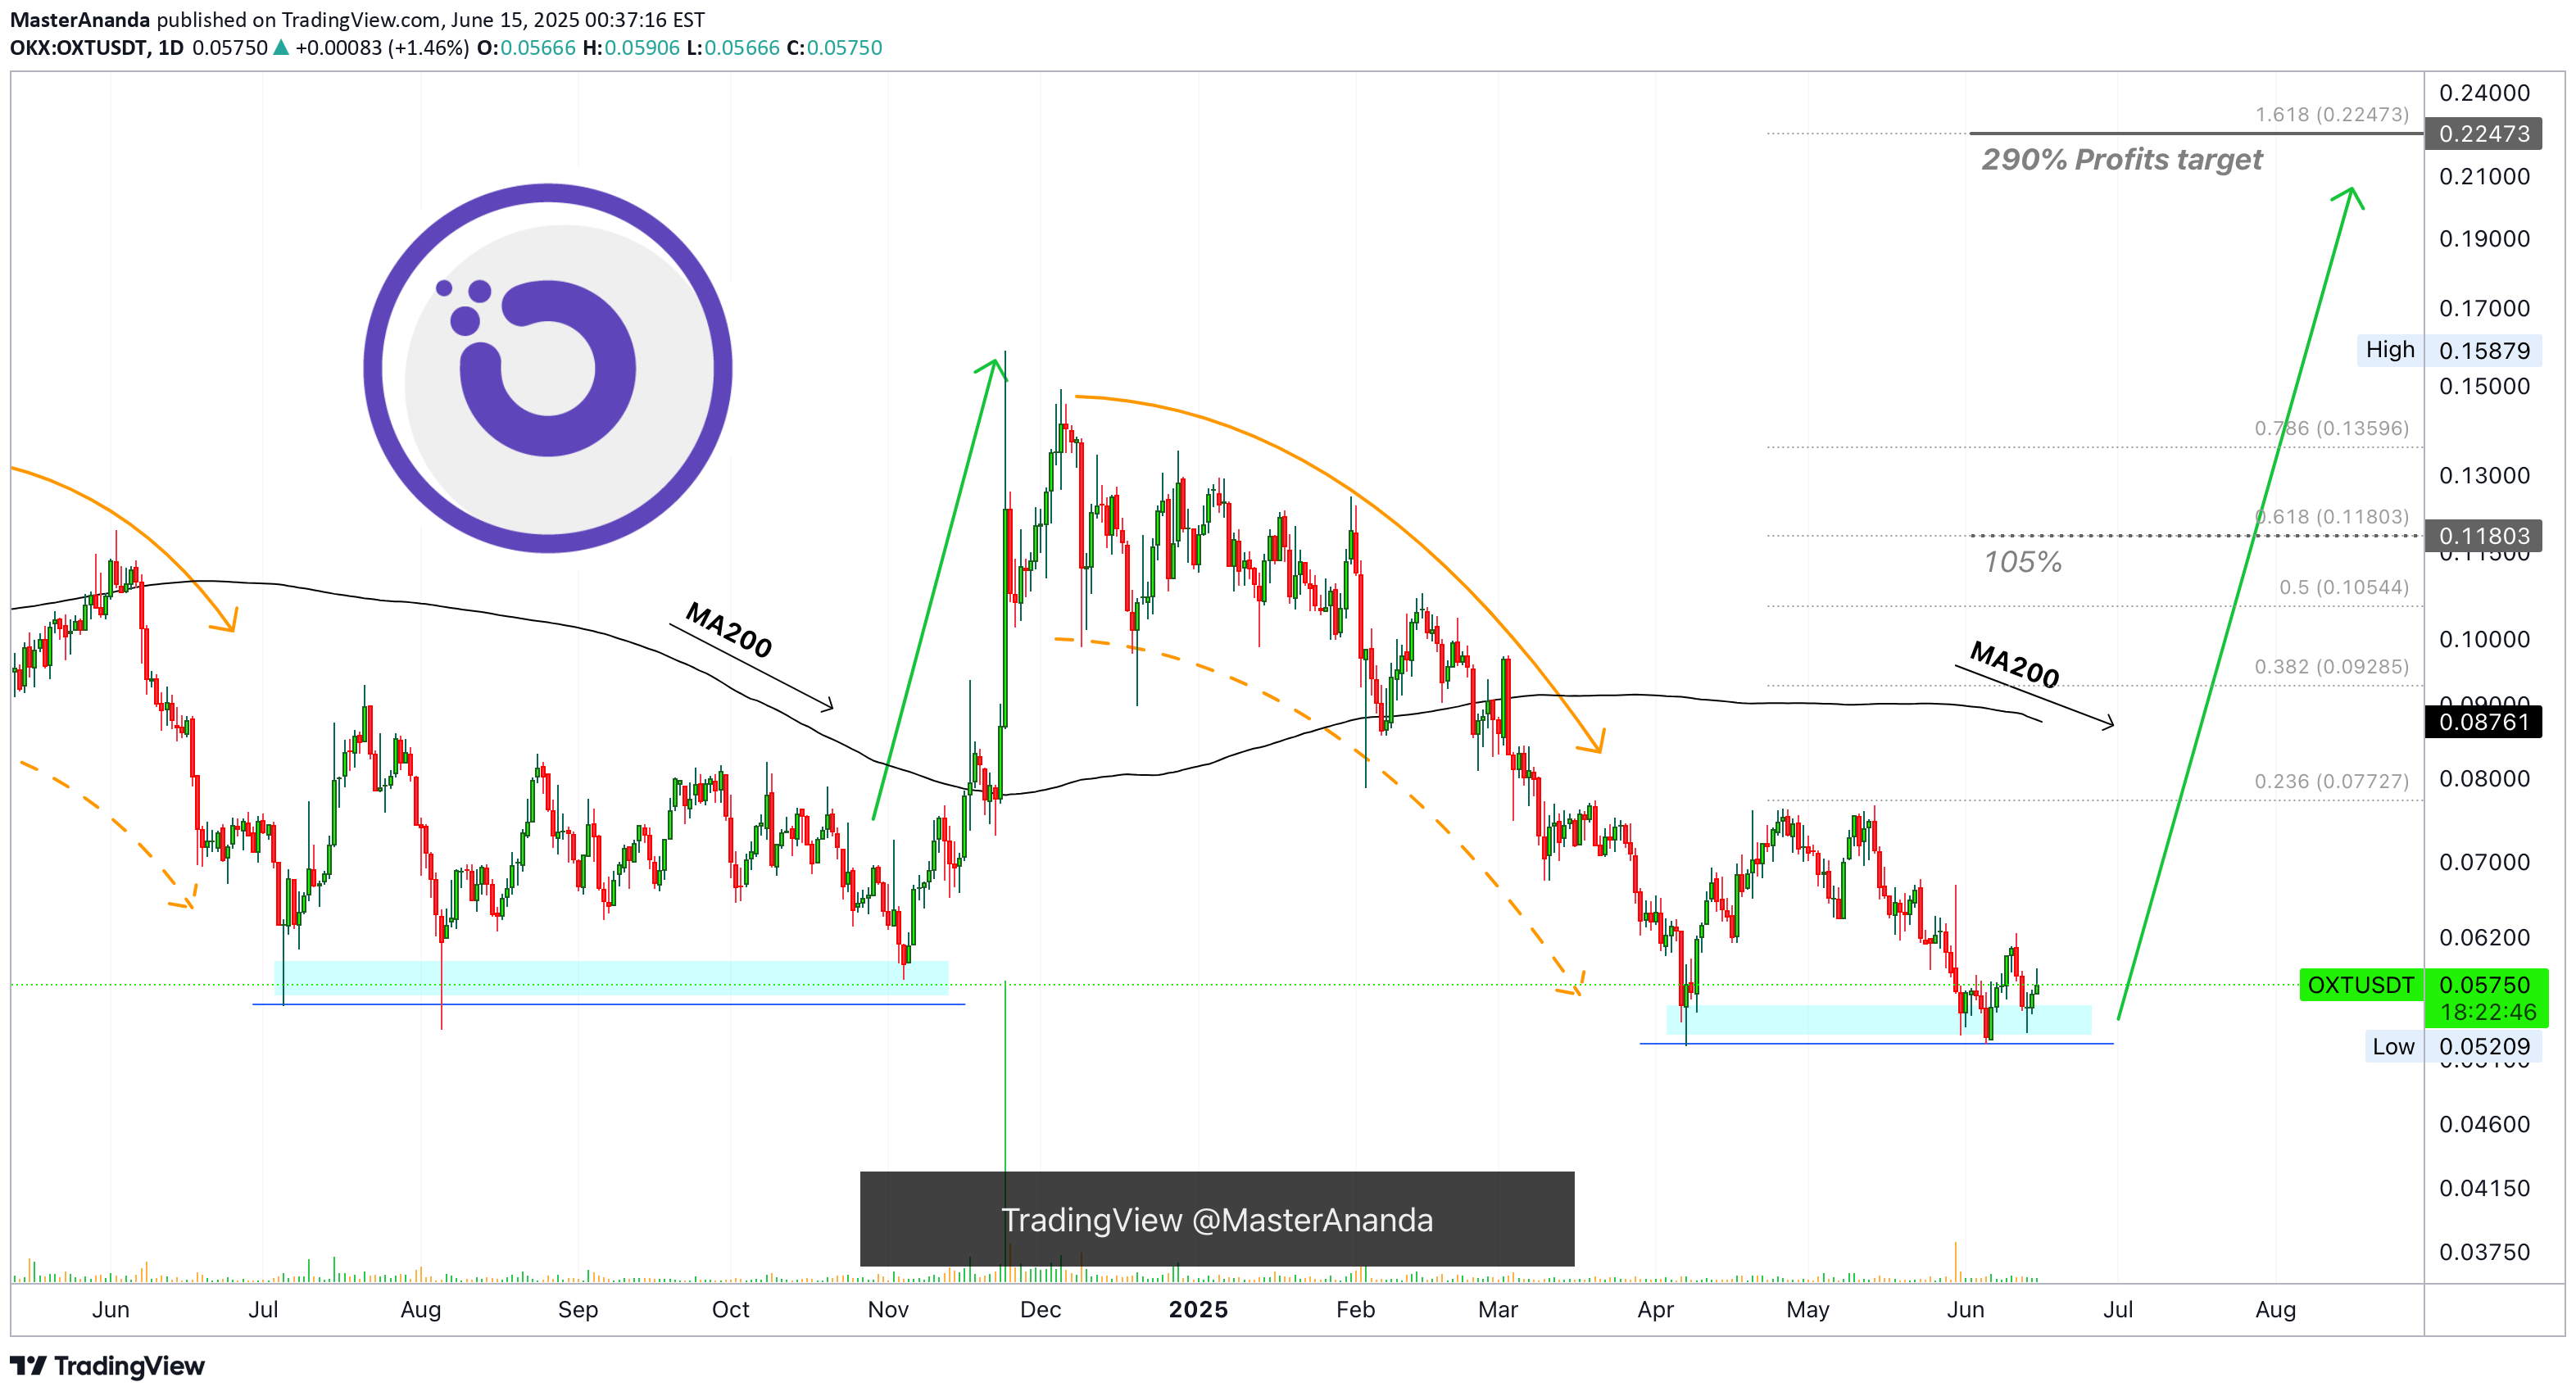
The classic signals are already present on this chart, the double-bottom, etc. But I also have a price action fractal plus an unconventional signal supporting a bullish jump.The easy target here is 290%, it can be hit within months. Not more than two to be more exact after the bullish breakout is confirmed. Long-term there can be more growth.The price action fractal is a 1,2,3 sequence. A correction leads to a low that leads to sideways and then a bullish breakout. (1) The correction, (2) then consolidation and finally (3) the bullish breakout.The unconventional signal revolves around MA200. When MA200 starts to curve down prices tend to shoot up. Right now this indicator only has a tiny curve but this is the start. If you look at the action around September 2024, MA200 started to curve down. Prices continued sideways for more then a month but eventually a bullish jump developed. It always happens when MA200 starts to curve down. As it goes down, prices go up.This is another signal that can be used to spot a trend reversal.Thanks a lot for your continued support.Namaste.
Disclaimer
Any content and materials included in Sahmeto's website and official communication channels are a compilation of personal opinions and analyses and are not binding. They do not constitute any recommendation for buying, selling, entering or exiting the stock market and cryptocurrency market. Also, all news and analyses included in the website and channels are merely republished information from official and unofficial domestic and foreign sources, and it is obvious that users of the said content are responsible for following up and ensuring the authenticity and accuracy of the materials. Therefore, while disclaiming responsibility, it is declared that the responsibility for any decision-making, action, and potential profit and loss in the capital market and cryptocurrency market lies with the trader.