Technical analysis by CryptoNuclear about Symbol OXT: Buy recommendation (8/13/2025)

CryptoNuclear
OXT/USDT — Accumulation Before a Breakout or Further Decline?
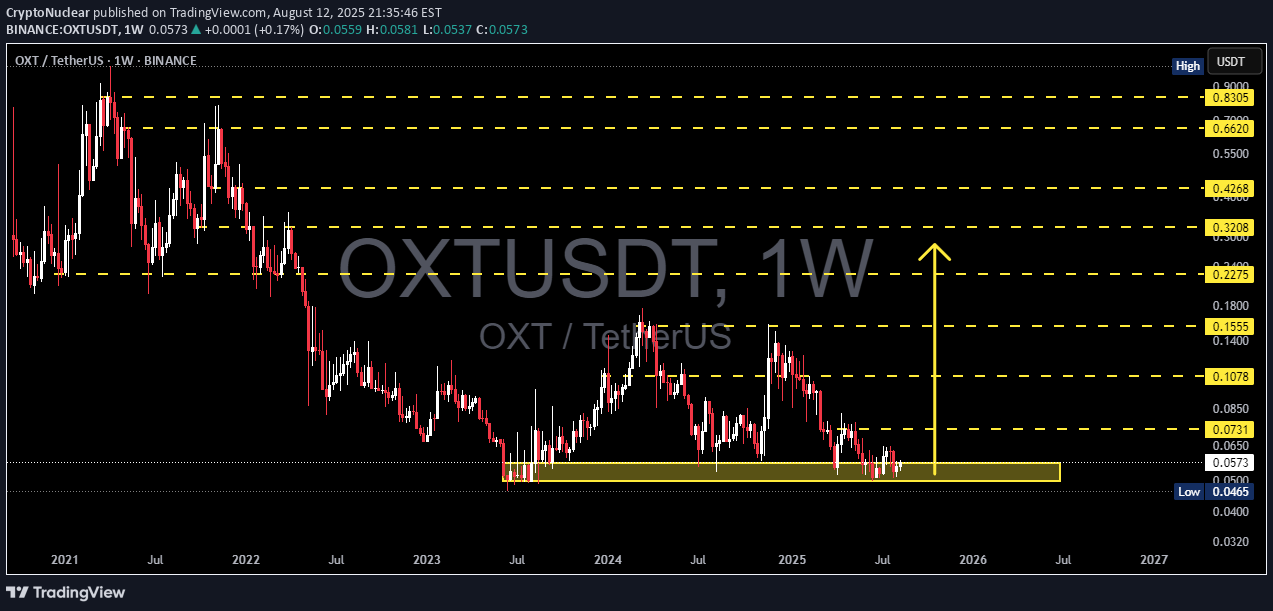
📌 Overview OXT/USDT is currently at a critical stage on the weekly chart, consolidating within the strong demand zone at 0.0465–0.0650 (yellow box) that has been tested multiple times since mid-2023. This area acts as the last line of defense for buyers before price enters uncharted multi-year lows. The macro structure remains in a long-term downtrend since the 2021 peak, but the base formation in this low zone opens up a significant opportunity for a medium-term relief rally if a breakout is confirmed. --- 1. Key Technical Levels Main Support / Demand Zone (yellow box): 0.0465 – 0.0650 → This is the “floor” that has been holding price for nearly two years. Minor Support: 0.0500 (psychological & repeated reaction level) Layered Resistance Levels: 0.0731 → 0.1078 → 0.1555 → 0.2275 → 0.3208 → 0.4268 → 0.6620 → 0.8305 --- 2. Structure & Patterns Macro Trend: A sequence of lower highs since 2021 → indicating the primary trend is still bearish. Potential Pattern: Base / Accumulation Range near multi-year lows → resembles an early rounding bottom, but not confirmed yet. Possible spring pattern: brief drop below main support followed by a sharp reclaim. Volume (not shown here): Often decreases near the bottom range, signaling sellers may be losing strength. --- 3. Bullish Scenario (Relief Rally Potential) 💡 Conservative confirmation: Break & weekly close above 0.0731. Step-by-step targets: 0.1078 → 0.1555 → 0.2275. 0.1078 is the key breakout pivot; clearing it could trigger large-scale short covering. ⚡ Aggressive setup: False breakdown below 0.0465 (spring) followed by a quick weekly close back above 0.050–0.055. Initial target: 0.0650, then 0.0731 if momentum continues. Best suited for swing traders aiming for high risk/reward. --- 4. Bearish Scenario (Trend Continuation) Clean weekly close below 0.0465 + failed retest (0.0465 turning into resistance). Downside targets: 0.0400 then 0.0320. Failure to break 0.0731 and forming another lower high would also indicate sellers remain in control. --- 5. Strategic Notes The 0.0465–0.0650 zone is the final battleground between long-term buyers and sellers controlling the macro trend. Patience is required on this 1W timeframe; valid breakouts may take several weekly candles to confirm. Aggressive traders may consider entries within the yellow box with tight stops below 0.0465, while conservative traders can wait for a confirmed breakout above key resistance. --- 6. Key Takeaway As long as price holds inside or above the yellow box, relief rally potential remains alive. Breaking 0.0731 will be the first major signal of sentiment shift. A breakdown below 0.0465 opens a new chapter in the long-term downtrend. #OXT #OXTUSDT #OrchidProtocol #CryptoAnalysis #PriceAction #WeeklyChart #SwingTrade #SupportResistance #BreakoutSetup #CryptoTrading