Technical analysis by CryptoNuclear about Symbol OXT: Buy recommendation (9/11/2025)

CryptoNuclear
OXT/USDT — Decision Zone: Reversal or Breakdown?
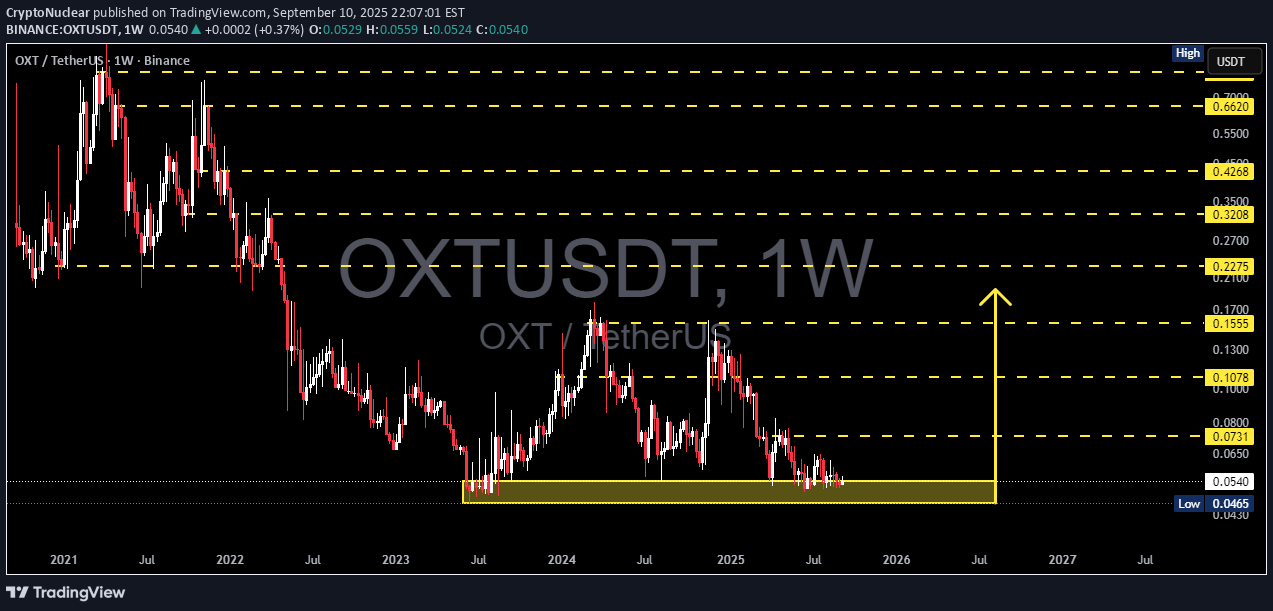
🔎 Overview The OXT/USDT pair is currently sitting at a critical juncture. Since the 2021 peak, the price has been under consistent bearish pressure, forming a series of lower highs. On the other hand, from 2023 until now, OXT has repeatedly held the historical support zone at 0.0465 – 0.0600 (highlighted yellow box). This area signals a potential accumulation phase, where long-term investors may view the price as “undervalued.” Simply put, the market is balancing between two extremes — a multi-year reversal (triple-bottom) or a breakdown into new lows. --- 🟢 Bullish Scenario — Reversal from Multi-Year Support The accumulation zone (0.0465 – 0.0600) has held for more than 2 years, forming a potential triple-bottom structure. A weekly close above 0.0731 would be the first signal of recovery momentum. Stronger bullish confirmation comes at a breakout above 0.1078, which would mark the first higher high after years of decline. Potential upside targets: 🎯 0.1555 (mid-level resistance) 🎯 0.2275 (major swing target) 🎯 0.3208 – 0.4268 (longer-term distribution zone if trend reversal extends). If validated, this area could represent a “generational buy zone” for long-term investors. --- 🔴 Bearish Scenario — Breakdown & Continuation of Downtrend Failure to defend 0.0465 with a confirmed weekly close below this level would invalidate the 2-year base. A breakdown could trigger a capitulation wave, with price seeking new, lower support levels (not visible on current chart). Psychologically, losing this long-held support could fuel panic selling, making the decline sharper than previous moves. Bearish continuation is only confirmed with a weekly close below the yellow support box, not just a wick. --- 📐 Pattern & Structure Main trend: Bearish since 2021 (lower highs remain intact). Current structure: Multi-year range/consolidation → possible accumulation. Formations: Triple-bottom / Accumulation zone (if held). Descending structure remains in play (as long as 0.1078 is not reclaimed). Interpretation: OXT is at the psychological tipping point between “capitulation” or the early stage of a new trend. --- ⚖️ Conclusion The 0.0465 – 0.0600 zone is the make-or-break area for OXT/USDT. Bullish case: Multi-year reversal potential if weekly closes above 0.0731 → 0.1078. Bearish case: Weekly close below 0.0465 = breakdown and continuation of long-term downtrend. For swing traders and investors, the current area may offer the best risk-reward zone — but weekly close confirmation remains the key. --- #OXT #Oxen #USDT #Crypto #AltcoinAnalysis #TechnicalAnalysis #SupportResistance #Accumulation #Breakout #TripleBottom #BearishVsBullish #SwingTrading