
ORDI
ORDI
| تریدر | نوع سیگنال | حد سود/ضرر | زمان انتشار | مشاهده پیام |
|---|---|---|---|---|
No results found. | ||||
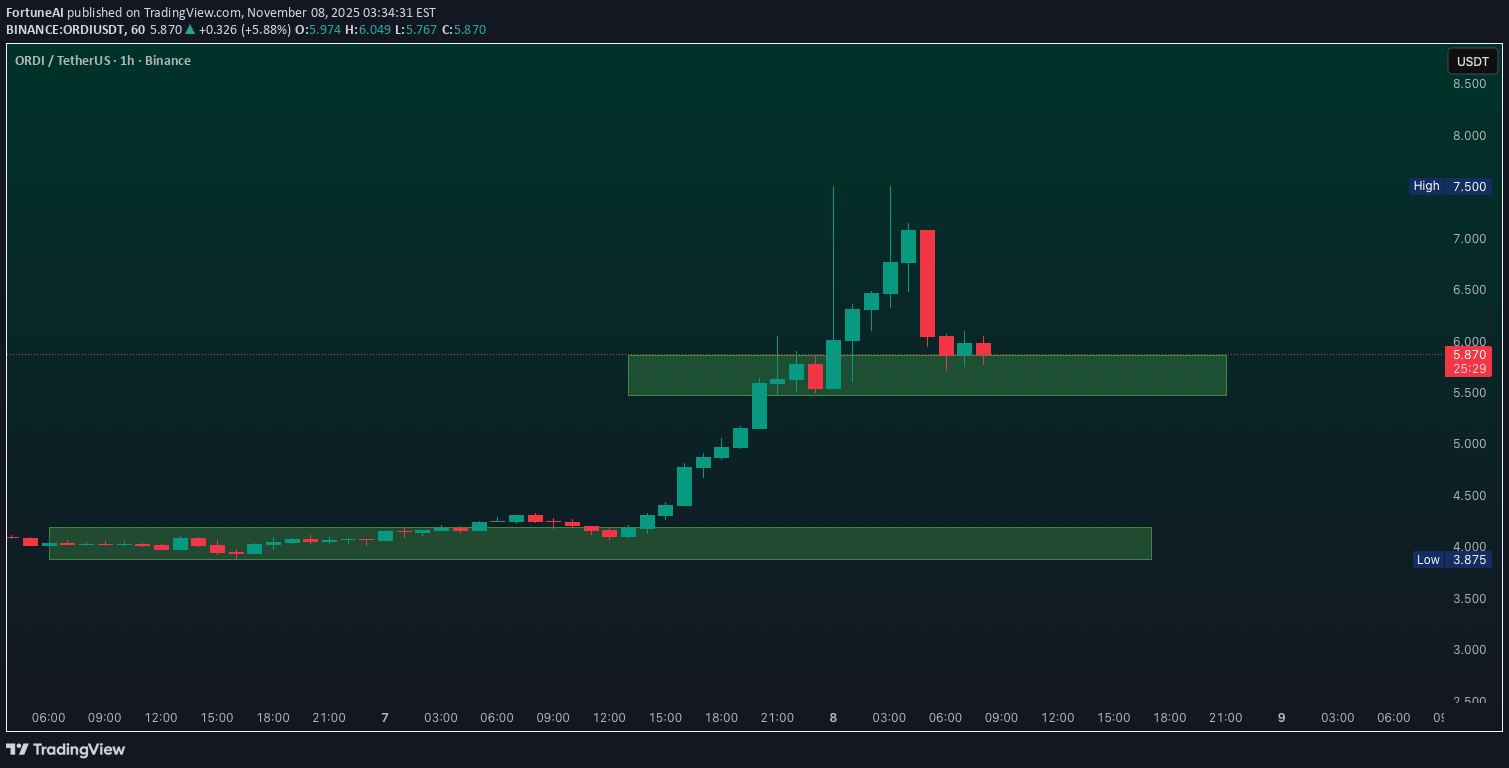
Price Chart of ORDI
سود 3 Months :
سیگنالهای ORDI
Filter
Sort messages by
Trader Type
Time Frame

ORDI – Daily Zoomed-In Update

Price is still trading below a key reclaimed level that previously acted as strong support. This level is now acting as resistance and needs to be reclaimed for bullish continuation. Recent price action shows a potential deviation below support, followed by acceptance back into the range. If this deviation holds, it can act as a spring for a larger move. Key idea: No FOMO here. Bullish continuation only makes sense after a clean reclaim and hold above resistance. Key levels to watch: Support: range lows / deviation area Resistance: prior support level that must be reclaimed Acceptance above resistance opens the path toward higher range targets. Failure to reclaim keeps ORDI range-bound and vulnerable to another sweep lower. Not financial advice. Always manage risk. 👍 Like if you’re still tracking ORDI 💬 Do you expect a clean reclaim or another deviation first? MrC

Crypto-by-PRIME
ORDI / USDT : Short term setup
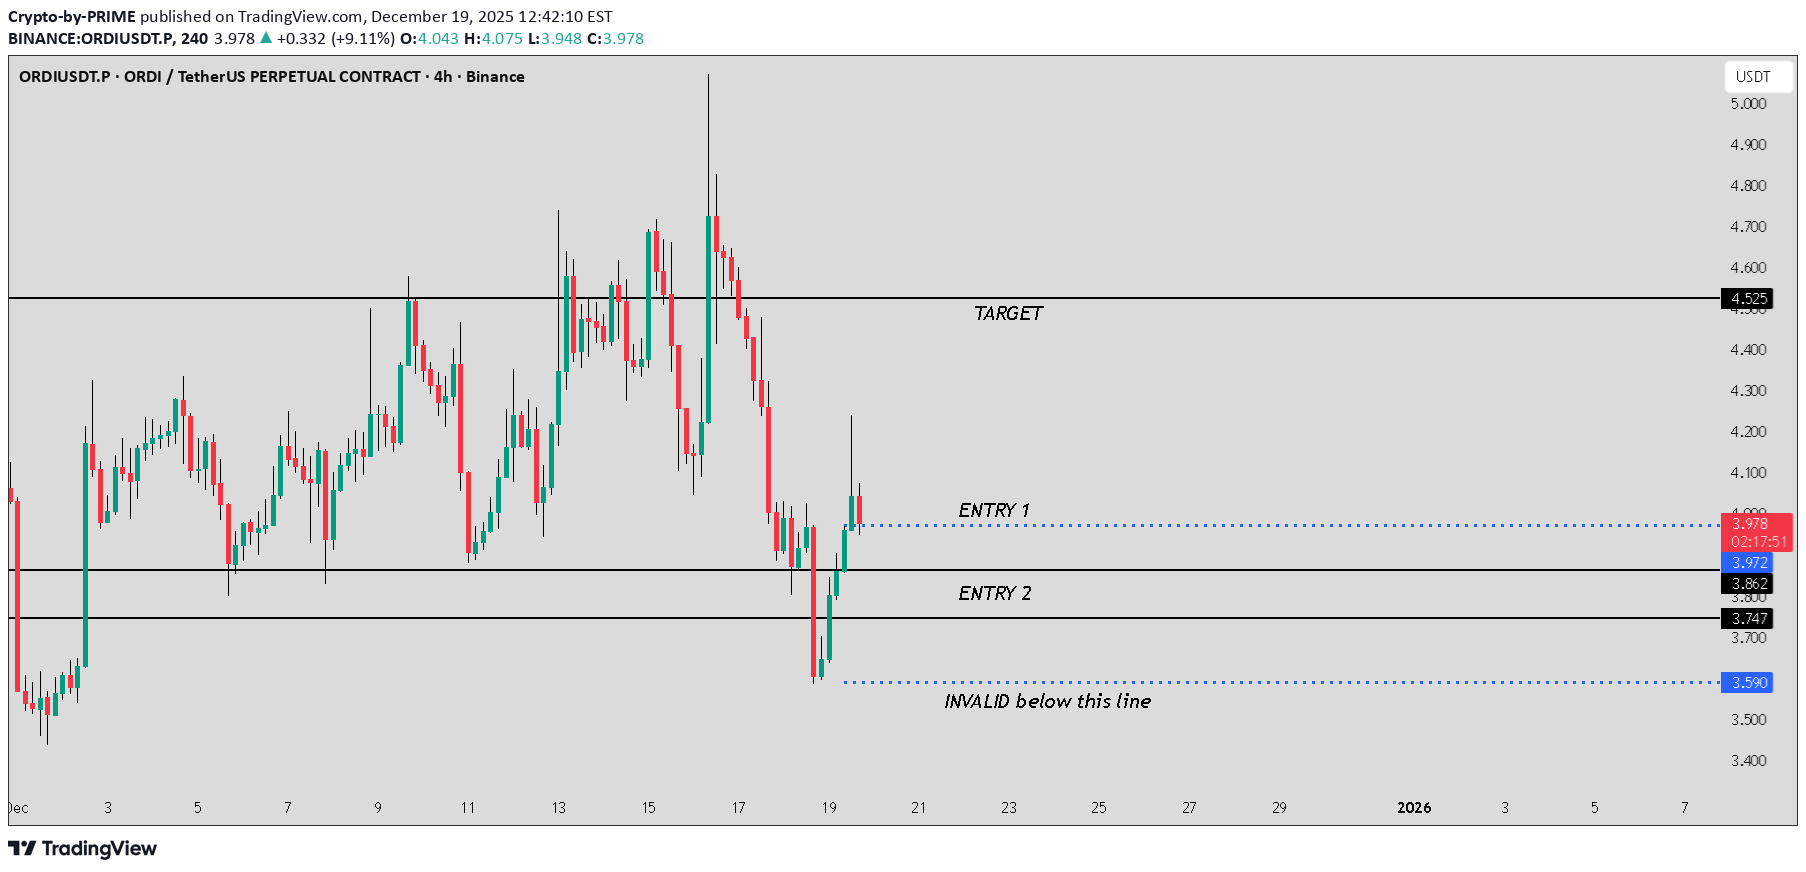
ORDI is trading near a key demand zone with potential for a 10–15% upside. Using a two-entry plan to manage risk, with a possible secondary entry around $3.86–$3.75 if price dips. Target remains near $4.52 as long as structure holds. Patience and confirmation are key. Not financial advice.ORDI / USDT tapped our second entry zone and is now moving smoothly toward the target. The trade is running in solid profit, confirming the strength of the setup and price structure. Momentum remains supportive, so continue to manage risk and trail profits accordingly.

asilturk
ORDI Tehlikeli Sularda Yuzuyor
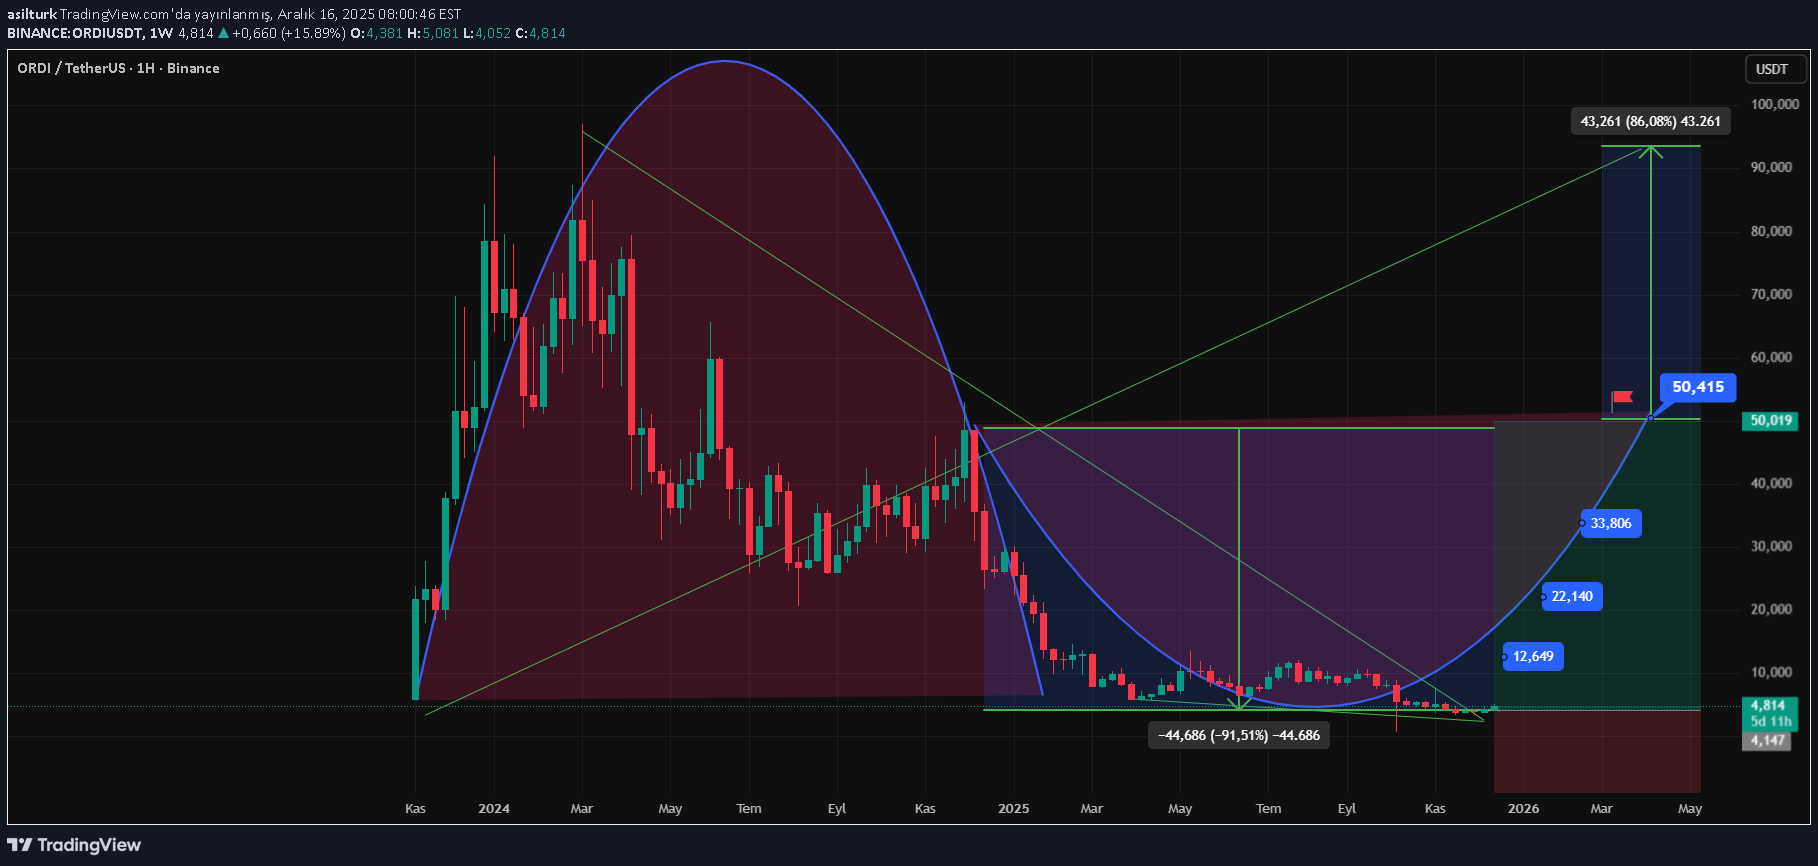
ORDI Coin is the first token created using BRC-20, an experimental token standard that operates on the Bitcoin blok chain. It takes its name from the Ordinals Protocol, the technology on which this token standard is based. As of now, its price is $4.81, market value is $100 Million, technically the outlook is positive, there may be sharp increases in the short term. However, the concentration value is over 7, which means that 7% can be controlled. I wish you good luck.

Crypto_alphabit
تحلیل ORDI: استراتژی جمعآوری در محدوده ورود و توصیههای طلایی برای سودآوری بلندمدت
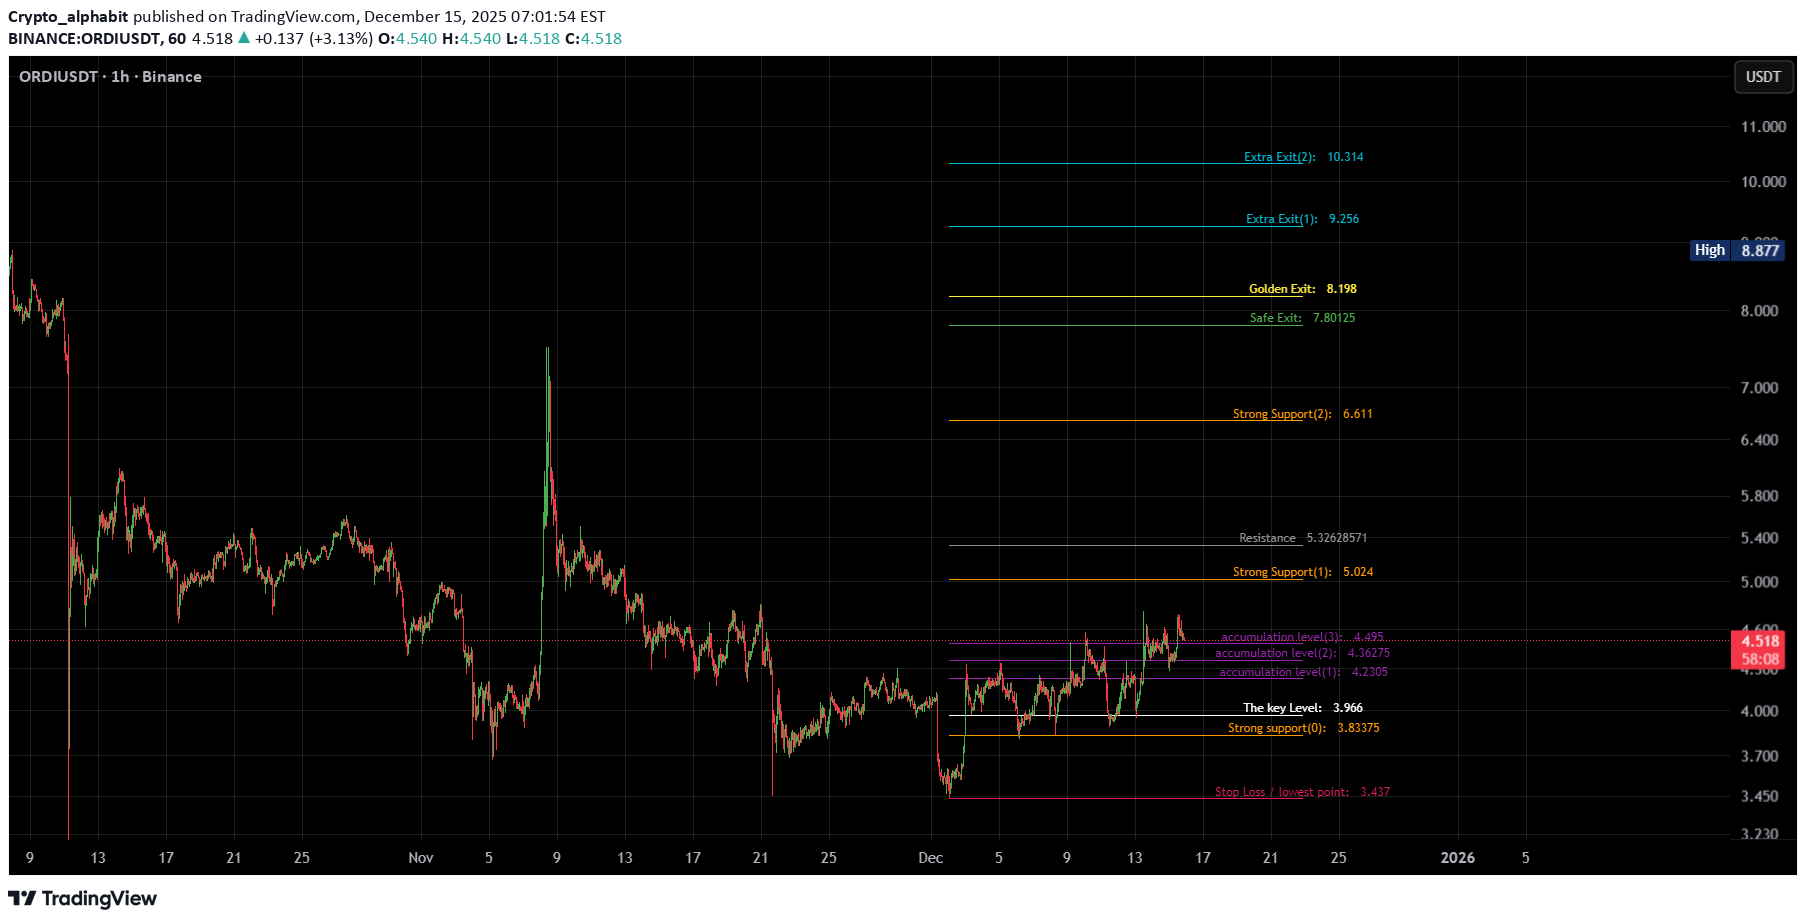
ORDIUSDT #ORDO/ USDT watch the indicator and see the price action to the indicator levels _______________________________________________________ Golden Advices. ******************** * collect the coin slowly in the entry range. * Please calculate your losses before the entry. * Do not enter any trade you find it not suitable for you. * No FOMO - No Rush , it is a long journey.
ORDI Weekly Analysis
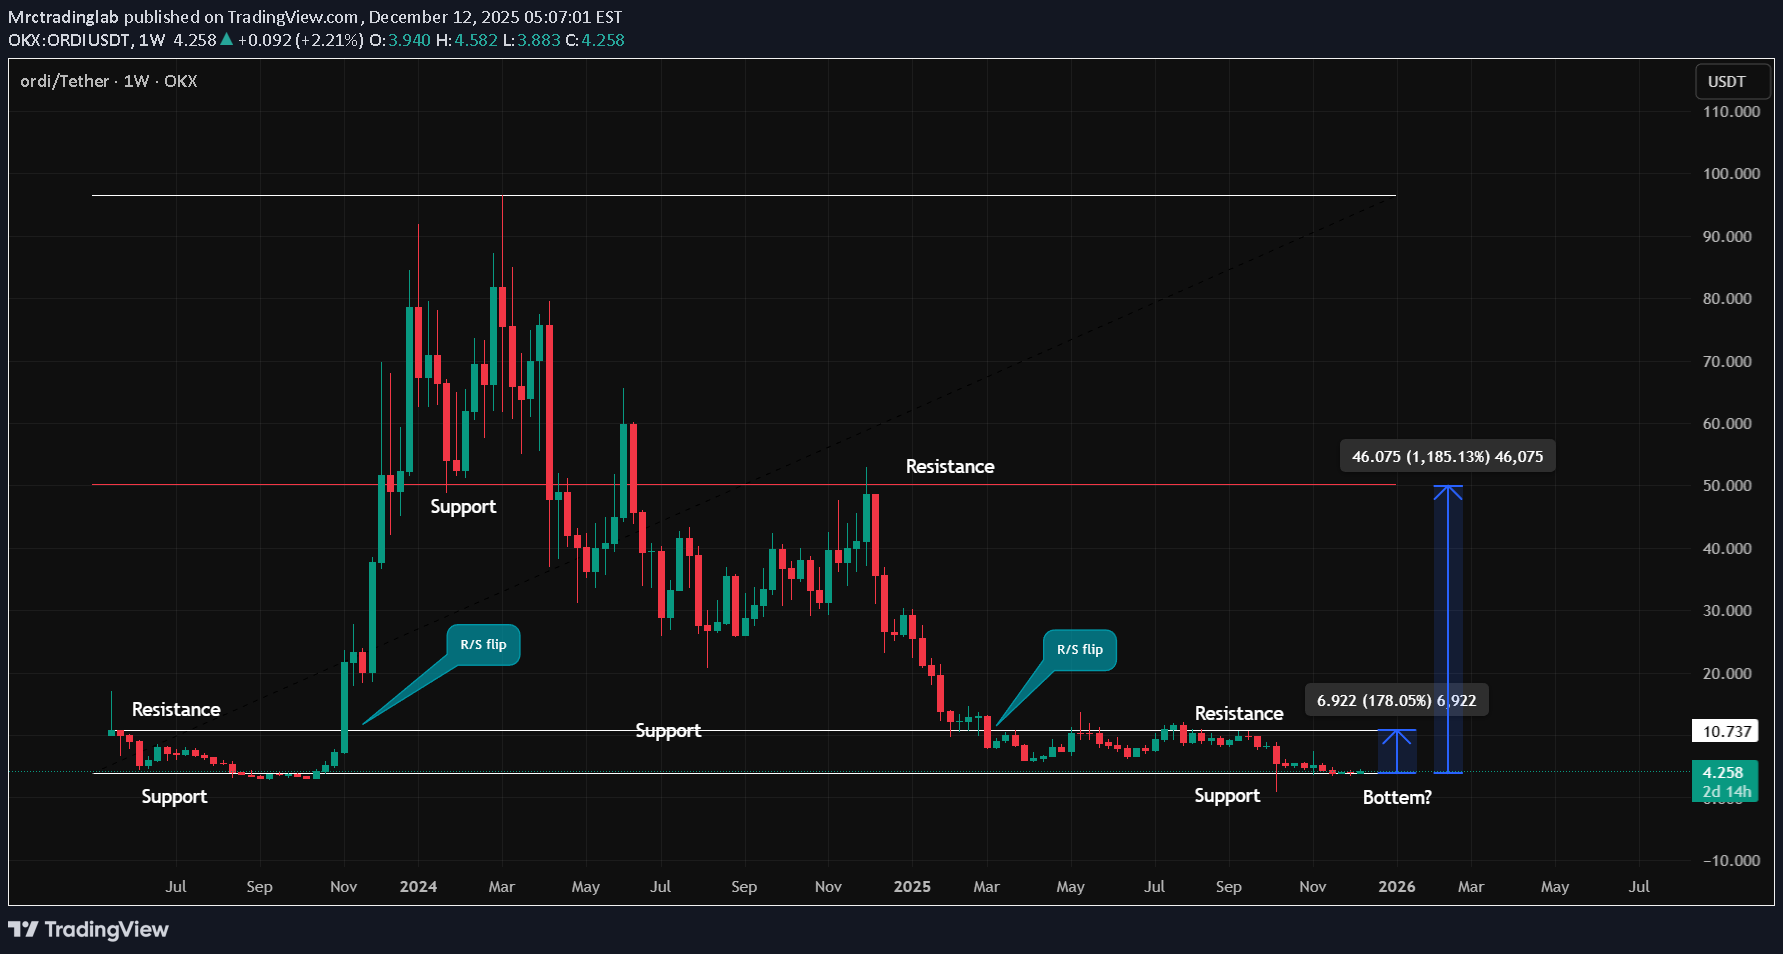
ORDI is currently trading at a major higher timeframe support zone after a prolonged downtrend. This level has acted as support multiple times in the past, making it an important area to monitor for potential price reactions. Market structure remains bearish on the higher timeframe, but downside momentum is slowing down and price is starting to consolidate. Key levels to watch: Support at the current range low Resistance at the previous breakdown level Higher timeframe resistance above, as marked on the chart If price holds support and manages to reclaim resistance, continuation toward the next resistance levels becomes possible. If price fails to hold support, consolidation or further downside cannot be ruled out. This analysis is based on market structure and support and resistance levels. No predictions, only scenarios. All levels and scenarios are clearly marked on the chart. Questions or comments are welcome in the comments below. MrC

Alpha-GoldFX
الگوی گوه نزولی ORDI/USDT: آیا انفجار صعودی 150 درصدی در راه است؟

ORDIUSDT is forming a clear falling wedge pattern, a classic bullish reversal signal that often indicates an upcoming breakout in crypto trading pairs like this one. The price has been consolidating within a narrowing range after a sharp downtrend, with recent lows around $7 suggesting that selling pressure is weakening while buyers are beginning to regain control near key support levels. With good volume confirming accumulation at these lower levels amid rising investor interest, the setup hints at a potential bullish breakout soon, especially as ORDI's ties to Bitcoin Ordinals and BRC-20 hype fuel renewed momentum. The projected move could lead to an impressive gain of 140% to 150%+ once the price breaks above the wedge resistance, turning recent corrections into explosive altcoin price action. This falling wedge pattern is typically seen at the end of downtrends or corrective phases, and it represents a potential shift in market sentiment from bearish to bullish for ORDIUSDT. Traders closely watching this crypto pair are noting the strengthening momentum as it nears a breakout zone around $8.77, with technical indicators like RSI showing oversold bounces and fib retracement levels holding firm. The good trading volume adds confidence to this pattern, showing that market participants are positioning early in anticipation of a reversal, particularly with recent signals hitting take-profit targets and bouncing from ascending supports. Investors’ growing interest in ORDIUSDT reflects rising confidence in the project’s long-term fundamentals, including its role in blockchain scalability and Ordinals adoption, alongside current technical strength in this falling wedge setup. As of early November 2025, trading activity spikes underscore real demand, making this a high-conviction opportunity for those hunting bullish reversal patterns in altcoins. If the breakout confirms with sustained volume, this could mark the start of a fresh bullish leg, with projections eyeing $16 to $21 zones for substantial medium-term gains as buying momentum accelerates. ✅ Show your support by hitting the like button and ✅ Leaving a comment below! (What is You opinion about this Coin) Your feedback and engagement keep me inspired to share more insightful market analysis with you!

Bithereum_io
تحلیل ORDI: زمان خرید رسید؟ صعود انفجاری تا ۱۷ دلار در انتظار است!

Pay attention to the #ORDI daily chart — it’s moving within a falling wedge pattern and has bounced nicely from the wedge support. Volume has spiked noticeably. Consider buying around the current level and near the support zones at: 💰 $4.735 💰 $4.138 In case of a breakout above the wedge resistance and the daily SMA100, the potential upside targets are: 🎯 $8.066 🎯 $10.591 🎯 $12.632 🎯 $14.673 🎯 $17.579 ⚠️ Always remember to use a tight stop-loss and maintain proper risk management.

FortuneAI

CryptoNuclear
ORDI در آستانه انفجار بزرگ: پایان روند نزولی فرا رسیده است؟

ORDI/USDT is now at one of its most crucial moments of 2025. After a sharp rebound from the $3–$4 zone, the price is approaching the main descending trendline that has rejected every major rally for months. This is a make-or-break zone — where the market will decide whether a major reversal begins or if this is just another bearish trap before continuation down. --- 🧩 Technical Structure Main trend: Strong downtrend since early 2025, forming a clear series of lower highs and lower lows. Primary resistance: The yellow descending trendline connecting all major peaks. Key support zone: $3.1 – $4.8 (strong demand area). Key resistances: $6.0 (current level), $10.5, $13, $20, and major resistance at $49–$53. Volume note: The latest rebound shows a strong volume spike, signaling renewed buyer interest. --- ⚡ Bullish Scenario – “The Reversal Awakening” If ORDI can close a daily candle above the descending trendline, it would mark the first true breakout of this long-term downtrend — a potential start of a major trend reversal. Bullish triggers: Daily close above $7–$7.5 with solid volume. Retest of the breakout zone holding as new support. Strong continuation candles confirming breakout momentum. 🎯 Bullish Targets: 1. $10.50 — first resistance and conservative target. 2. $13.00 — medium-term target. 3. $20.00+ — next major target if the breakout sustains. 📈 A confirmed breakout here would officially break the mid-term downtrend structure. --- 💀 Bearish Scenario – “False Break & The Trap Zone” If ORDI fails to break above the trendline and forms a rejection candle (long upper wick), it could trigger another bull trap. This would signal that bears are still in control, pushing price back toward lower supports. Bearish confirmation signs: Rejection candle at the trendline with high volume. No follow-through in the next session. 🎯 Bearish Targets: $4.8 → $3.8 (short-term correction zone). If $3.1 support breaks, expect further downside continuation. ⚠️ Bearish invalidation: A confirmed daily close above the trendline (breakout). --- 🧠 Pattern & Sentiment Current structure forms a descending resistance breakout setup — a potential reversal pattern after months of decline. The sharp rebound with volume may indicate early accumulation. Market sentiment is shifting, but confirmation is key before declaring a trend change. --- 🧭 Strategy & Risk Management Conservative Approach: Wait for a daily close above the trendline. Enter on the successful retest (trendline becomes support). Place stop below the previous swing low (~$4.0). First target $10.5, then $13. Aggressive Approach: Early entry near $6.0–$6.2 (anticipating breakout). Tight stop below $5.0. Add on confirmation after breakout. 💡 Remember: Volume confirmation is the key to validating any breakout. --- 🔮 Epic Summary ORDI stands at the edge of transformation. After a year-long downtrend, it’s now testing the same trendline that has rejected every rally before. A clean breakout could mark the beginning of a powerful bullish phase, while a sharp rejection would confirm that bears are not done yet. This isn’t just another resistance — it’s the decision zone for ORDI’s next major move. --- #ORDI #ORDIUSDT #CryptoAnalysis #TechnicalAnalysis #Altcoin #CryptoTrading #BreakoutSetup #TrendlineBreakout #SupportResistance #BullishScenario #BearishScenario #ChartAnalysis #CryptoCharts

SevenStarBuySell
سیگنال کوتاه ORDI: استراتژی معاملاتی دقیق و اهداف قیمتی!

we have a short print in ordi according to the strategy. Targets on Charts D Y O RHahah. Went like water. congrats who caught my call.
Disclaimer
Any content and materials included in Sahmeto's website and official communication channels are a compilation of personal opinions and analyses and are not binding. They do not constitute any recommendation for buying, selling, entering or exiting the stock market and cryptocurrency market. Also, all news and analyses included in the website and channels are merely republished information from official and unofficial domestic and foreign sources, and it is obvious that users of the said content are responsible for following up and ensuring the authenticity and accuracy of the materials. Therefore, while disclaiming responsibility, it is declared that the responsibility for any decision-making, action, and potential profit and loss in the capital market and cryptocurrency market lies with the trader.