
OP
Optimism
| تریدر | نوع سیگنال | حد سود/ضرر | زمان انتشار | مشاهده پیام |
|---|---|---|---|---|
 KlejdiCuniRank: 1683 | خرید | حد سود: تعیین نشده حد ضرر: تعیین نشده | 1/6/2026 | |
خرید | حد سود: تعیین نشده حد ضرر: تعیین نشده | 1/4/2026 |
Price Chart of Optimism
سود 3 Months :
خلاصه سیگنالهای Optimism
سیگنالهای Optimism
Filter
Sort messages by
Trader Type
Time Frame

Nabi_Gunduz
OPUSDT - 07.01.2025

A very nice Wedge breakout... Daily candle closing above 0.3484 has the potential to give 40% profit...
KlejdiCuni
OP/USDT: Falling Wedge Breakout Signals Growing Optimism

OP/USDT: Falling Wedge Breakout Signals Growing Optimism OP is showing early signs of recovery after forming a clear falling wedge, a pattern that often precedes bullish reversals. Price has started to react from the lower boundary of the structure, suggesting selling pressure is weakening and buyers are slowly stepping in. If this breakout holds, the first upside objective sits at 0.4450, followed by a stronger resistance zone around 0.6300. A full bullish continuation could eventually open the path toward the higher target near 0.8300, where significant supply previously entered the market. You may find more details in the chart! Thank you and Good Luck! PS: Please support with a like or comment if you find this analysis useful for your trading day
آماده پرواز: هدف بعدی قیمت و راز پامپ آلتکوینها در ۲۰۲۶!

I am long OP and Looking for a target to the 200 Day Moving average and then the .618 on the fibs. 3 days of Green or strong push to the upside. 2026 looks ready to rip for some alts

ydnldn
پیشبینی فروش استراتژیک OPUSDT: تحلیل تکنیکال 4 ساعته با نقاط ورود و خروج دقیق

OPUSDT 📉 4H Perpetual SHORT Entry 0.3219 SL 0.3489 TP 0.2785 I have had a career as a technical analyst for 3 years at an investment management company. To get special access, forex signals, crypto, commodities or investment advice, please contact me on Instagram instagram.com/ydnldn?igsh=MWpmbGdxcnBmcTl6MQ== Should you find this analysis insightful, I invite you to like or leave a comment. Constructive feedback and suggestions are greatly appreciated. For further analyses, please follow me at @ydnldn.

CryptoAnalystSignal
#OP/USDT – Triangle Pattern Breakout Loading?
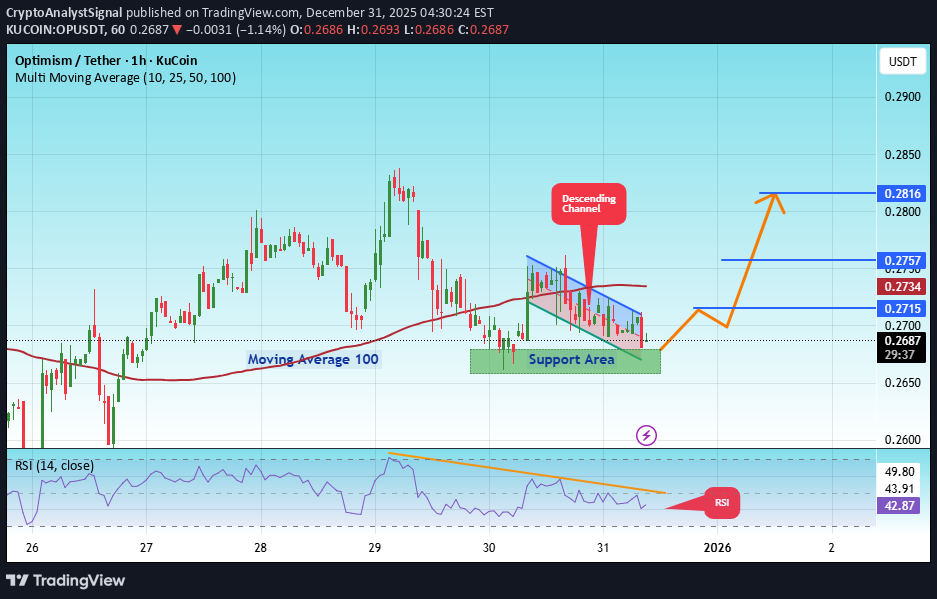
#OP The price is moving in a descending channel on the 1-hour timeframe. It has reached the lower boundary and is heading towards breaking above it, with a retest of the upper boundary expected. We have a downtrend on the RSI indicator, which has reached near the lower boundary, and an upward rebound is expected. There is a key support zone in green at 0.2660. The price has bounced from this zone multiple times and is expected to bounce again. We have a trend towards consolidation above the 100-period moving average, as we are moving close to it, which supports the upward movement. Entry price: 0.2693 First target: 0.2715 Second target: 0.2757 Third target: 0.2816 Stop loss: Below the support zone in green. Don't forget a simple thing: capital management. For inquiries, please leave a comment. Thank you.#OP First target: 0.2715 Reached Second target: 0.2757 Reached Third target: 0.2816 Reached

FireHoseReel
FireHoseReel | Optimism Near Key Breakout Level as Volume Builds

🔥 Welcome To FireHoseReel ! Let’s dive into Optimism (OP) analysis. ⛳️ OP Fundamental Overview Optimism (OP) helps people use Ethereum faster and cheaper by reducing fees and speeding up transactions for DeFi, NFTs, and apps. Ranked around top 80 on CoinMarketCap, it’s a strong mid-cap Layer-2. 👀 OP 4H Overview Optimism (OP) is trading inside a 4H range box and is currently positioned near the end of its bearish trend. A breakout above the descending curve trendline, followed by a break of the overhead resistances, could initiate a bullish 4H trend for OP. 📊 Volume Analysis As price approached the curve trendline and the dynamic resistance at $0.2825, volume increased noticeably. This suggests that a breakout of this zone could lead to a fast and impulsive price move. ✍️ OP Trading Scenarios 🟢 Long Scenario: A confirmed breakout above $0.2825 with increasing buy volume could allow price to break the top of the range and move toward the $0.3439 resistance. 🔴 Short Scenario: A breakdown below $0.2518 could trigger a fast move toward a lower support level. Strong selling volume confirmation would be required. 🧠 Protect your capital first. No setup is worth blowing your account. If risk isn’t controlled, profit means nothing. Trade with rules, not emotions.
CryptoAnalystSignal
#OP/USDT – Triangle Pattern Breakout Loading?
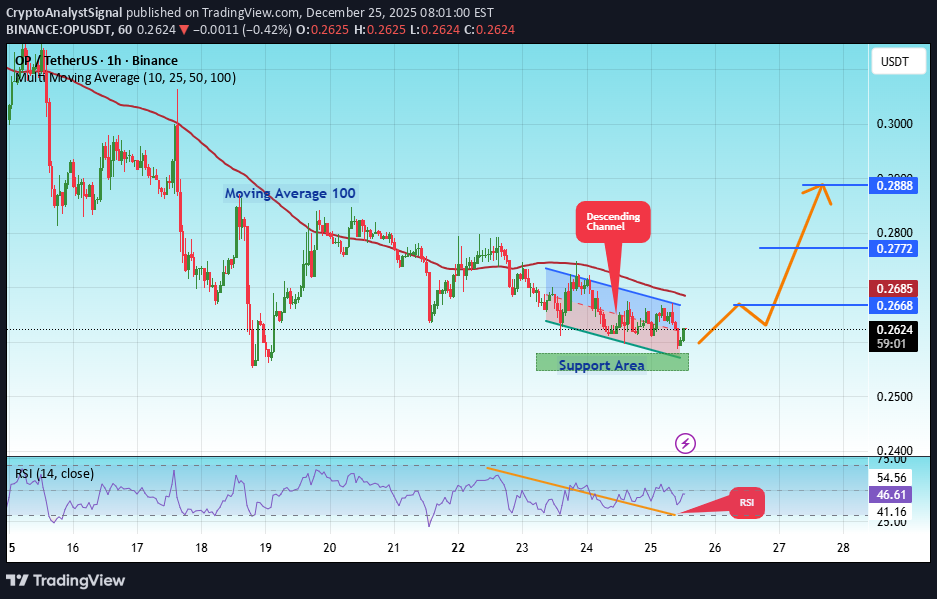
#OP The price is moving in a descending channel on the 1-hour timeframe. It has reached the lower boundary and is heading towards breaking above it, with a retest of the upper boundary expected. We have a downtrend on the RSI indicator, which has reached near the lower boundary, and an upward rebound is expected. There is a key support zone in green at 0.2559. The price has bounced from this zone multiple times and is expected to bounce again. We have a trend towards consolidation above the 100-period moving average, as we are moving close to it, which supports the upward movement. Entry price: 0.2624 First target: 0.2668 Second target: 0.2772 Third target: 0.2888 Don't forget a simple principle: money management. Place your stop-loss order below the support zone in green. For any questions, please leave a comment. Thank you.#OP First target: 0.2668 Reached Second target: 0.2772 Reached
Leo524
$OP 1W Broke Major Support — Be Careful

📌This is a weekly chart, so this shows the long-term direction of $OP. 📌Blue arrows on the chart show support zones.Every time price came to these areas before, buyers stepped in and price moved up from there. 📌Red arrows on the chart show rejection points.Price tried to move up, but sellers pushed it back down strongly. 📌For the last 1 and a half years, OP has been in a clear downtrend.The trendline shows that price is making lower highs again and again. 📌Price tried to break the downtrend 3 times, but failed every time ❌Each failure is marked with red arrows (strong rejection). 📌Important thing to notice: 👉 Price has now broken TWO major support zones (blue arrow areas) 👉 After breaking them, price did not bounce back 📌This means buyers are weak and sellers are still controlling the market. 📌Final conclusion (simple): As long as price stays below broken supports and below the trendline, OP remains BEARISH on the higher timeframe 🔴

Crypto4light
Optimism Next Wave: Mid-Term Targets Uncovered
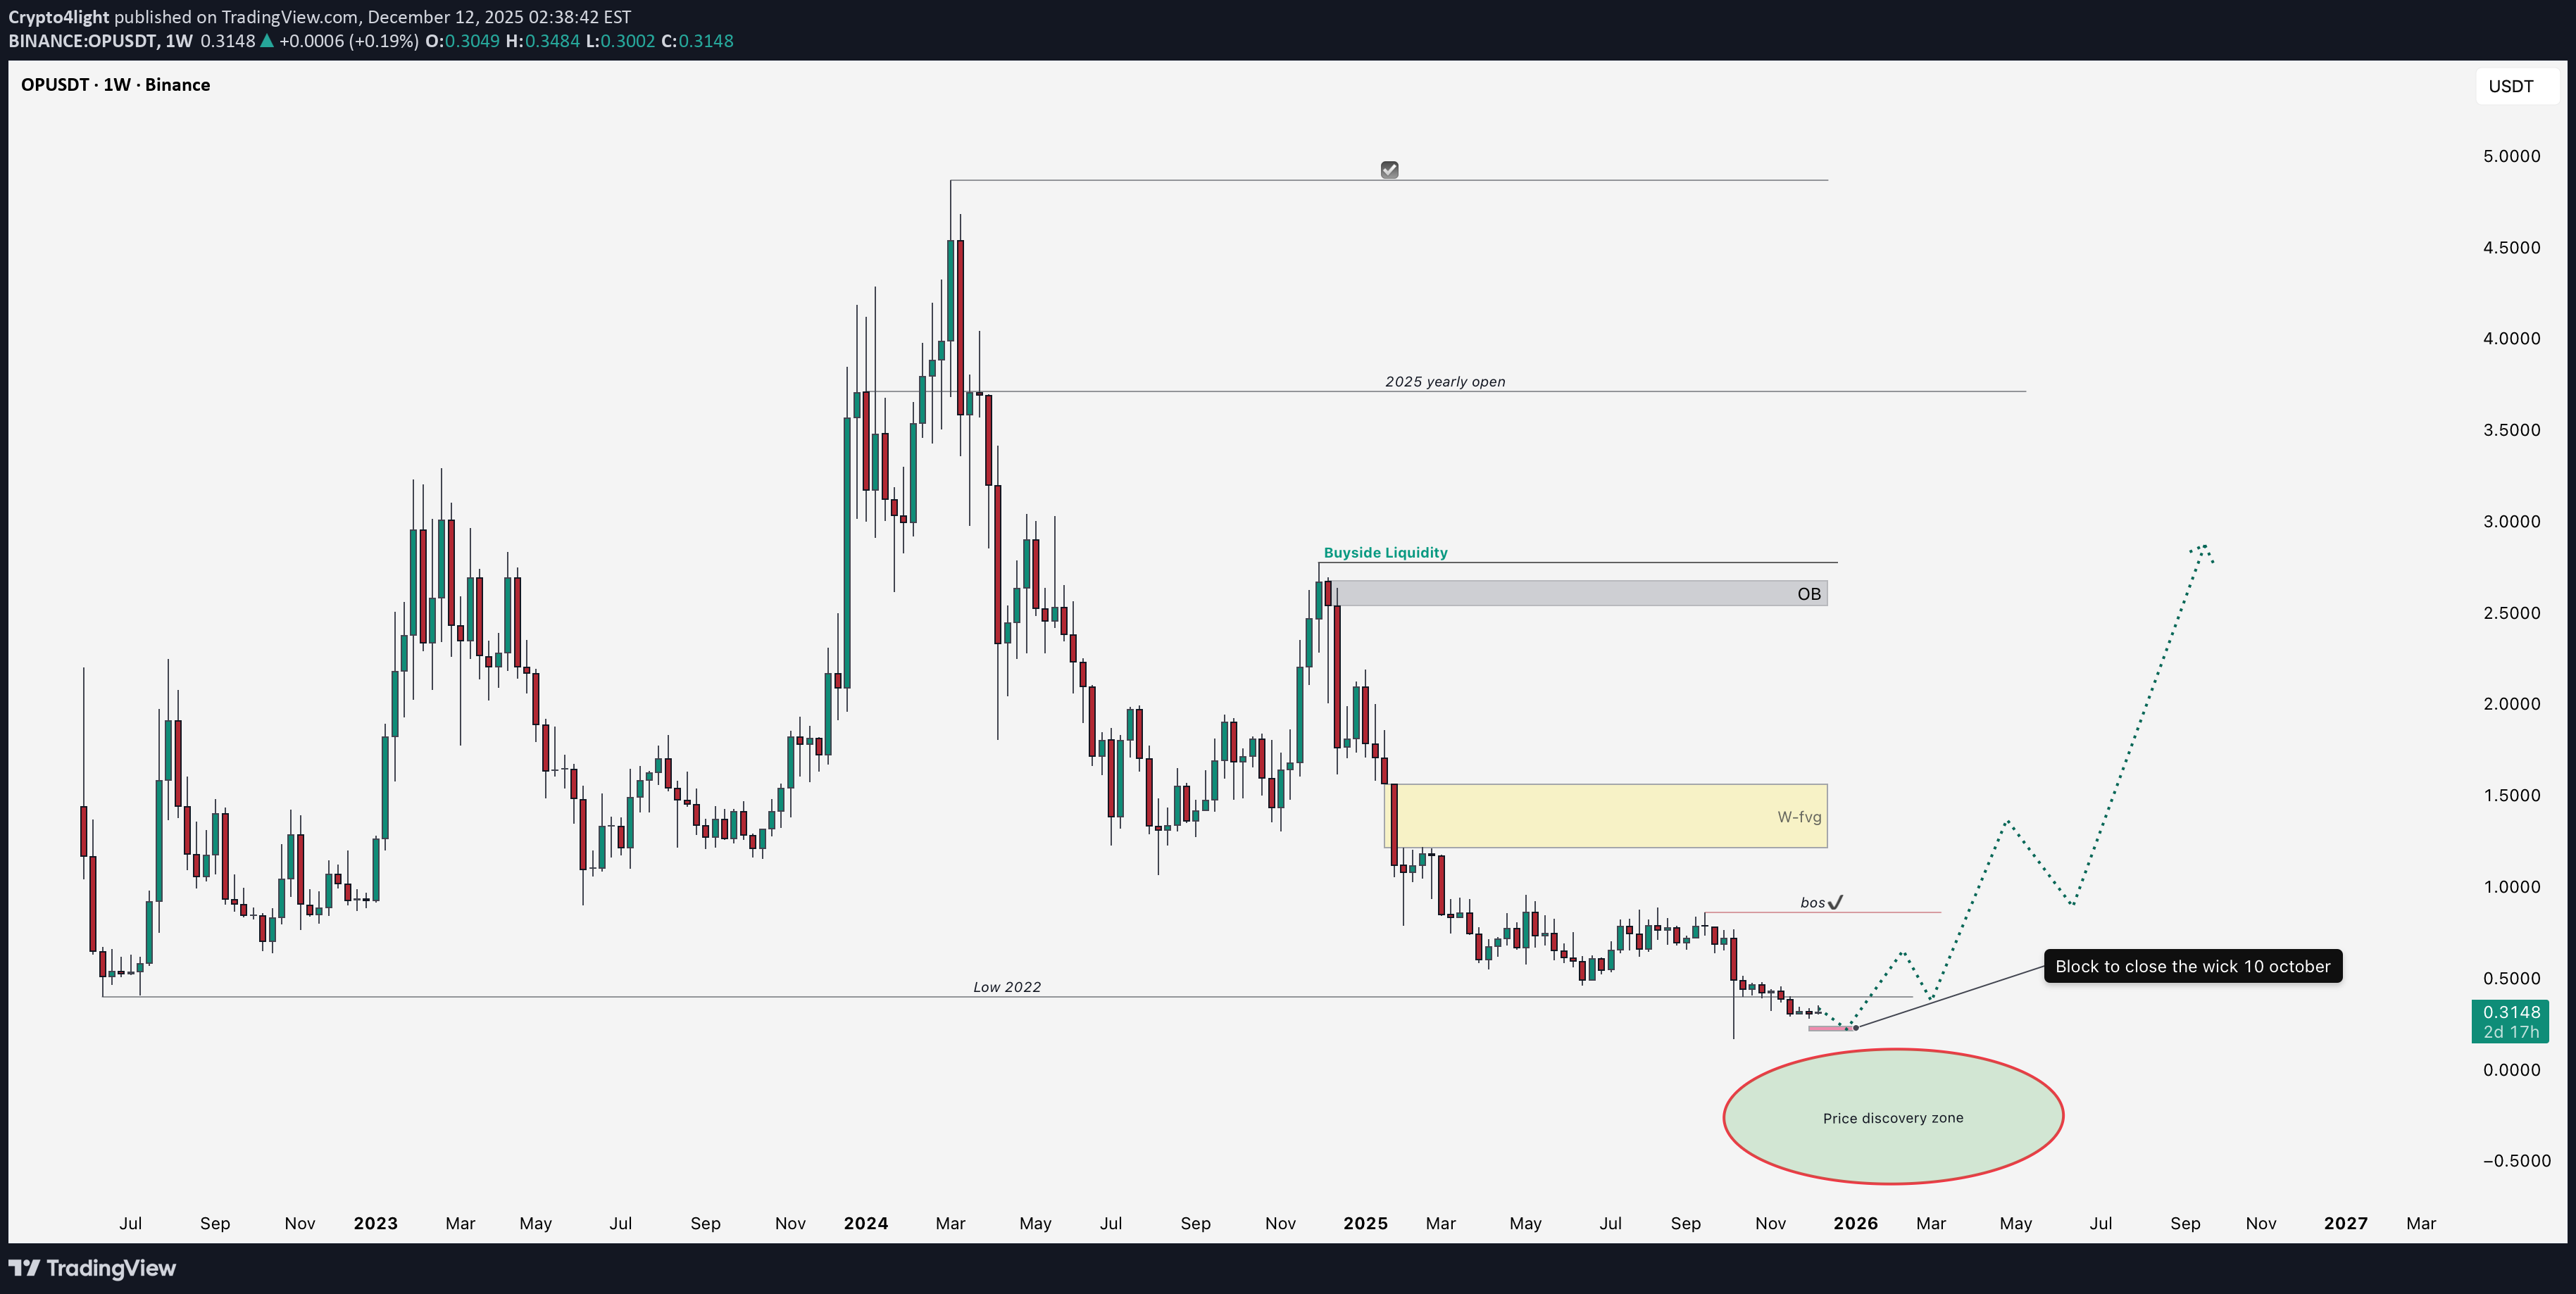
We are not taking OPUSDT fundamental factors into account because, let’s be honest, they have absolutely no impact on the price movement on the chart! We’ll focus exclusively on the price action setup. For over a year, we’ve been in a downtrend. Nothing can fall forever, so considering the seasonality and the ongoing QE, I expect the price to find support in a small demand block (to cover the October 10 wick), followed by an impulsive upward move and a structure break on the weekly timeframe. After that — a test of the weekly FVG and a continuation toward the Weekly Order Block and buyside liquidity zone. Once the targets are reached, I will update this idea. If the price moves below the October 10 wick, we enter a free fall into the price discovery zone.
CryptoAnalystSignal
سیگنال خرید قوی OP/USDT: آیا اوپتیمیزم آماده انفجار قیمتی است؟
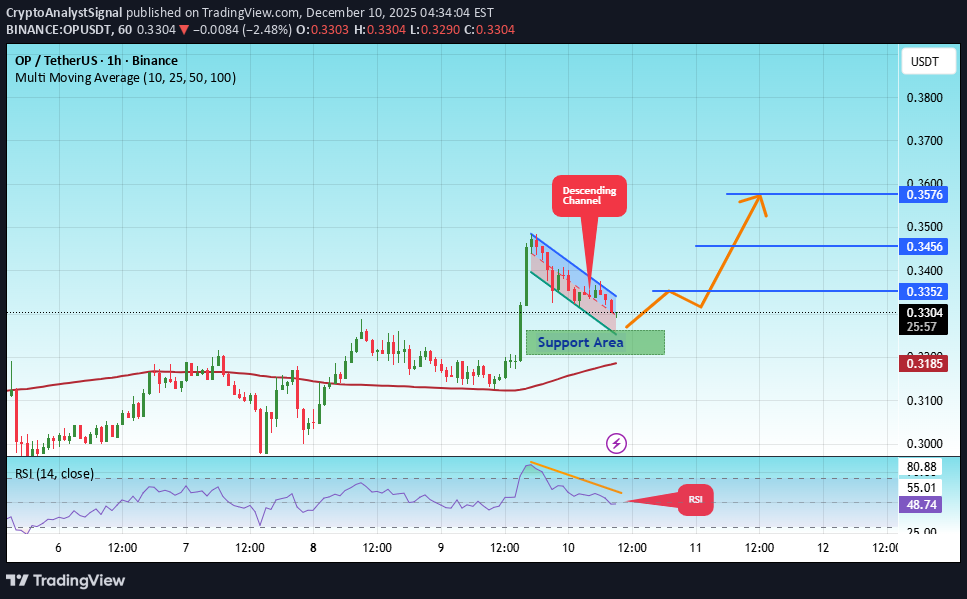
#OP The price is moving in a descending channel on the 1-hour timeframe. It has reached the lower boundary and is heading towards breaking above it, with a retest of the upper boundary expected. We have a downtrend on the RSI indicator, which has reached near the lower boundary, and an upward rebound is expected. There is a key support zone in green at 0.3230. The price has bounced from this level multiple times and is expected to bounce again. We have a trend towards consolidation above the 100-period moving average, as we are moving close to it, which supports the upward movement. Entry price: 0.3300 First target: 0.3352 Second target: 0.3456 Third target: 0.3576 Don't forget a simple principle: money management. Place your stop-loss order below the support zone in green. For any questions, please leave a comment. Thank you.
Disclaimer
Any content and materials included in Sahmeto's website and official communication channels are a compilation of personal opinions and analyses and are not binding. They do not constitute any recommendation for buying, selling, entering or exiting the stock market and cryptocurrency market. Also, all news and analyses included in the website and channels are merely republished information from official and unofficial domestic and foreign sources, and it is obvious that users of the said content are responsible for following up and ensuring the authenticity and accuracy of the materials. Therefore, while disclaiming responsibility, it is declared that the responsibility for any decision-making, action, and potential profit and loss in the capital market and cryptocurrency market lies with the trader.