
benjihyam
@t_benjihyam

What symbols does the trader recommend buying?
Purchase History
پیام های تریدر
Filter
benjihyam
Is everyone too bearish on BTC? Up to $108k before down?
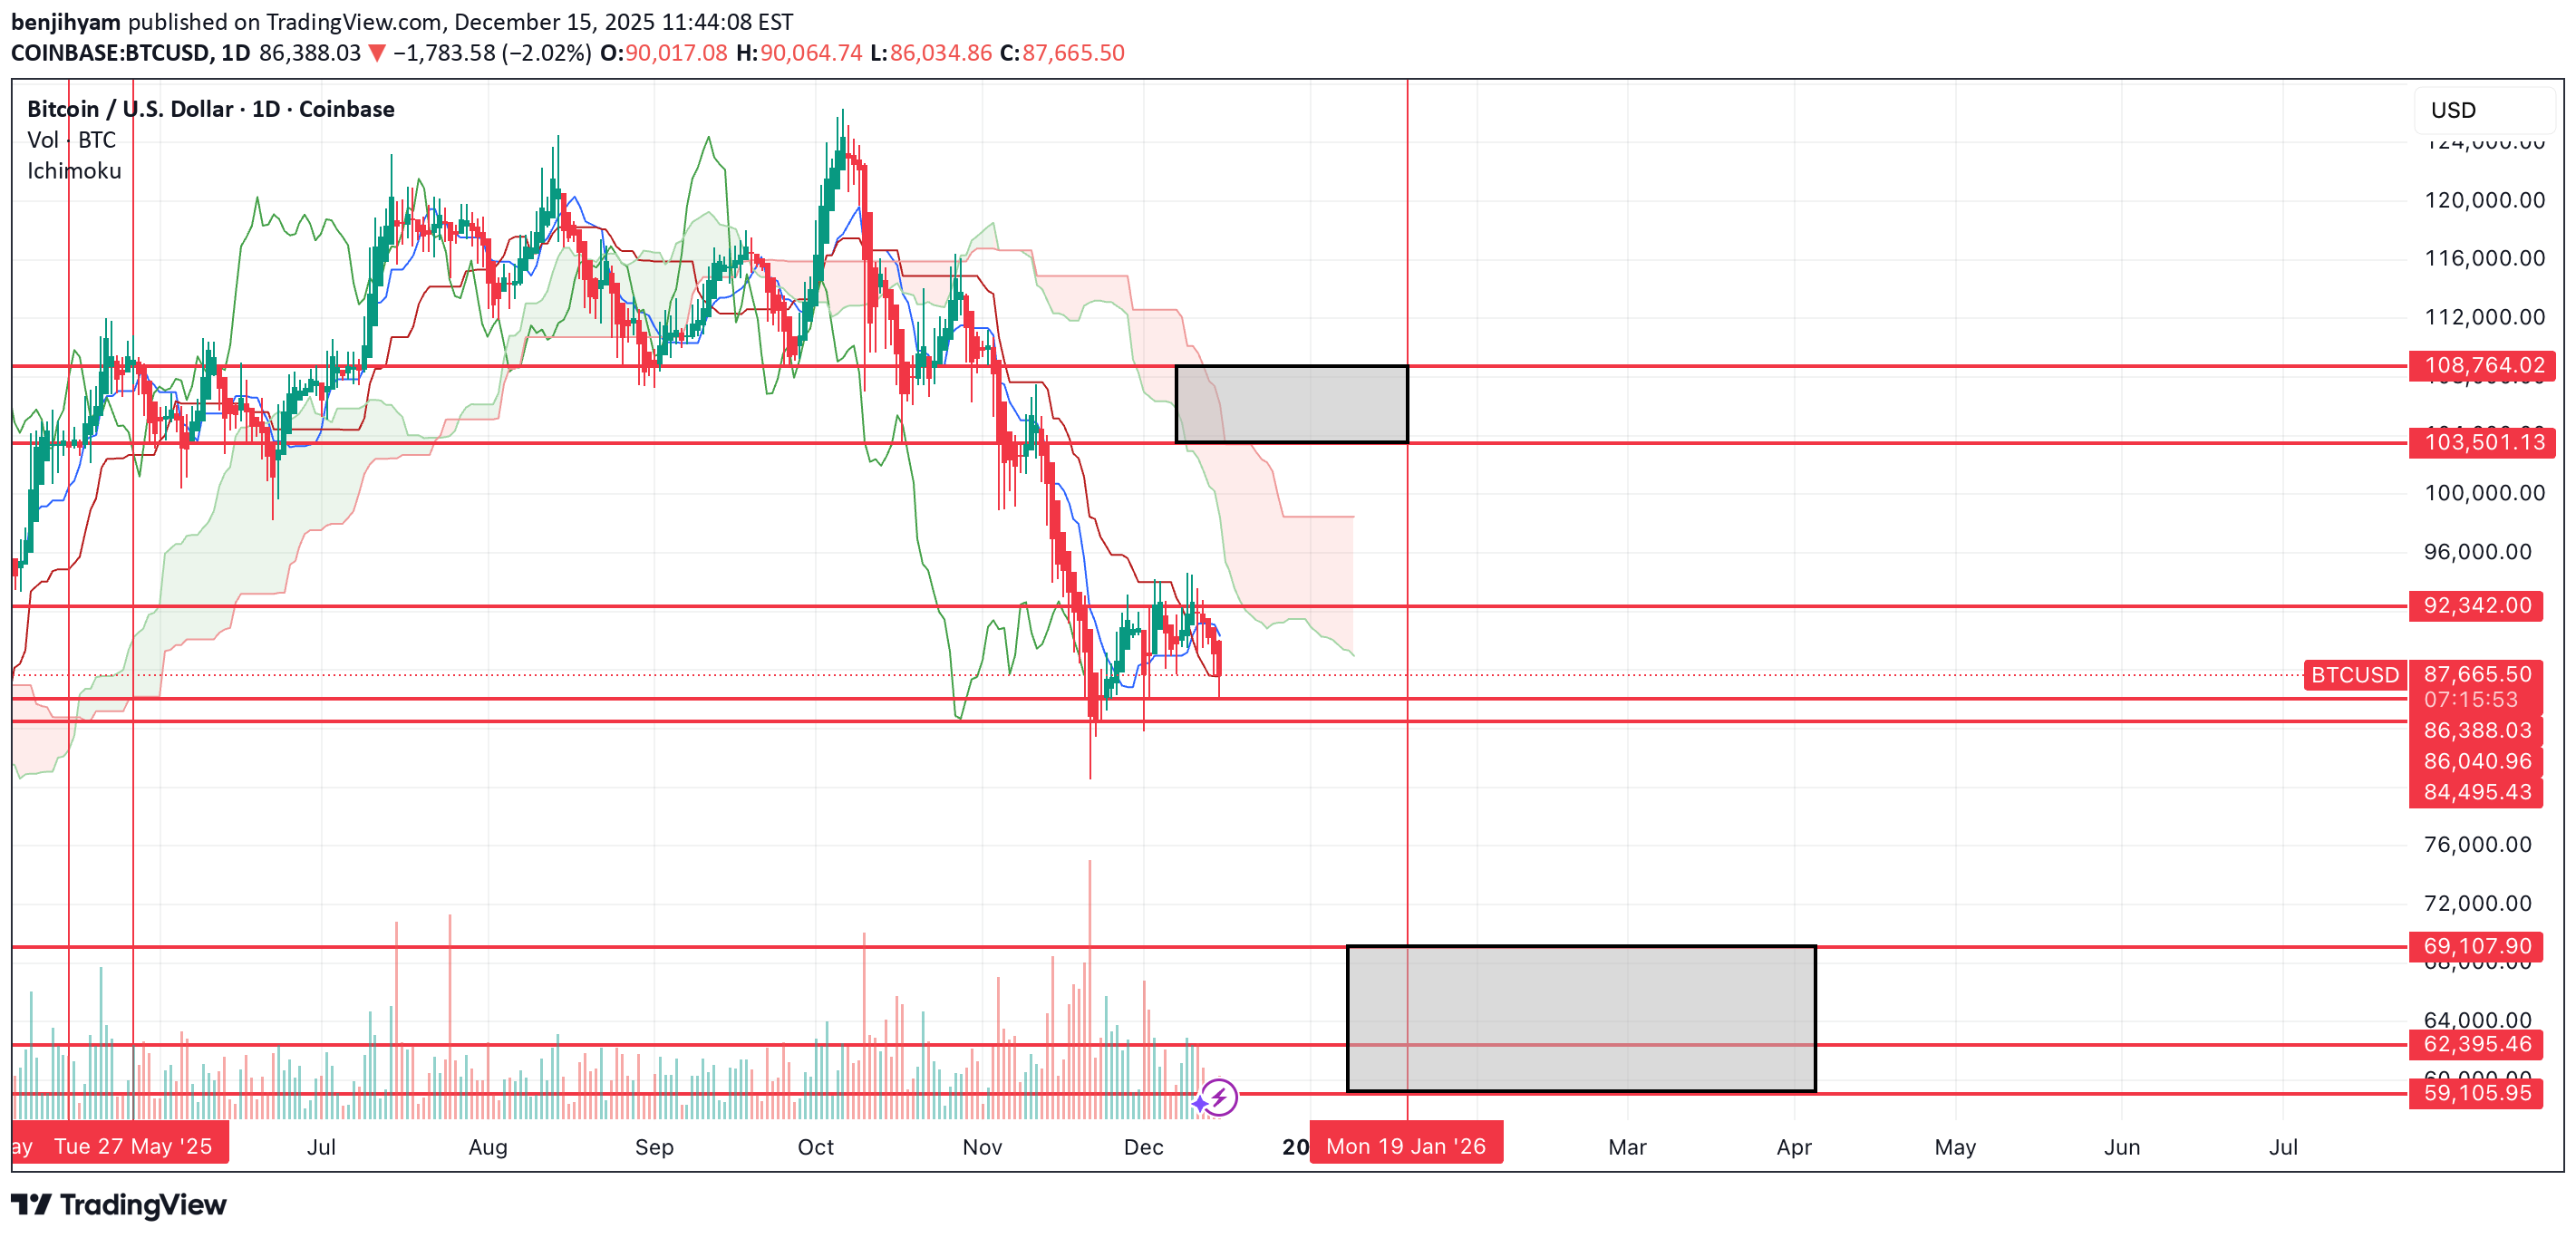
Everyone is extremely bearish on BTC here calling for new lows, but the chart and indicators don't look like they support a move straight down. Even though we're technically consolidating in a bear flag, I don't think we actually break to the downside (yet). To me, it looks like we should see a large bounce first up to the $103k-108k range, then I think a larger downside move can play out down to the lower support levels. The reason why I don't think we see a move straight down is because we're so oversold on high timeframes (weekly) and we're still above key support levels. It makes more sense to me to see a fake out move up that makes everyone bullish again before we see the large move down. As long as we remain above that $86.1k support level, then I think this is a strong possibility of an outcome. Let's see if we can hold that level and how it plays out.
benjihyam
بیت کوین در آستانه جهش؛ اما آیا این یک تله صعودی قبل از سقوط بزرگ است؟
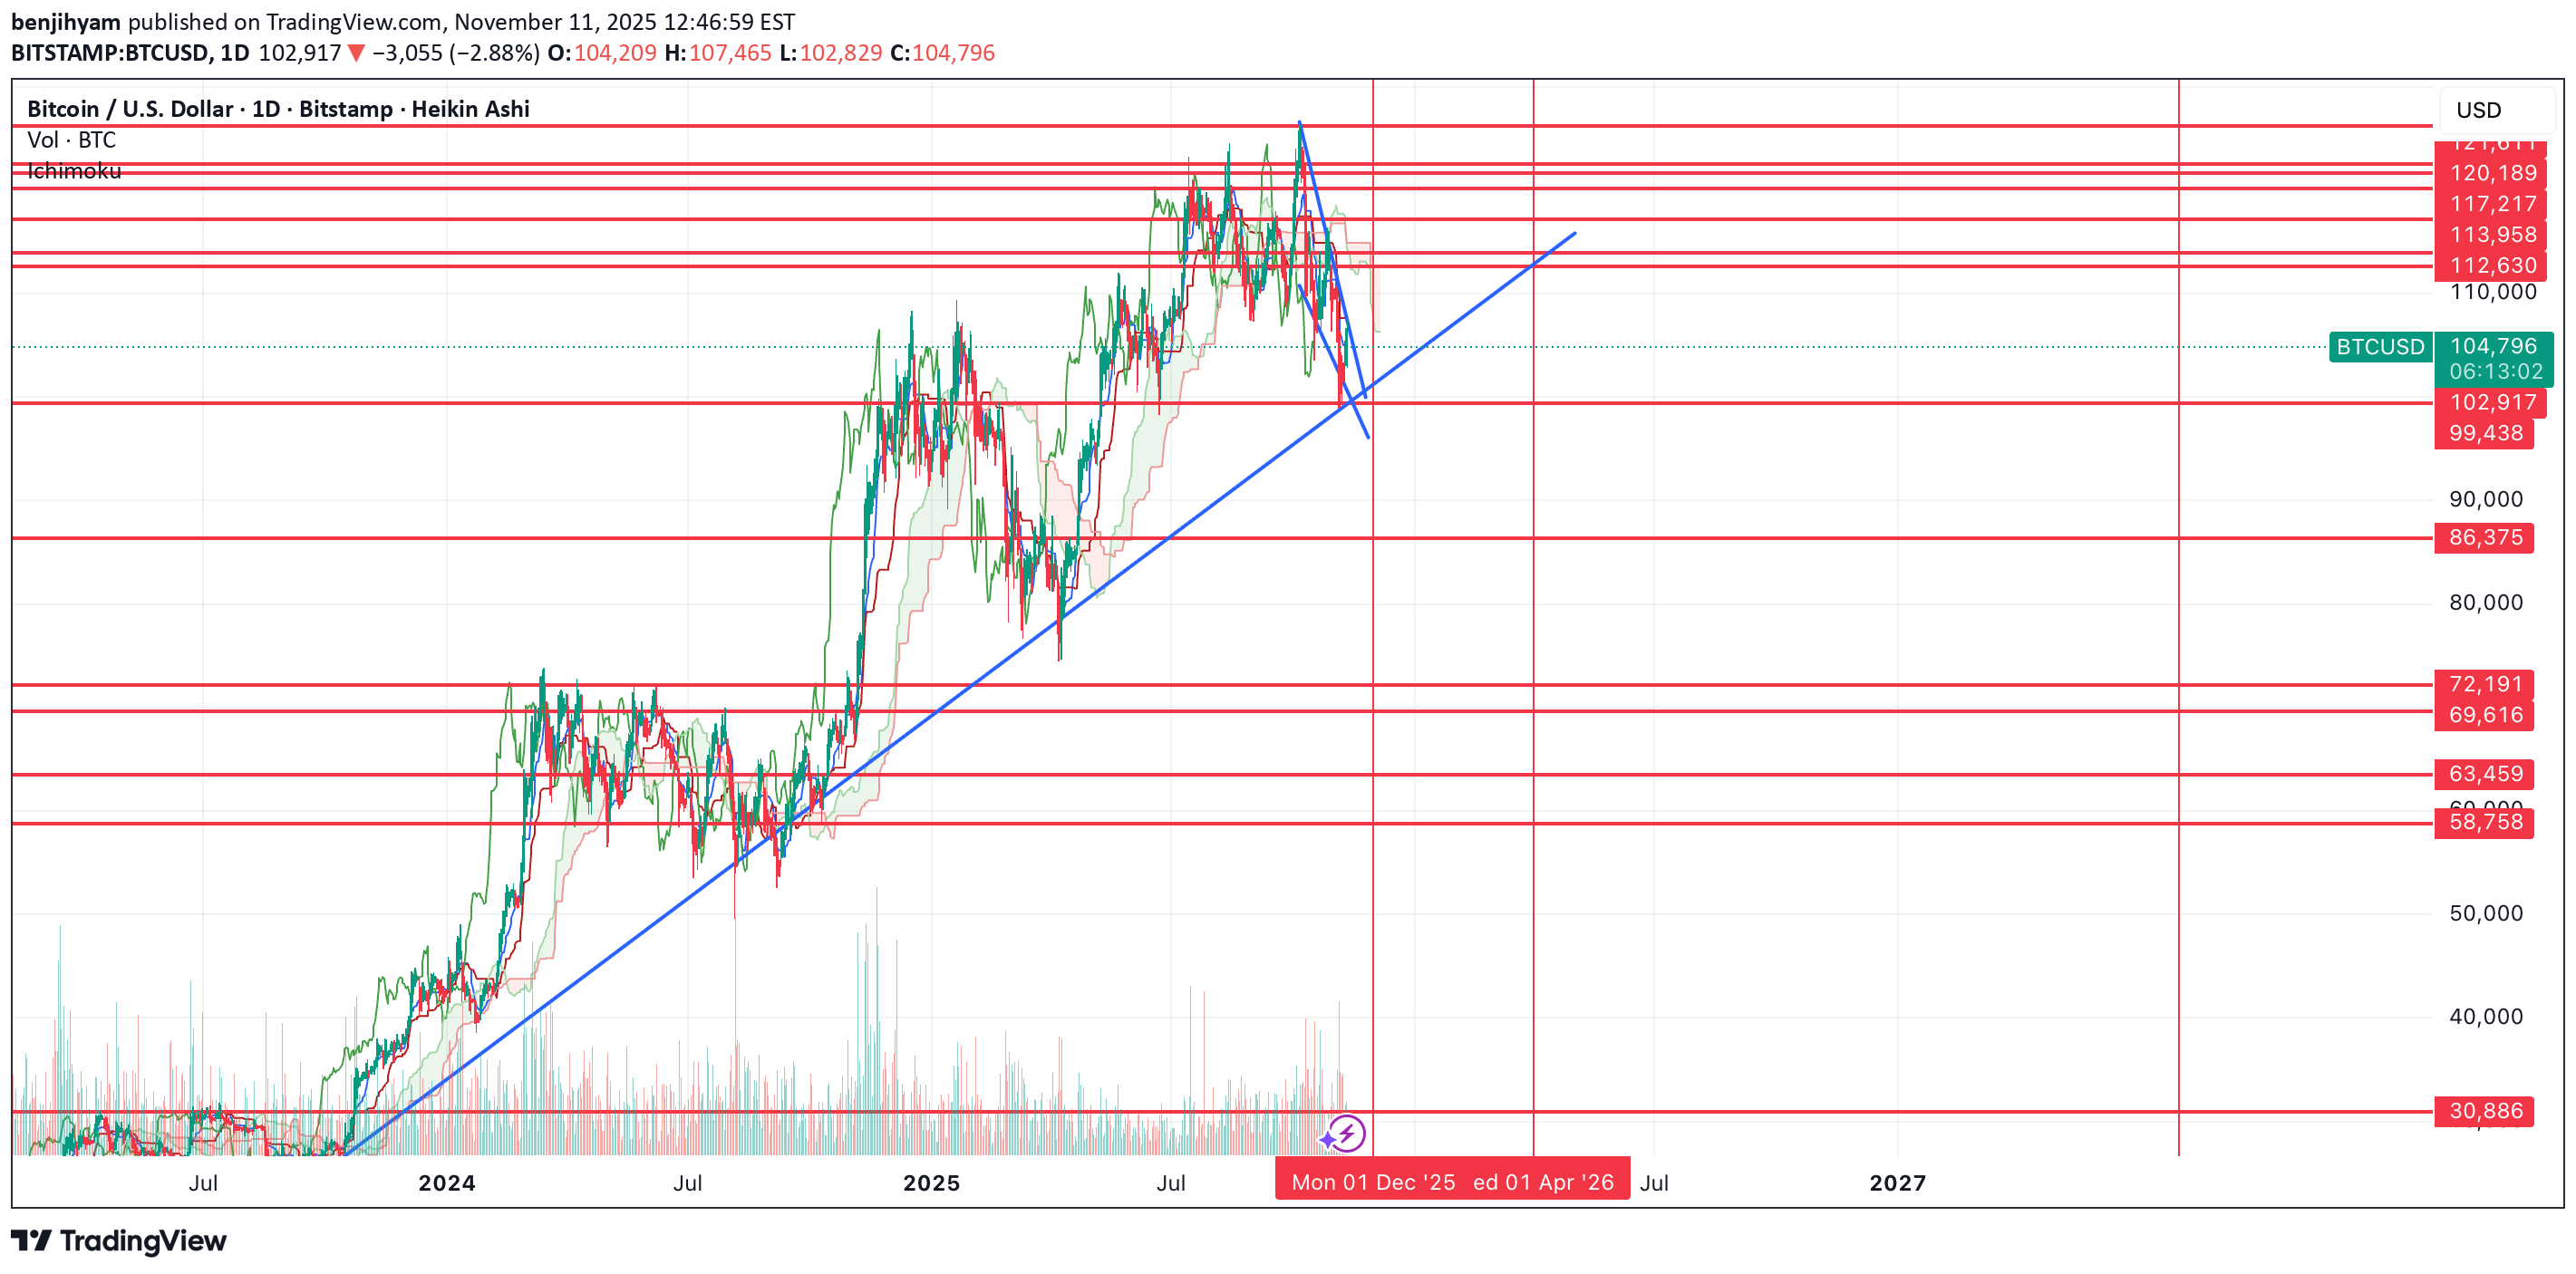
As you can see from the chart, BTC formed a falling wedge and looks set to breakout to the upside from it. I've marked off areas of resistance, but I think if we do get a breakout, the areas you'll want to take profit are $117k and $121-122k as the most likely areas for price to reject. I think at those levels, you'll want to derisk or set stop losses, because I think it's likely that we can fall a lot further. The trigger to go short would be losing the diagonal trend line that goes all the way back to October 2023 when the start of the bullish move happened. A move below that trend line should indicate the bullish move is finished and I think that we could potentially move down to the $60k-72k support levels. I've marked off a lower resistance at $30k, just incase we see an extreme move in the worst case scenario. Let's see how it pans out over the coming months.
benjihyam
آیا MicroStrategy (MSTR) پیش از سقوط نهایی به ۱۰۰ دلار، تا ۳۰۰ دلار جهش خواهد کرد؟
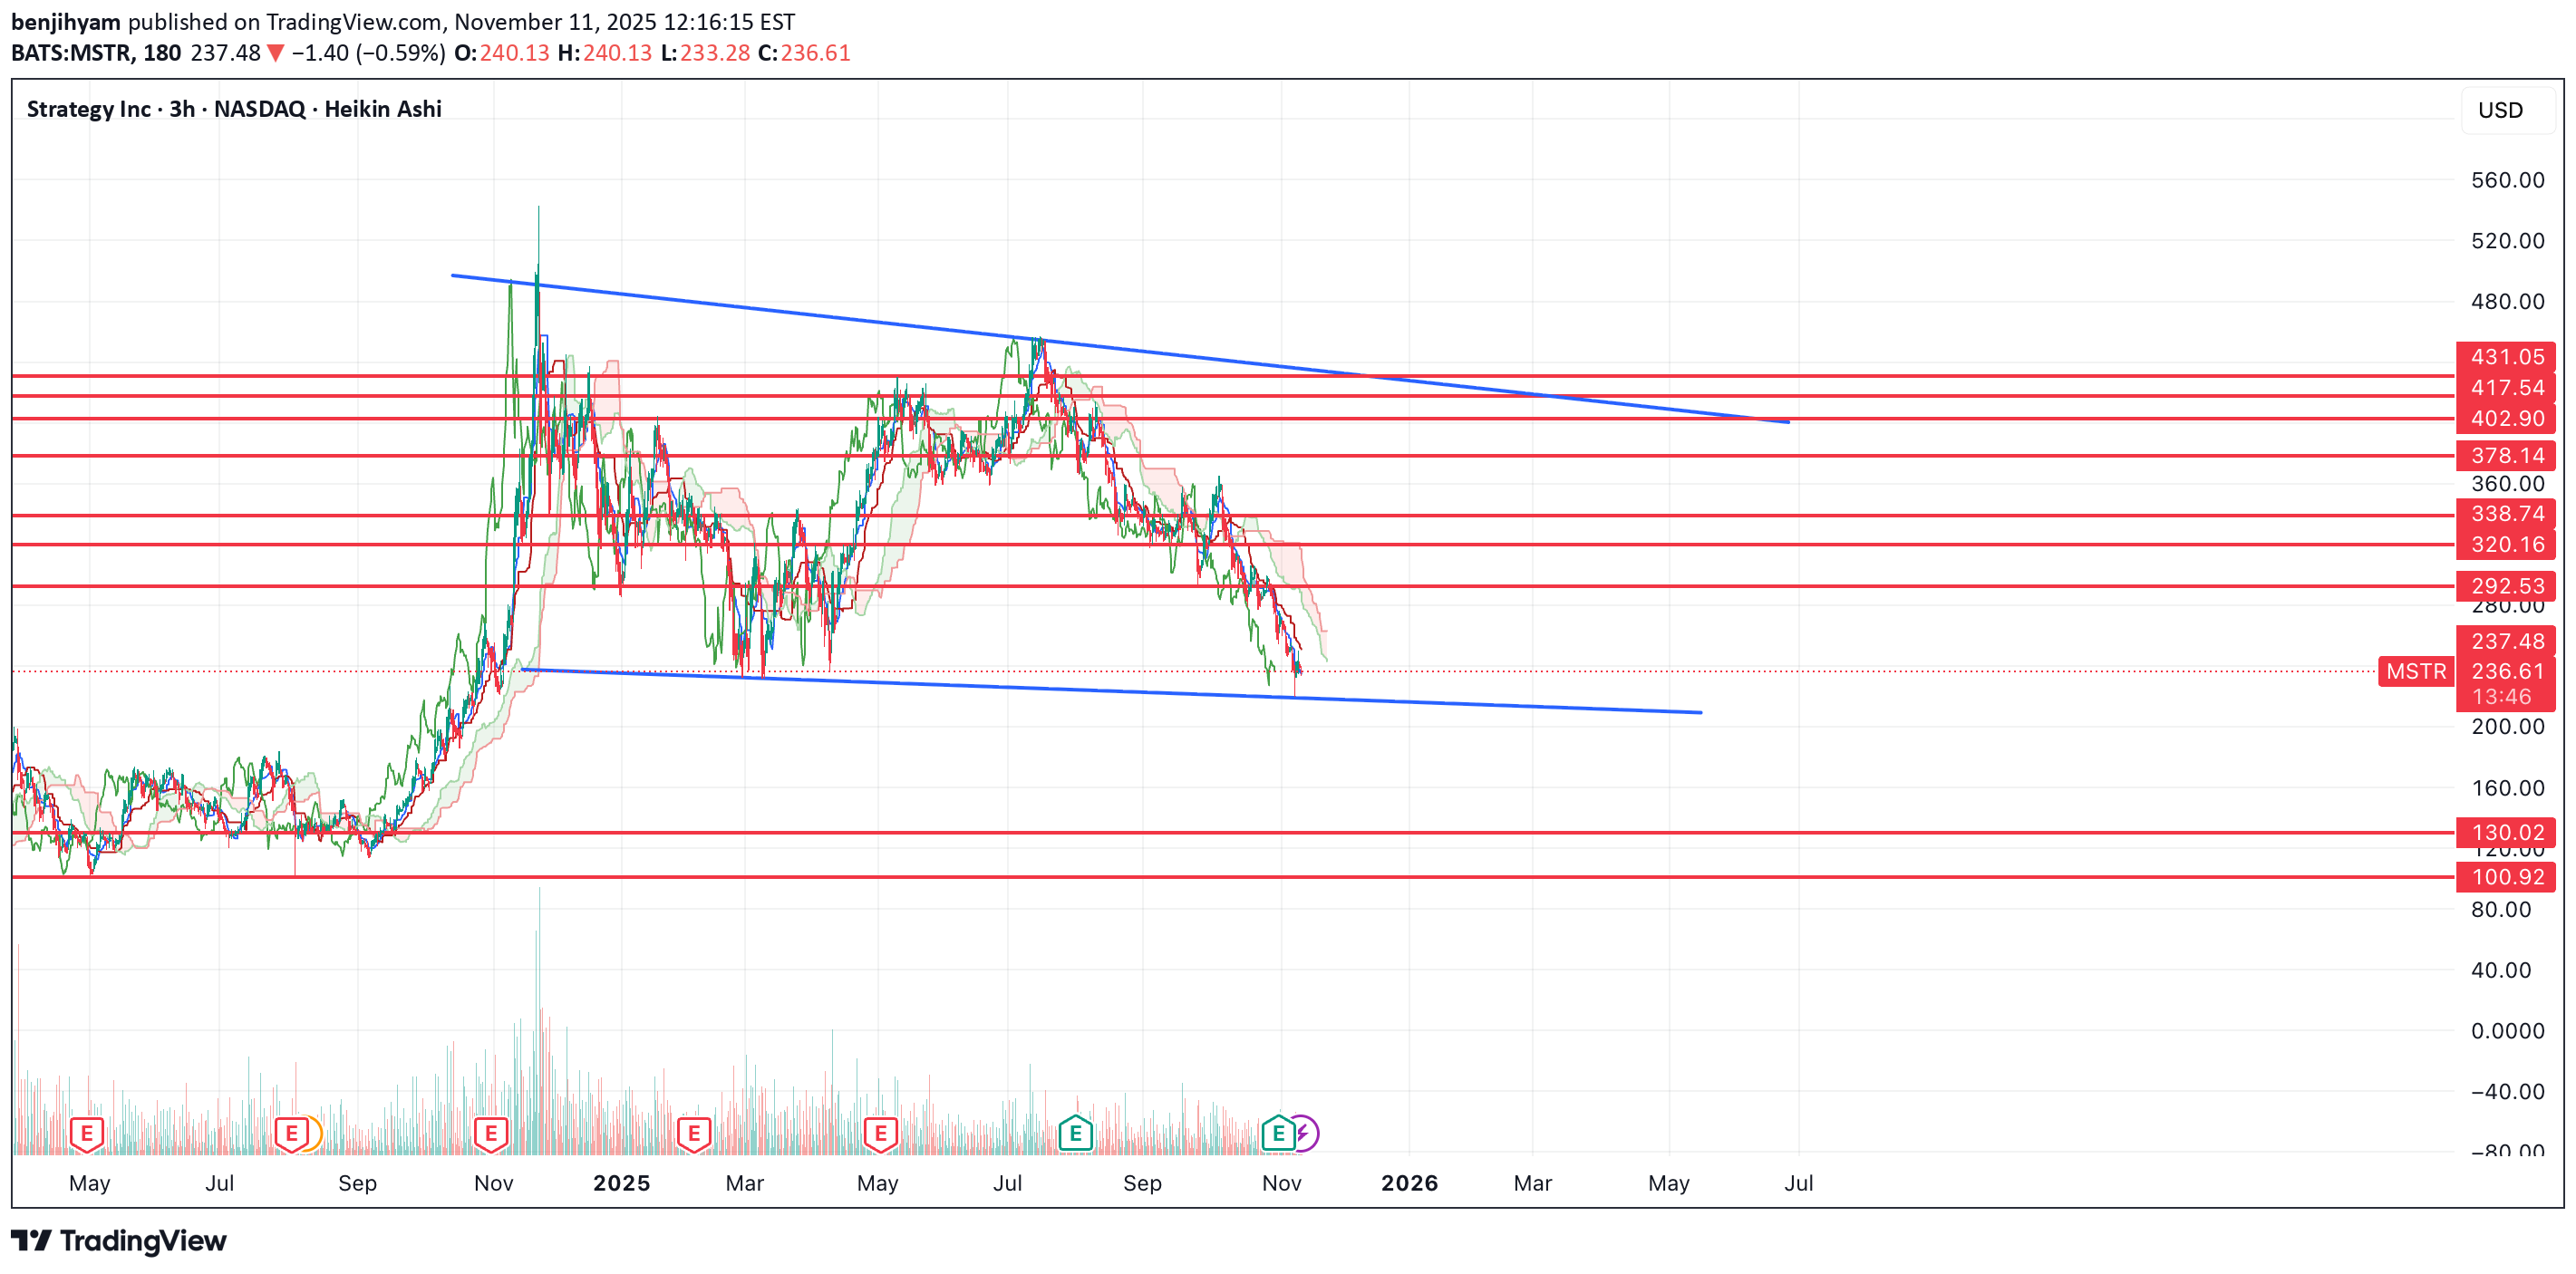
Ever since Early October, MSTR has been falling. We've now reached the bottom of a flag structure and I'd expect a bounce here before we fall further. I think the most likely path from here is that we see a rally into the $300 zone, however, it's possible that we can go up to the top of the flag before falling further. That said, if we get a rally, it'll be a rally you want to sell because eventually I think we're heading down to the $100 level before you want to become a long term buyer. I've marked off key resistances on the path up to take profits on a long, should the rally play out from here.
benjihyam
تحلیل تکنیکال TRB: آیا توکن تِلر آماده جهش انفجاری به ۶۸ تا ۱۴۴ دلار است؟
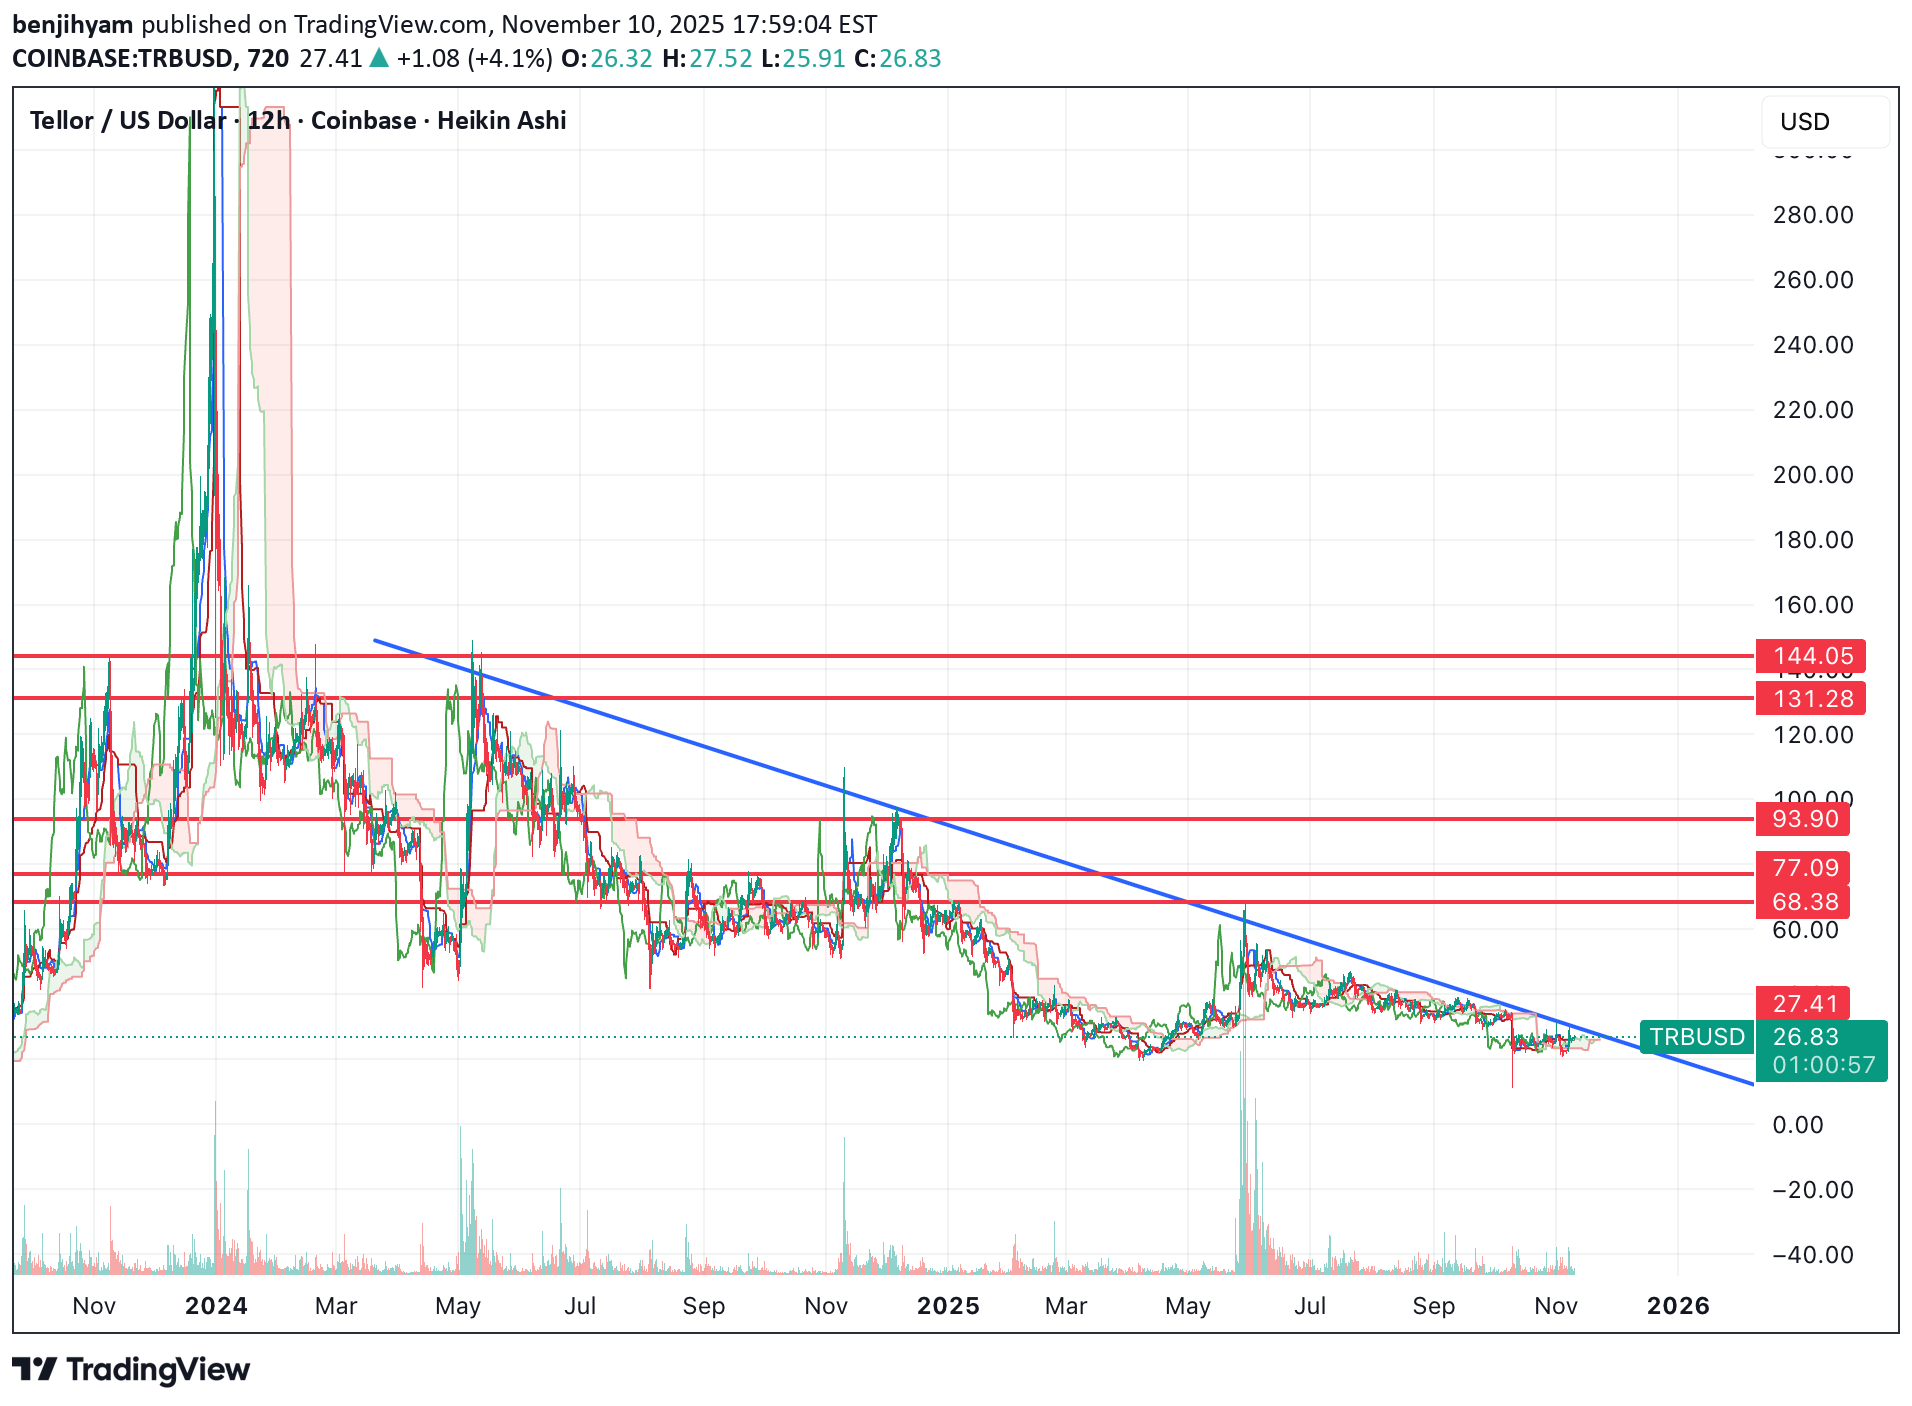
Tellor has be falling since early 2024, however, it's starting to look interesting here for a short term run. If we can break over the trend line, I think there's a possibility of making a run to the $68 region, and potentially higher all the way up to the $144 resistance. When TRB does move, it typically moves quickly. Let's see how it plays out over the coming weeks.
benjihyam
آیا "رز" به مرز ۰.۱۳ دلار میرسد؟ اوجگیری جدید در بازار حریم خصوصی!
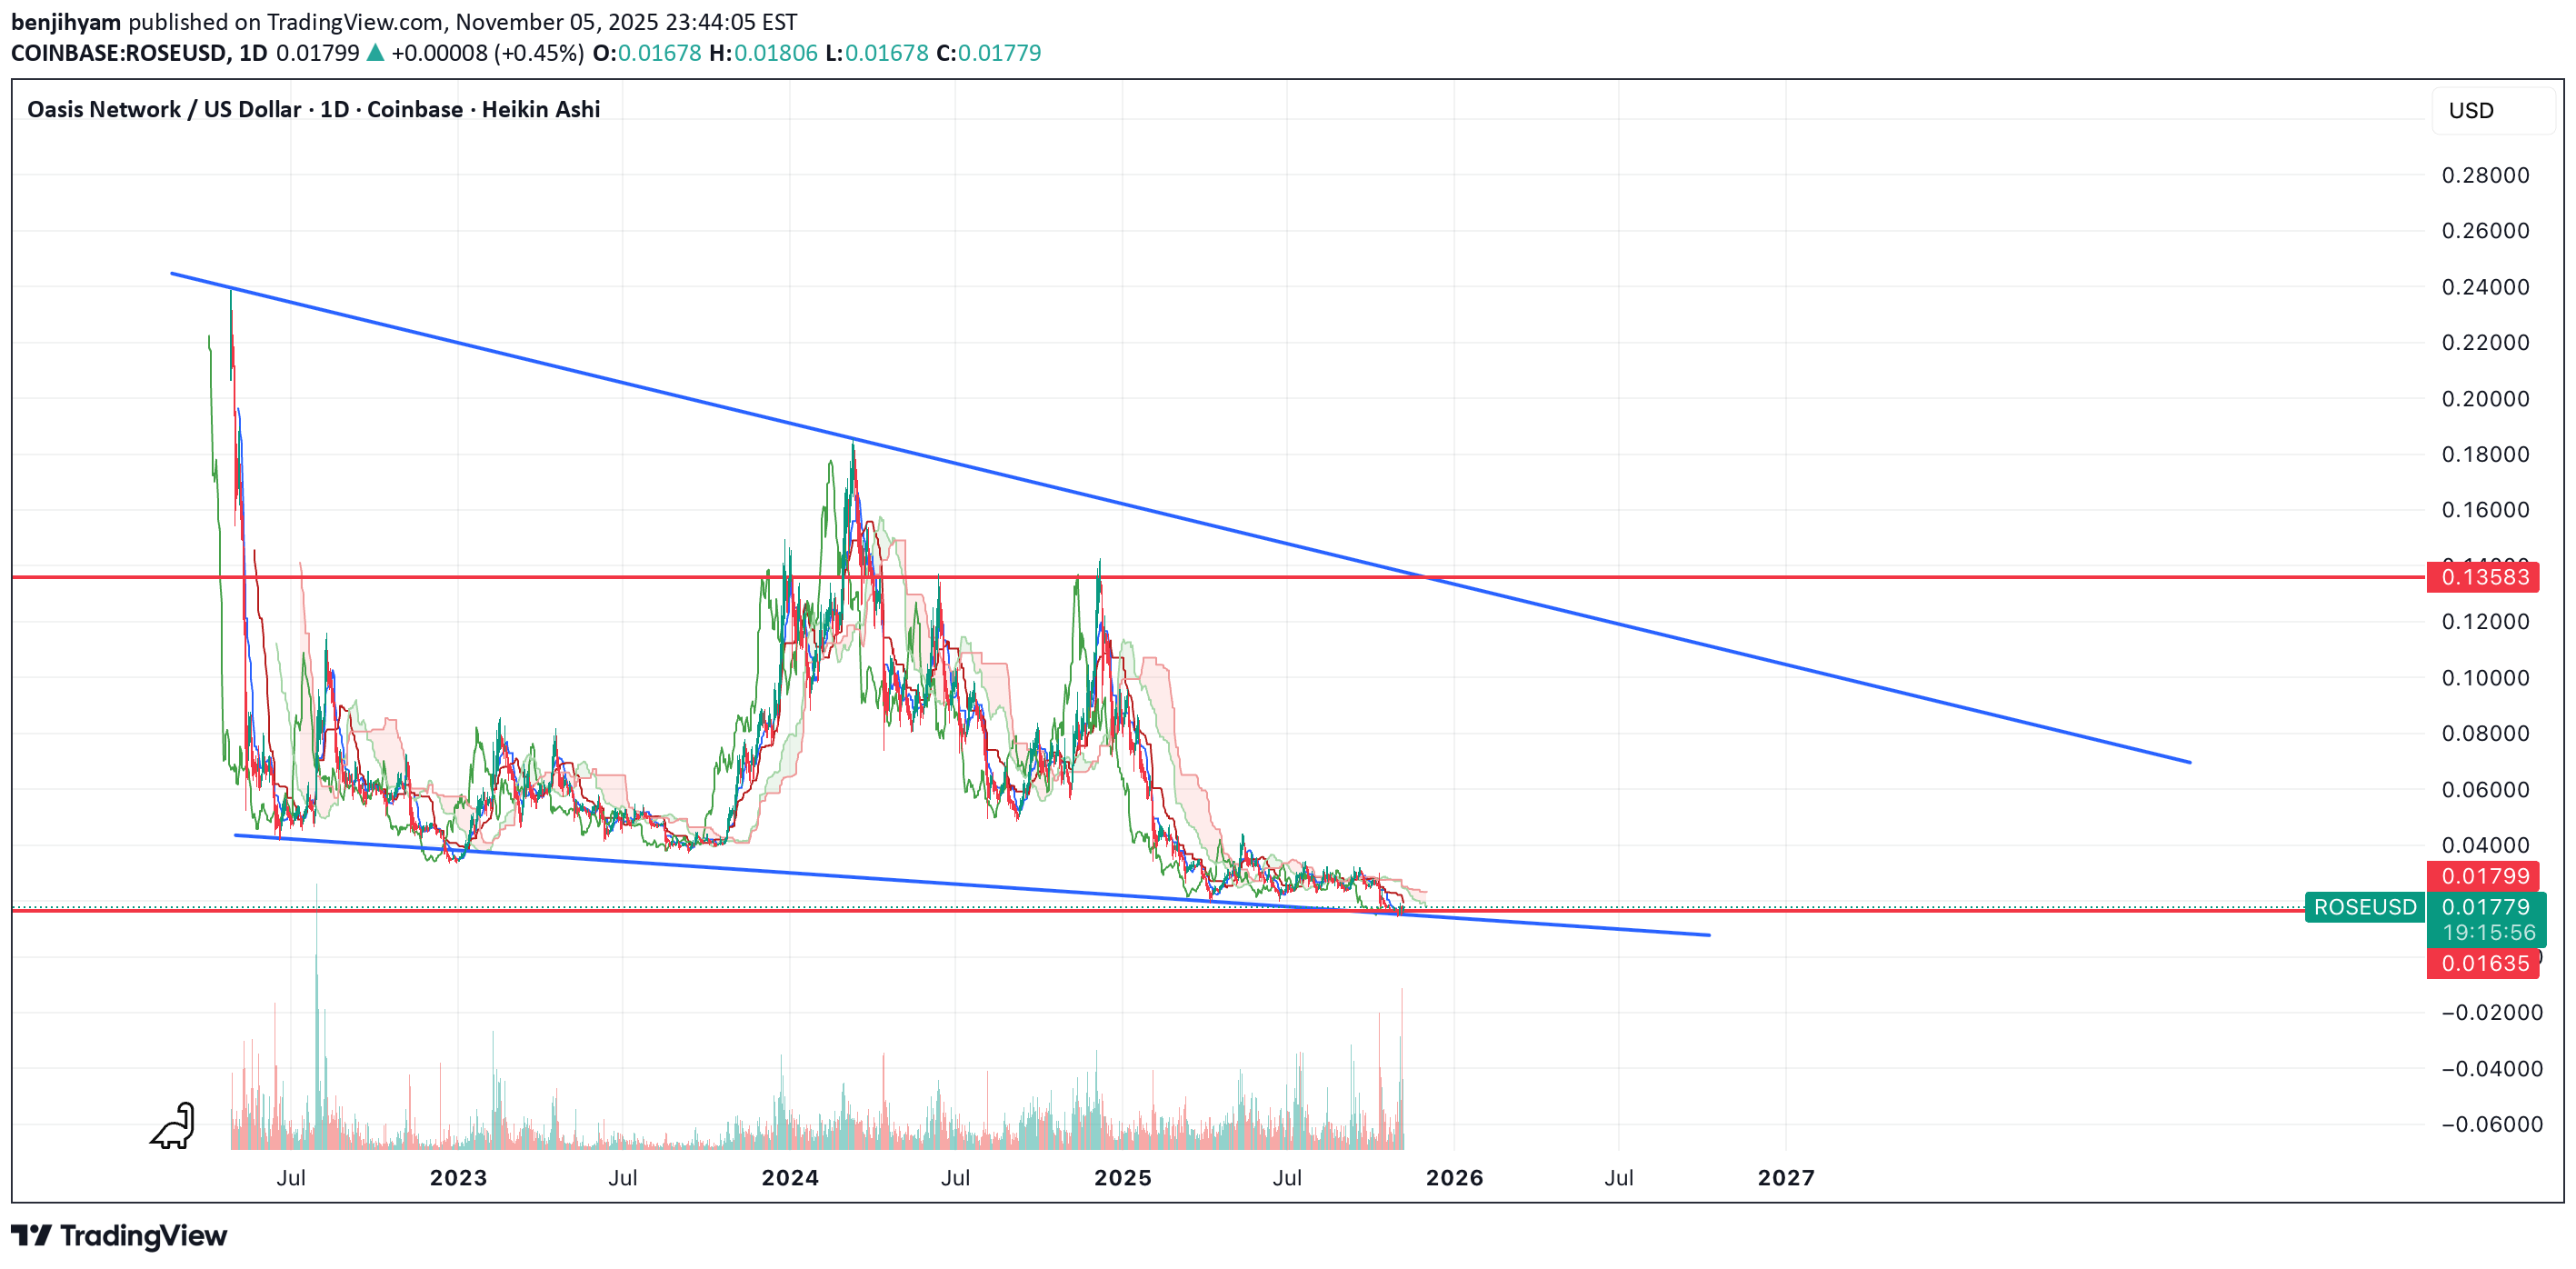
I've been watching the chart of Oasis for years. The privacy space has always interested me, and while I missed the Zcash run, it's clear that privacy coins are a big trend right now. Zcash ran, Dash ran, Bat is trying to make a run, and now I think it's rose's time to run. It's looking like one of the most bullish charts at the moment and could have gains that are close to what Zcash did. If you look at Heikin ashi candles, high time frames are starting to turn bullish 1D, 3D, 4D, etc. Maybe as soon as next week we can start to see a large move? Let's see. If we do see a run, I think it can make it all the way up to $.135.
benjihyam
آیا بیت کوین به کف قیمتی رسید؟ پیشبینی صعود تا ۱۲۶ هزار دلار!
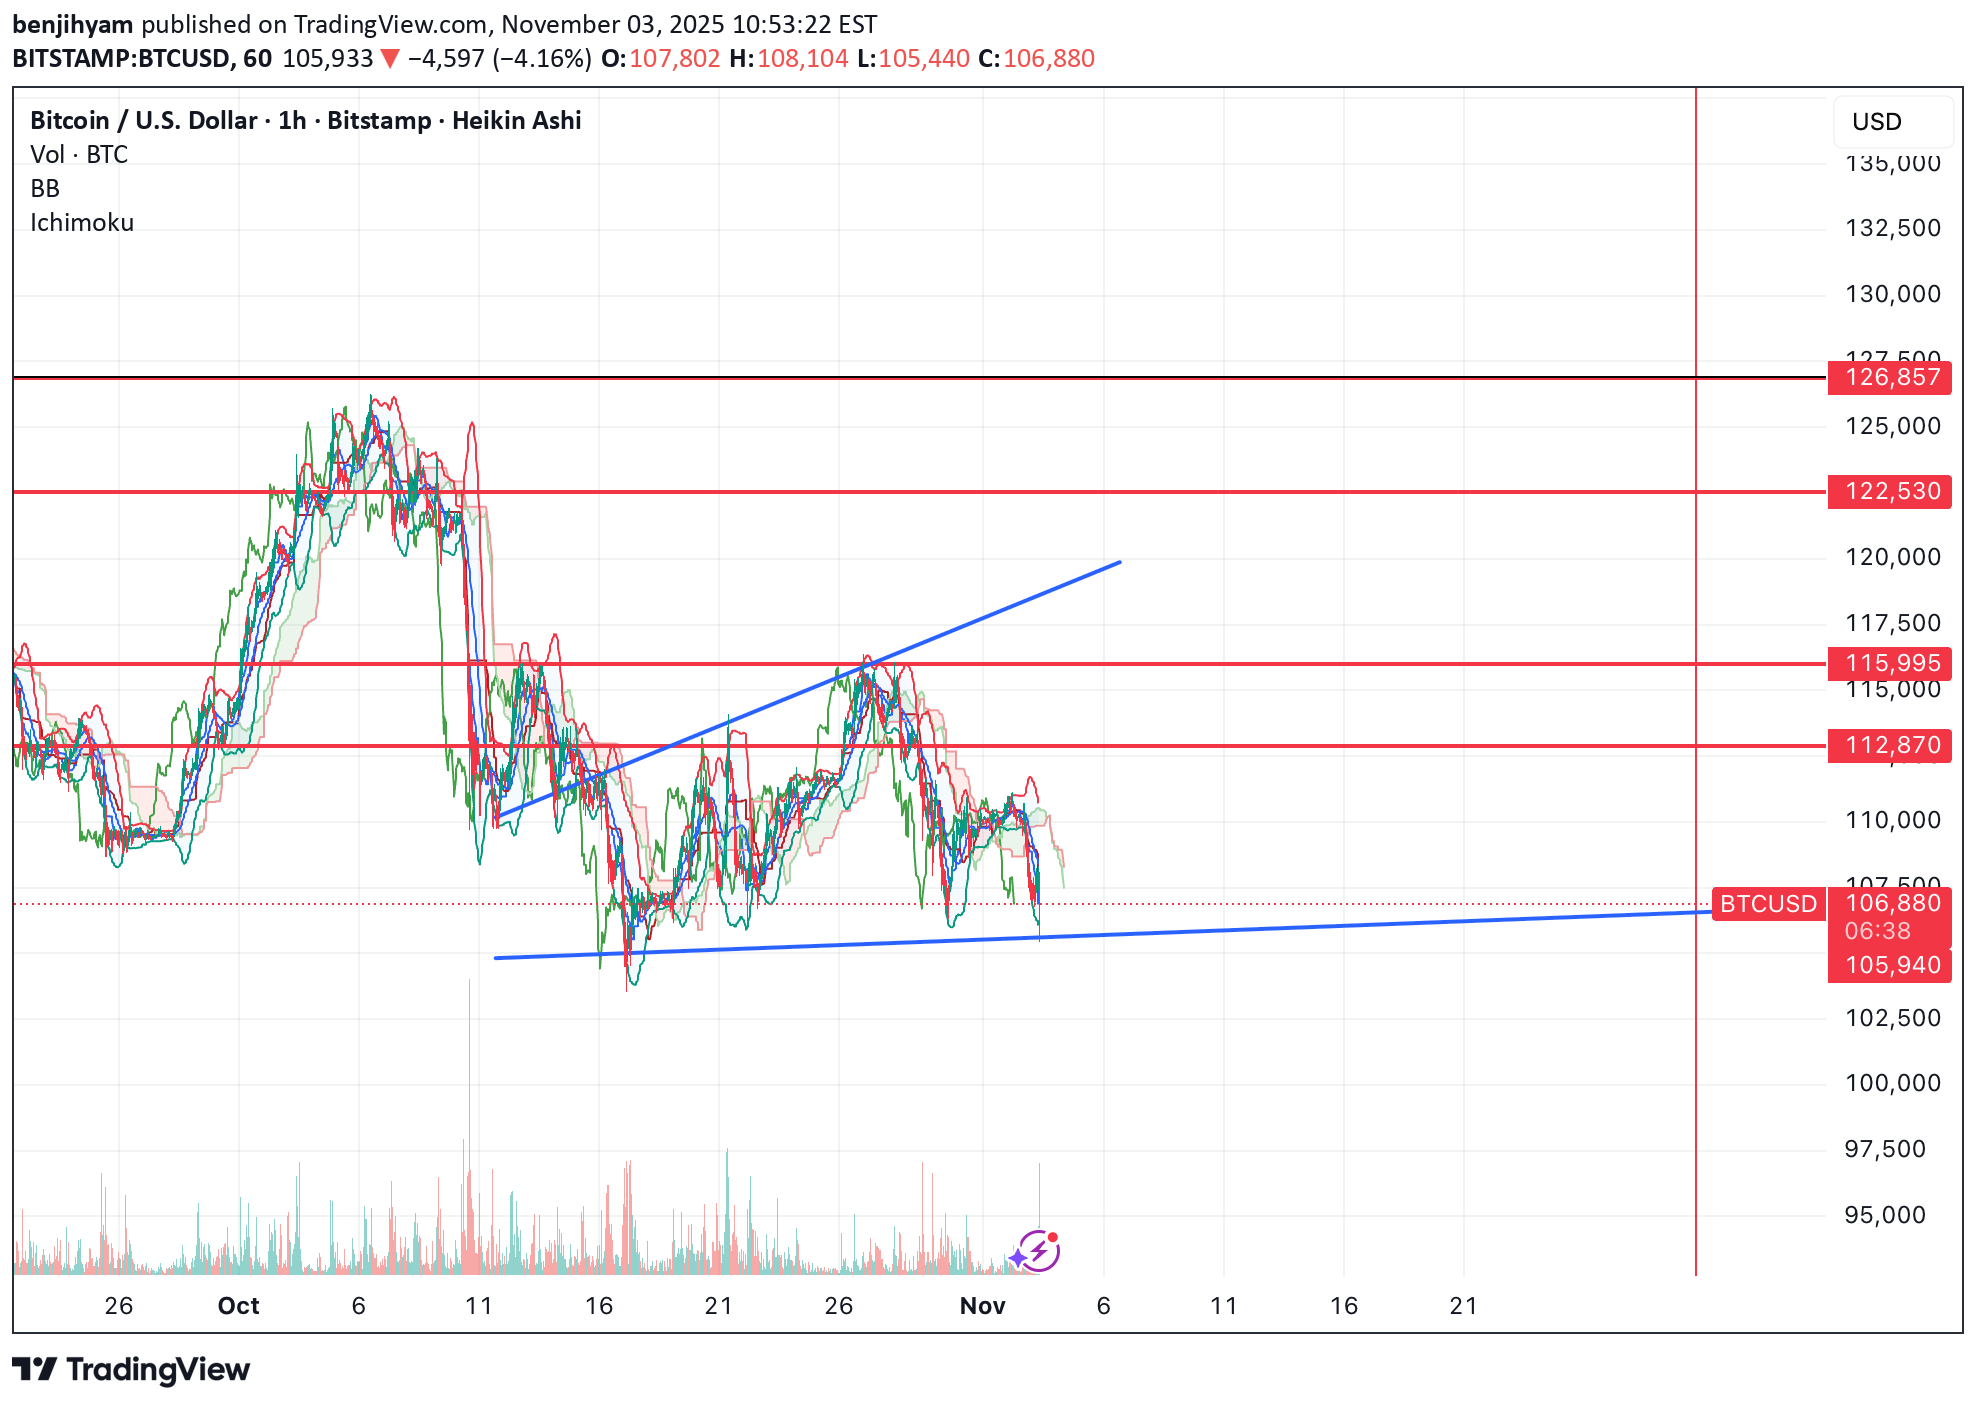
BTC looks like it's bottomed here. Everyone is looking for $98-100k, but I don't think we get it yet. I think it's likely that we bounce towards the upper resistances from here, potentially even seeing a new high up at $126k, or revisiting the $122k region. Let's see how it plays out from here.
benjihyam
آیا $CRCL آماده یک جهش 150 درصدی است؟ تحلیل انفجاری ارز دیجیتال!
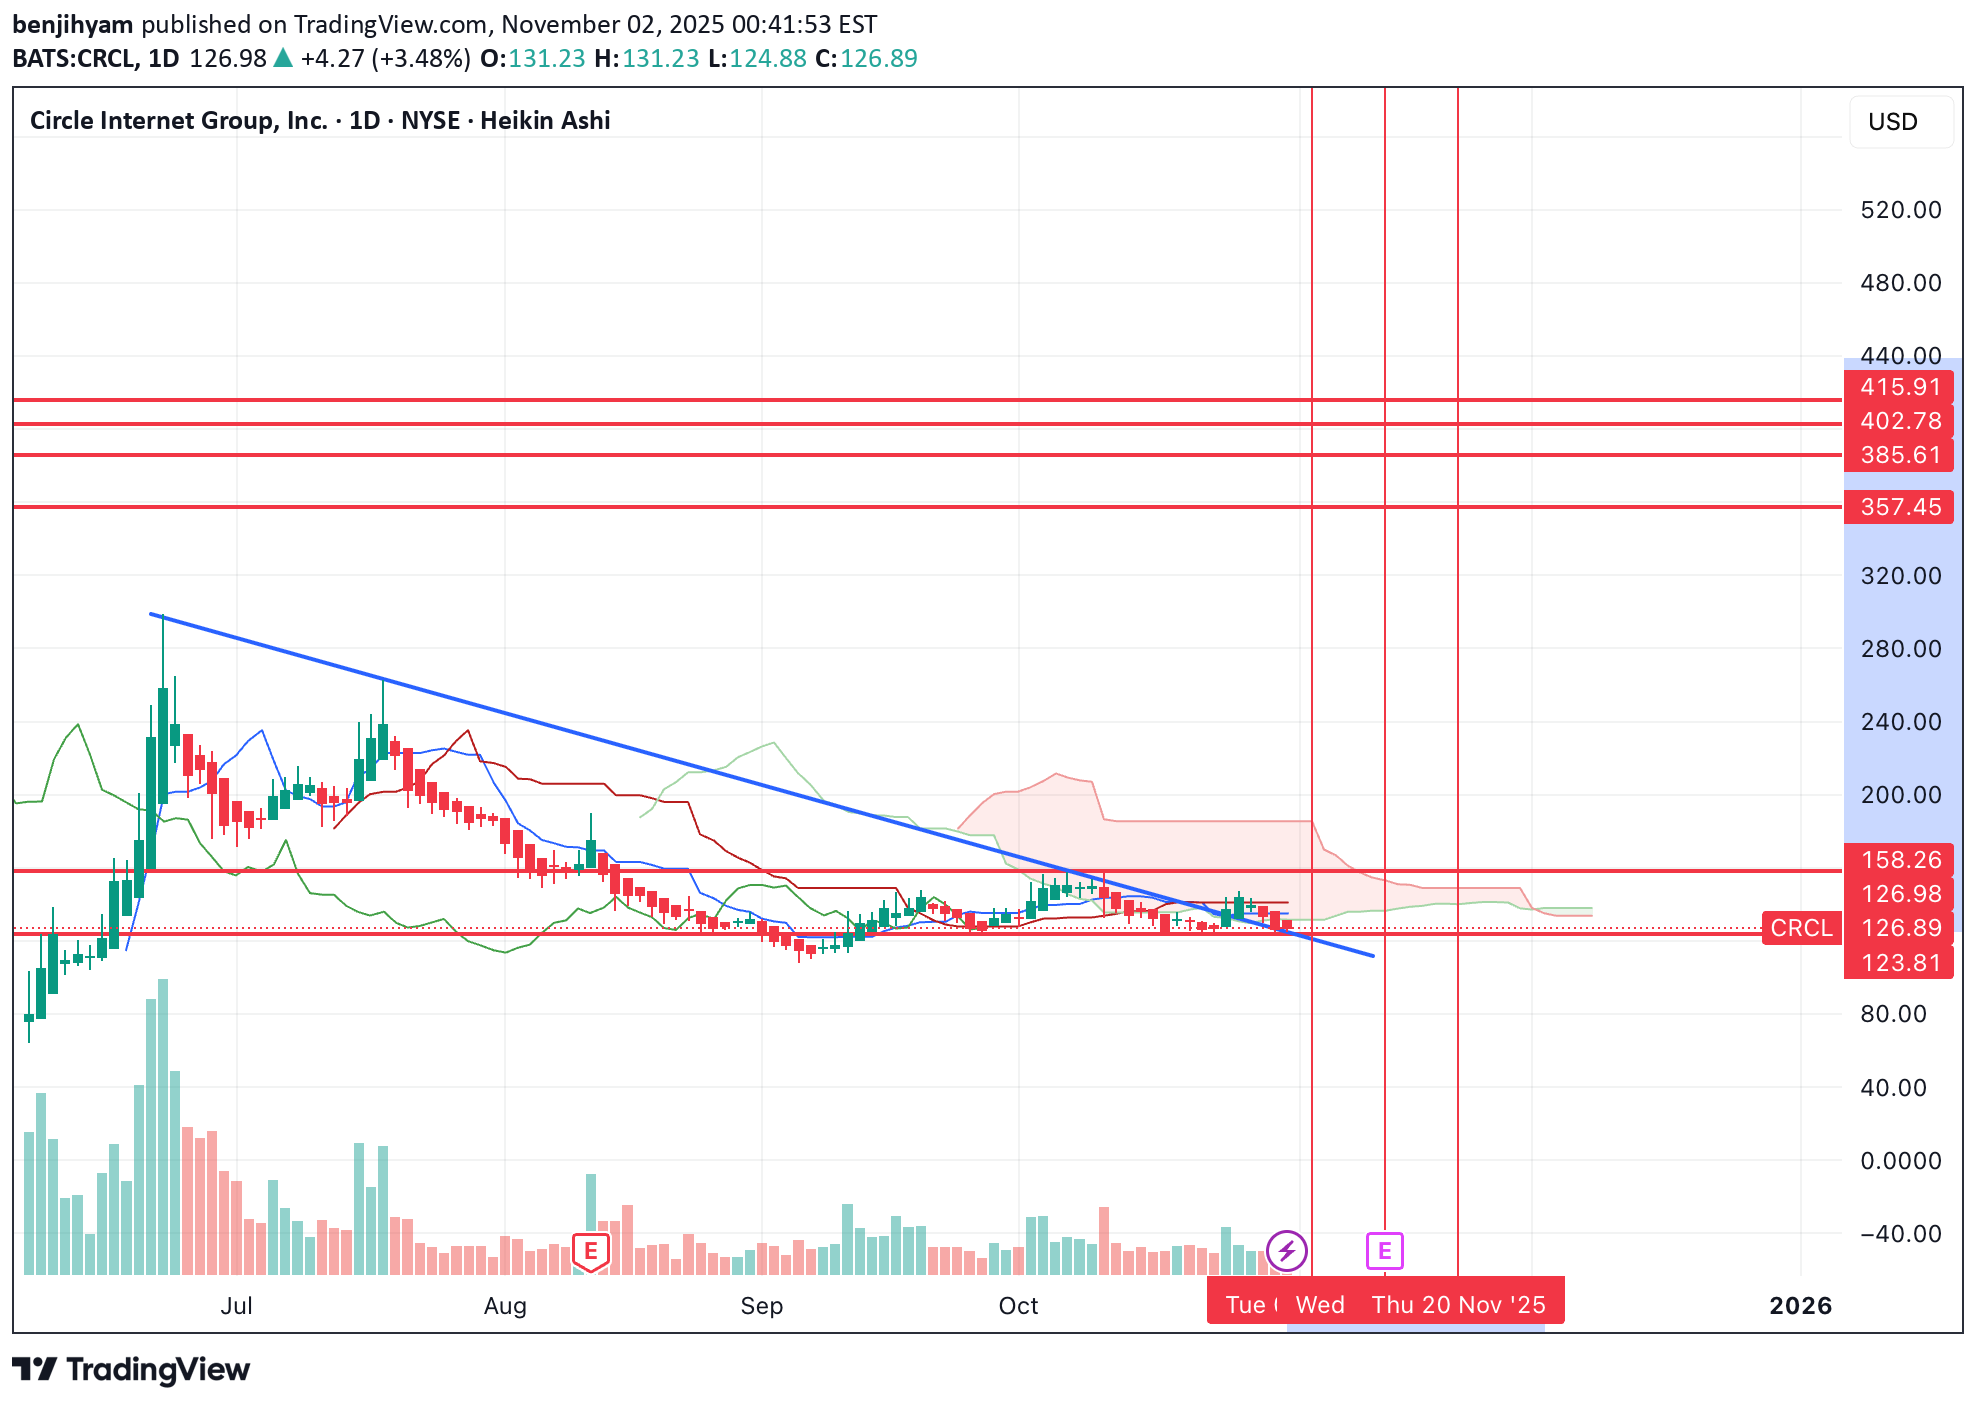
Circle has broken out of a long term downtrend downtrend and has just retested the support. I think we're looking at a large move to the upside from here. Would also coincide with similarities I'm seeing in altcoin charts. I think the bullish move can take us to one of the upper resistances over the coming weeks. Let's see how it plays out.Okay long from here.
benjihyam
benjihyam
تحلیل تکنیکال OP: فرصت خرید بزرگ با پتانسیل سود 2 تا 10 برابری!

Since 2024, OP has been falling inside of a wedge, and it recently broke out and has now backtested it. We've also formed a capitulation low on Oct 6th, and now we look set to make a move higher. I think we could see between a 2x-10x move from here potentially all the way up to the top of the range. Let's see how it plays out over the comings weeks.
benjihyam
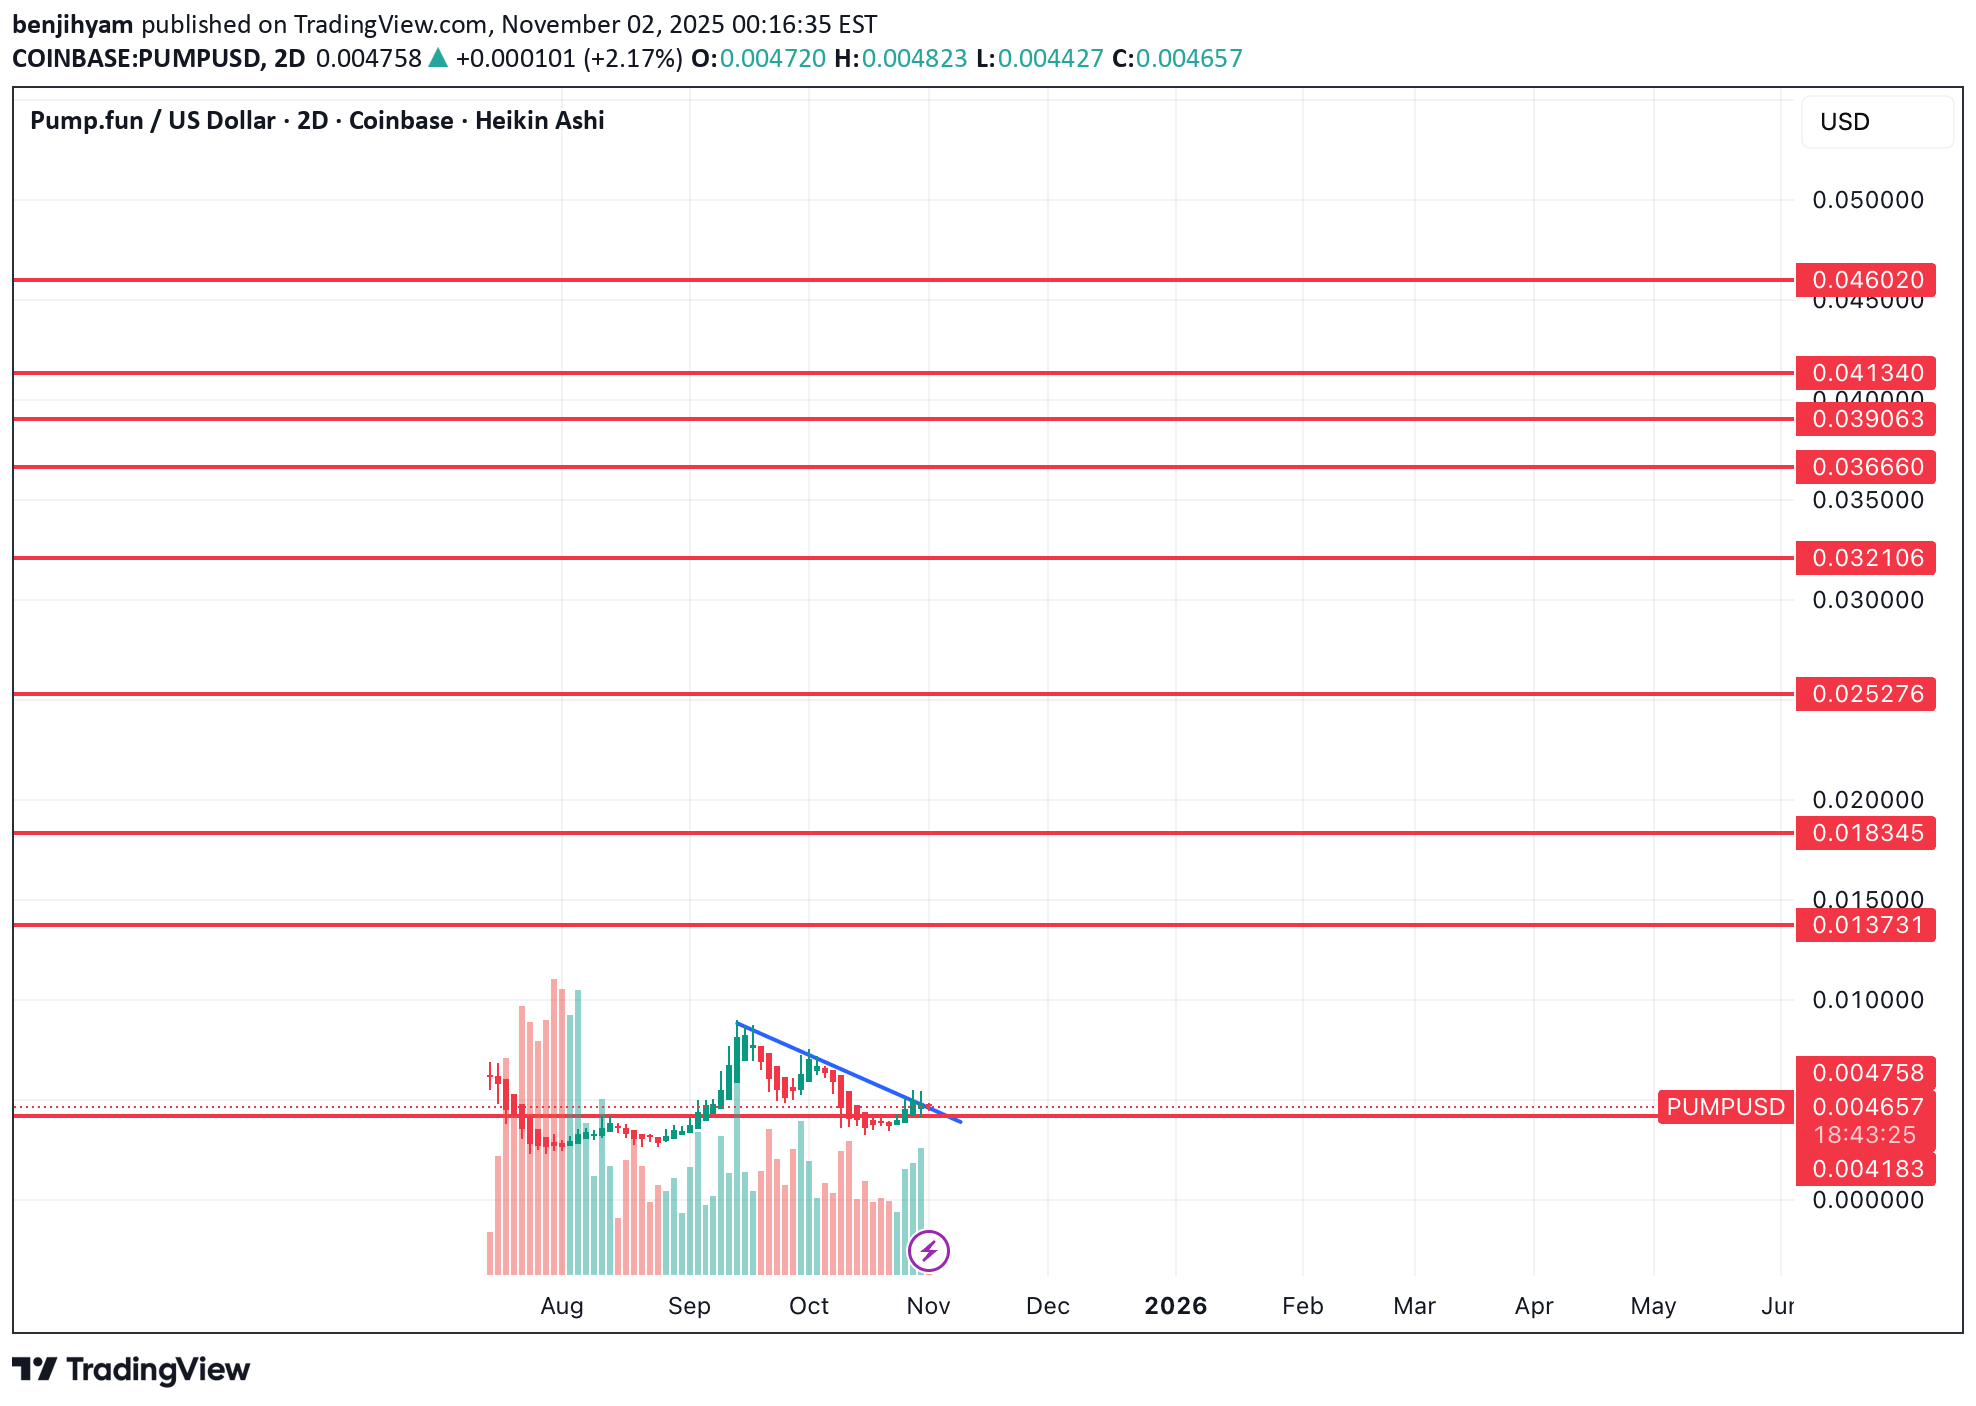
آیا پامپ 200% تا 500% در ارز دیجیتال GIGA در راه است؟ تحلیل تکنیکال شگفتانگیز!
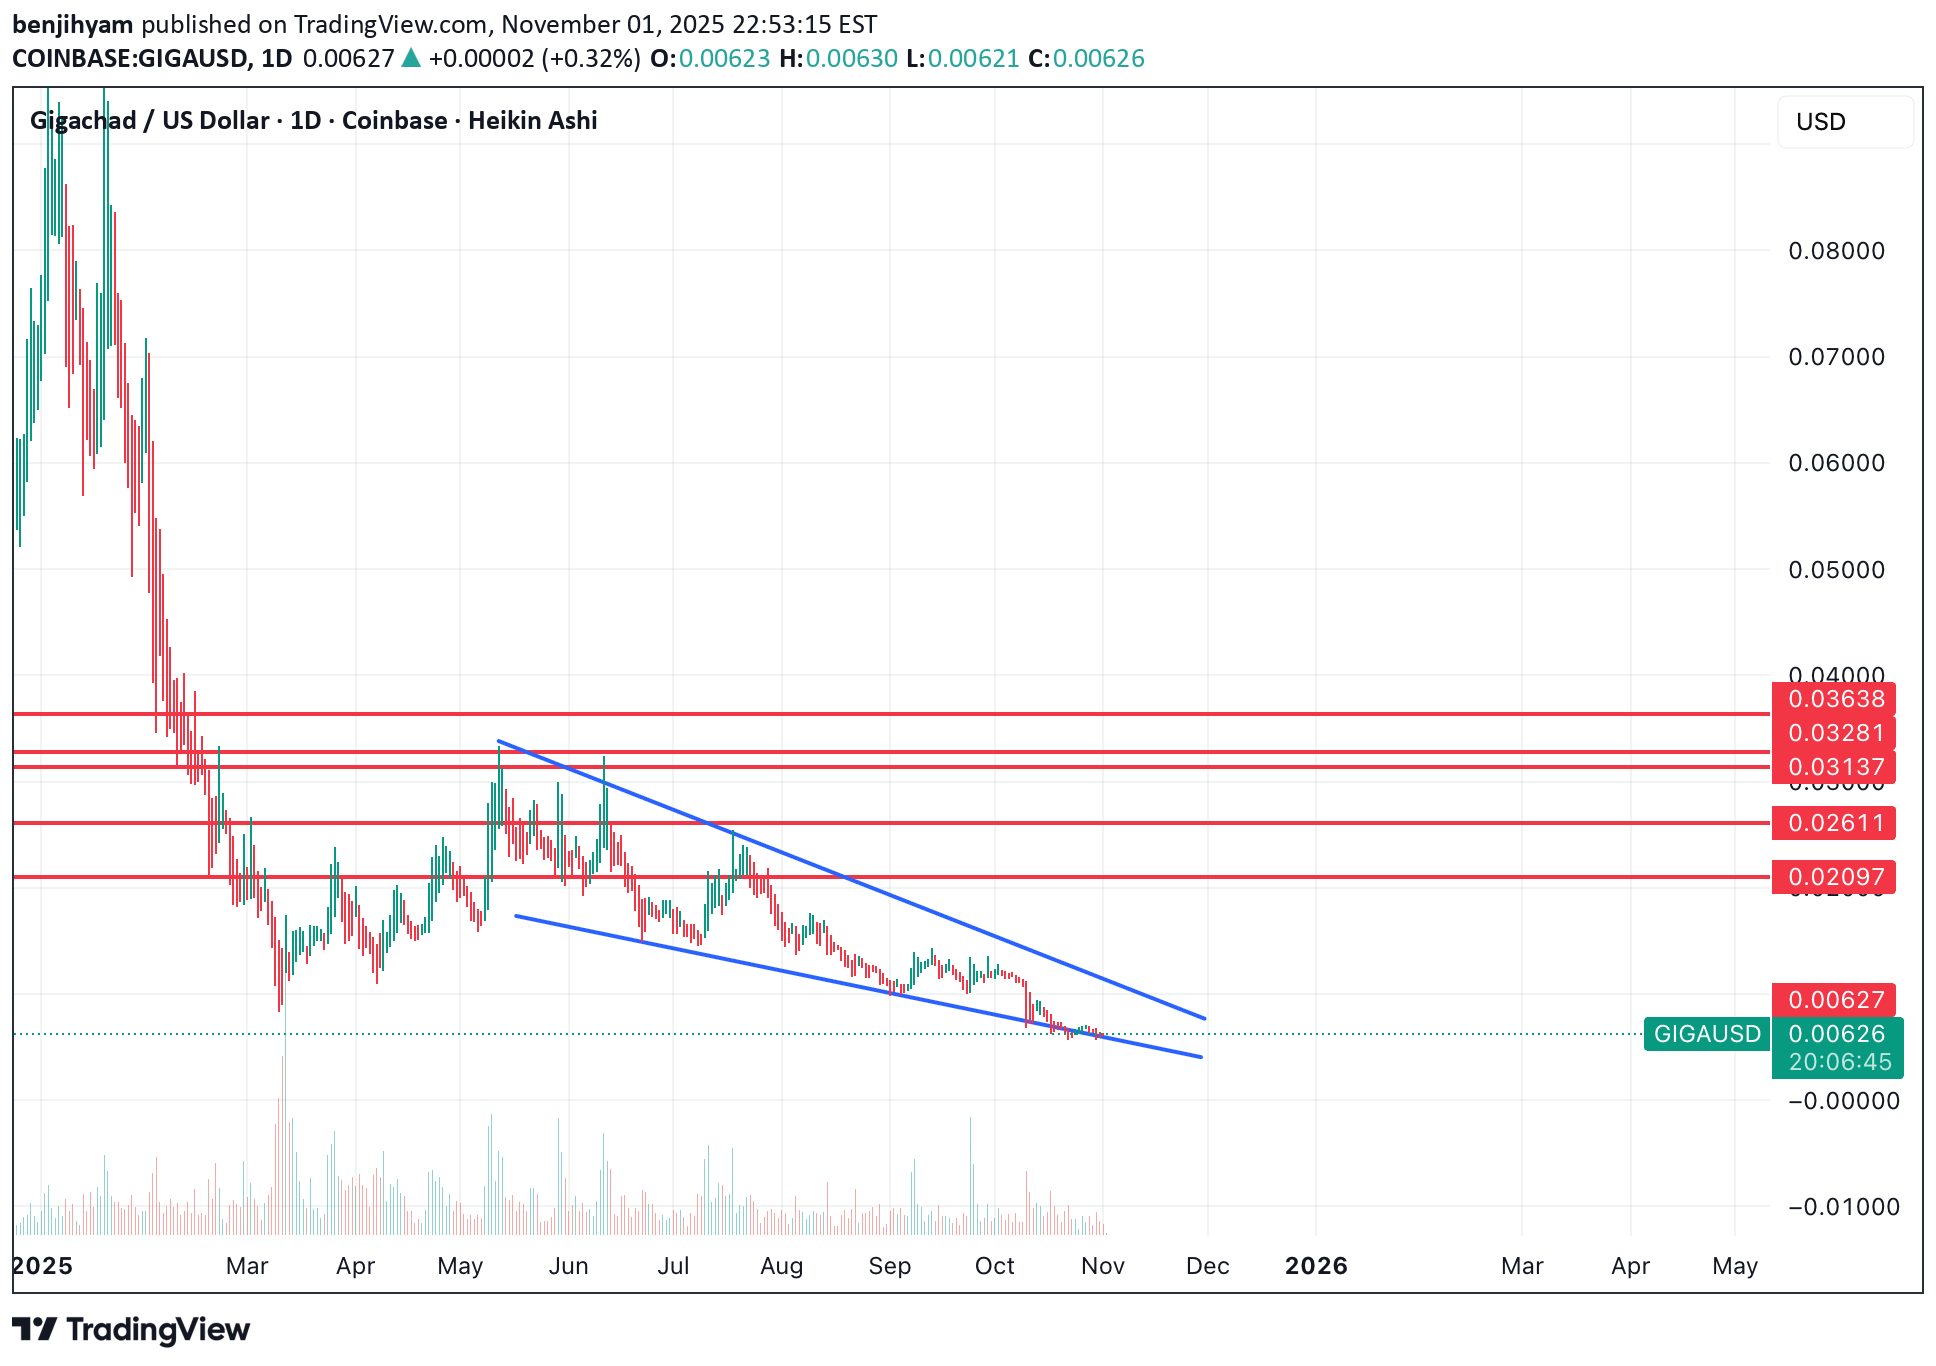
Alts are starting to look really interesting down here. If we look at the chart of Giga, it looks like we've had capitulation and have broken prior lows, however it also looks like a strong bottom/base is forming here and we could be setting up for a larger move higher. We've been consolidating in a falling wedge and the next move at the top of the wedge should break it to the upside. I've marked off key resistance levels that I think we can see a move to, however, I think it's possible we can head to the top resistance. I'm long.
Disclaimer
Any content and materials included in Sahmeto's website and official communication channels are a compilation of personal opinions and analyses and are not binding. They do not constitute any recommendation for buying, selling, entering or exiting the stock market and cryptocurrency market. Also, all news and analyses included in the website and channels are merely republished information from official and unofficial domestic and foreign sources, and it is obvious that users of the said content are responsible for following up and ensuring the authenticity and accuracy of the materials. Therefore, while disclaiming responsibility, it is declared that the responsibility for any decision-making, action, and potential profit and loss in the capital market and cryptocurrency market lies with the trader.