
OKB
OKB
| تریدر | نوع سیگنال | حد سود/ضرر | زمان انتشار | مشاهده پیام |
|---|---|---|---|---|
 TheSignalystRank: 30889 | خرید | حد سود: تعیین نشده حد ضرر: تعیین نشده | 12/16/2025 | |
خرید | حد سود: تعیین نشده حد ضرر: تعیین نشده | 12/11/2025 |

Price Chart of OKB
سود 3 Months :
سیگنالهای OKB
Filter
Sort messages by
Trader Type
Time Frame
TheSignalyst
OKB - Are Bulls About to Flip the Script?
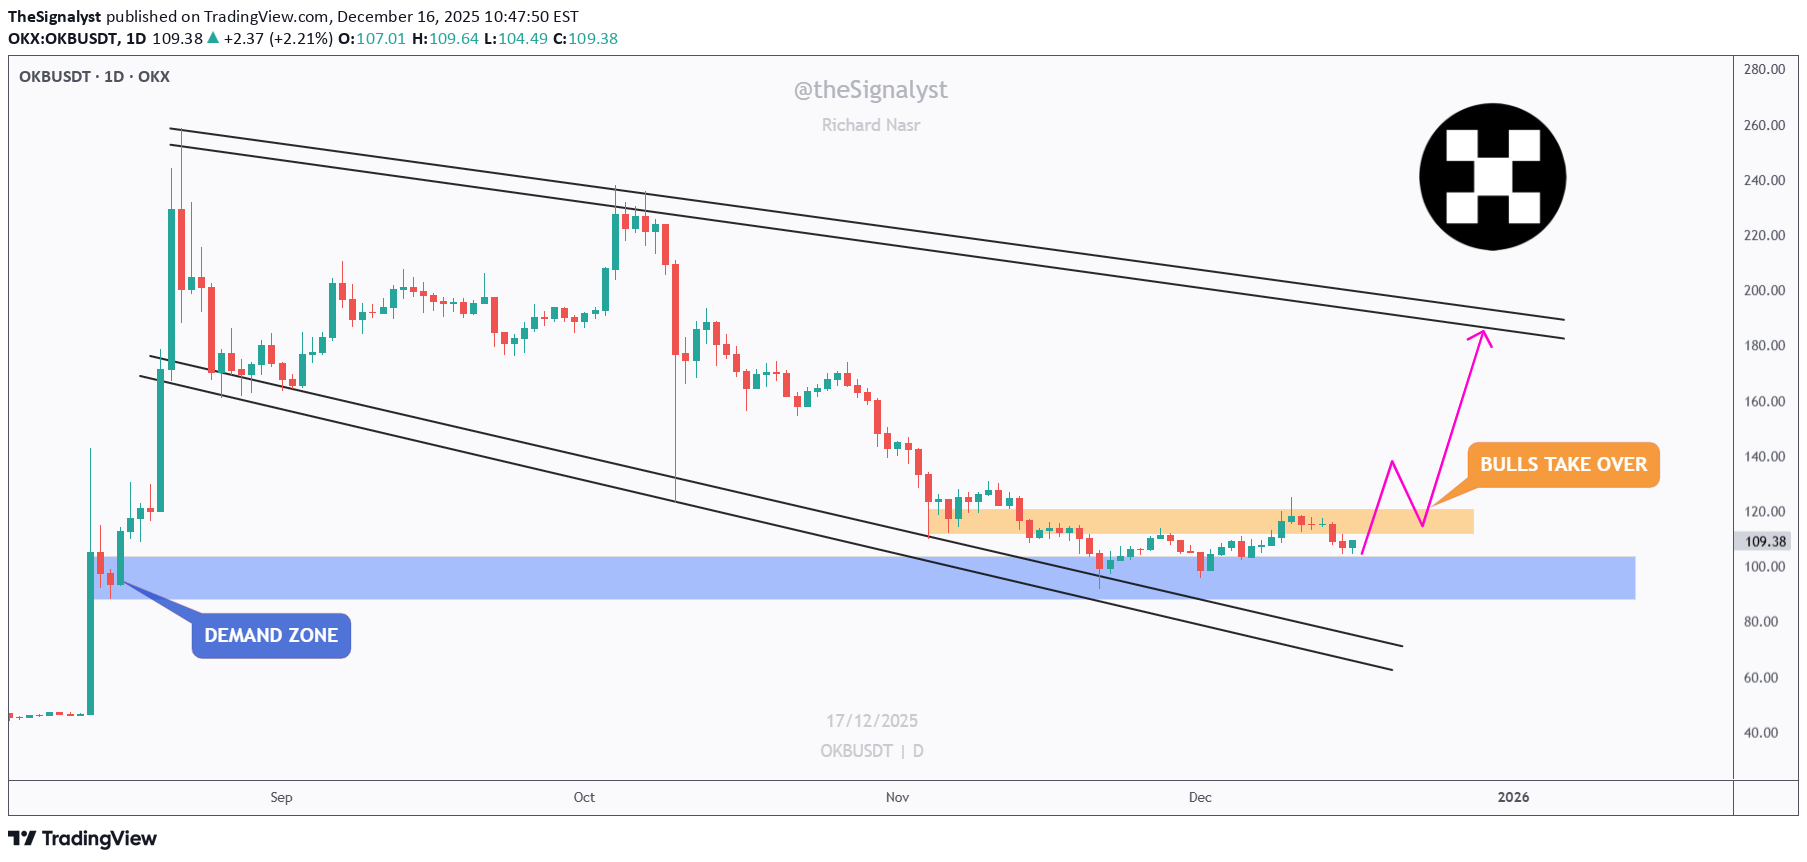
📉After a prolonged corrective phase, OKB is starting to show early signs of structural stabilization. Price has respected the major demand zone, where selling pressure slowed down and downside momentum clearly weakened. ⚔️What stands out now is the tight consolidation above demand, combined with a gradual reclaim of higher levels. This type of behavior often signals a shift from distribution to accumulation, especially after a long bearish channel. 📍The key focus is the orange resistance band. A clean break and hold above this area would be a strong confirmation that bulls are taking control, opening the door for a larger recovery move toward the upper bounds of the broader structure.🏹 Until that breakout happens, patience is key. Let price prove strength before committing aggressively. But structurally, this is one of those zones where risk starts favoring the upside, not the downside. Is this the quiet phase before expansion? 🤔 ⚠️ Disclaimer: This is not financial advice. Always do your own research and manage risk properly. 📚 Stick to your trading plan regarding entries, risk, and management. Good luck! 🍀 All Strategies Are Good; If Managed Properly! ~Richard Nasr
Bear Flag Formation — Downside Continuation Toward 91–88
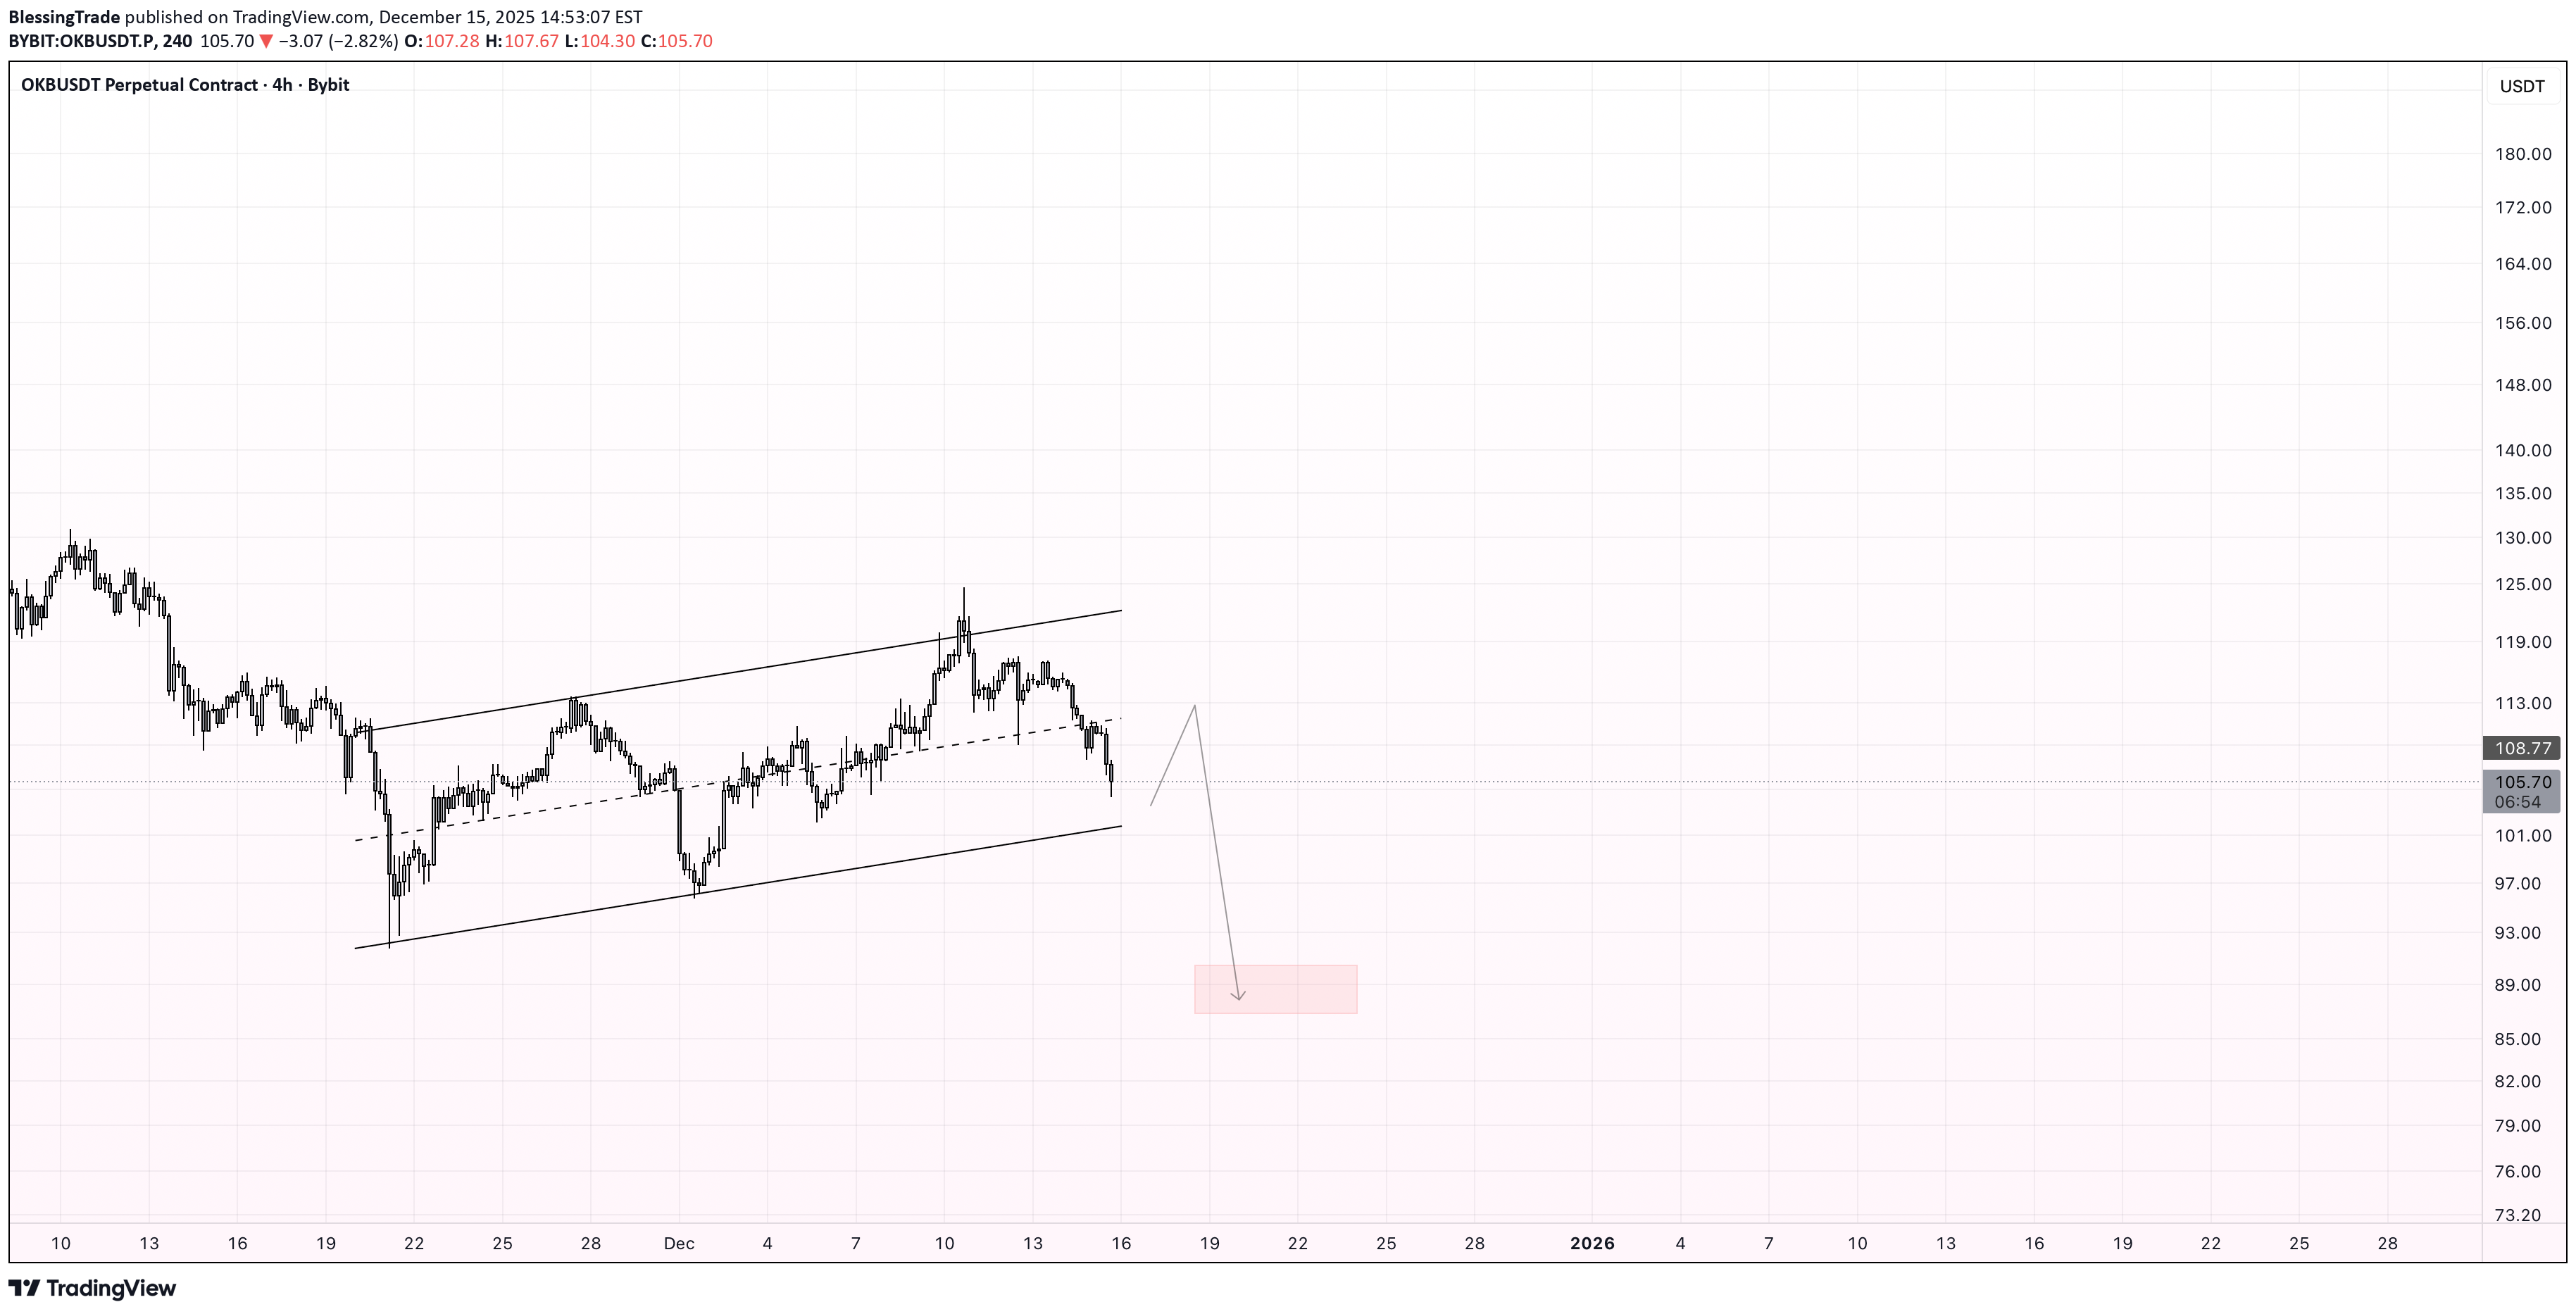
A clear bear flag has formed after a strong impulsive bearish move. Price is currently consolidating inside an ascending corrective channel, which typically represents a pause before trend continuation rather than a reversal. After this corrective bounce, I expect a breakdown below the lower boundary of the flag and continuation of the bearish trend. The measured move of the pattern suggests a downside target in the 91–88 zone, which also aligns with a potential demand/support area. The bearish scenario remains valid as long as price stays below the upper boundary of the flag. A decisive breakdown with momentum would confirm the setup.beaarrr run!!!
OKB/USDT Chart Analysis 11-Dec-25
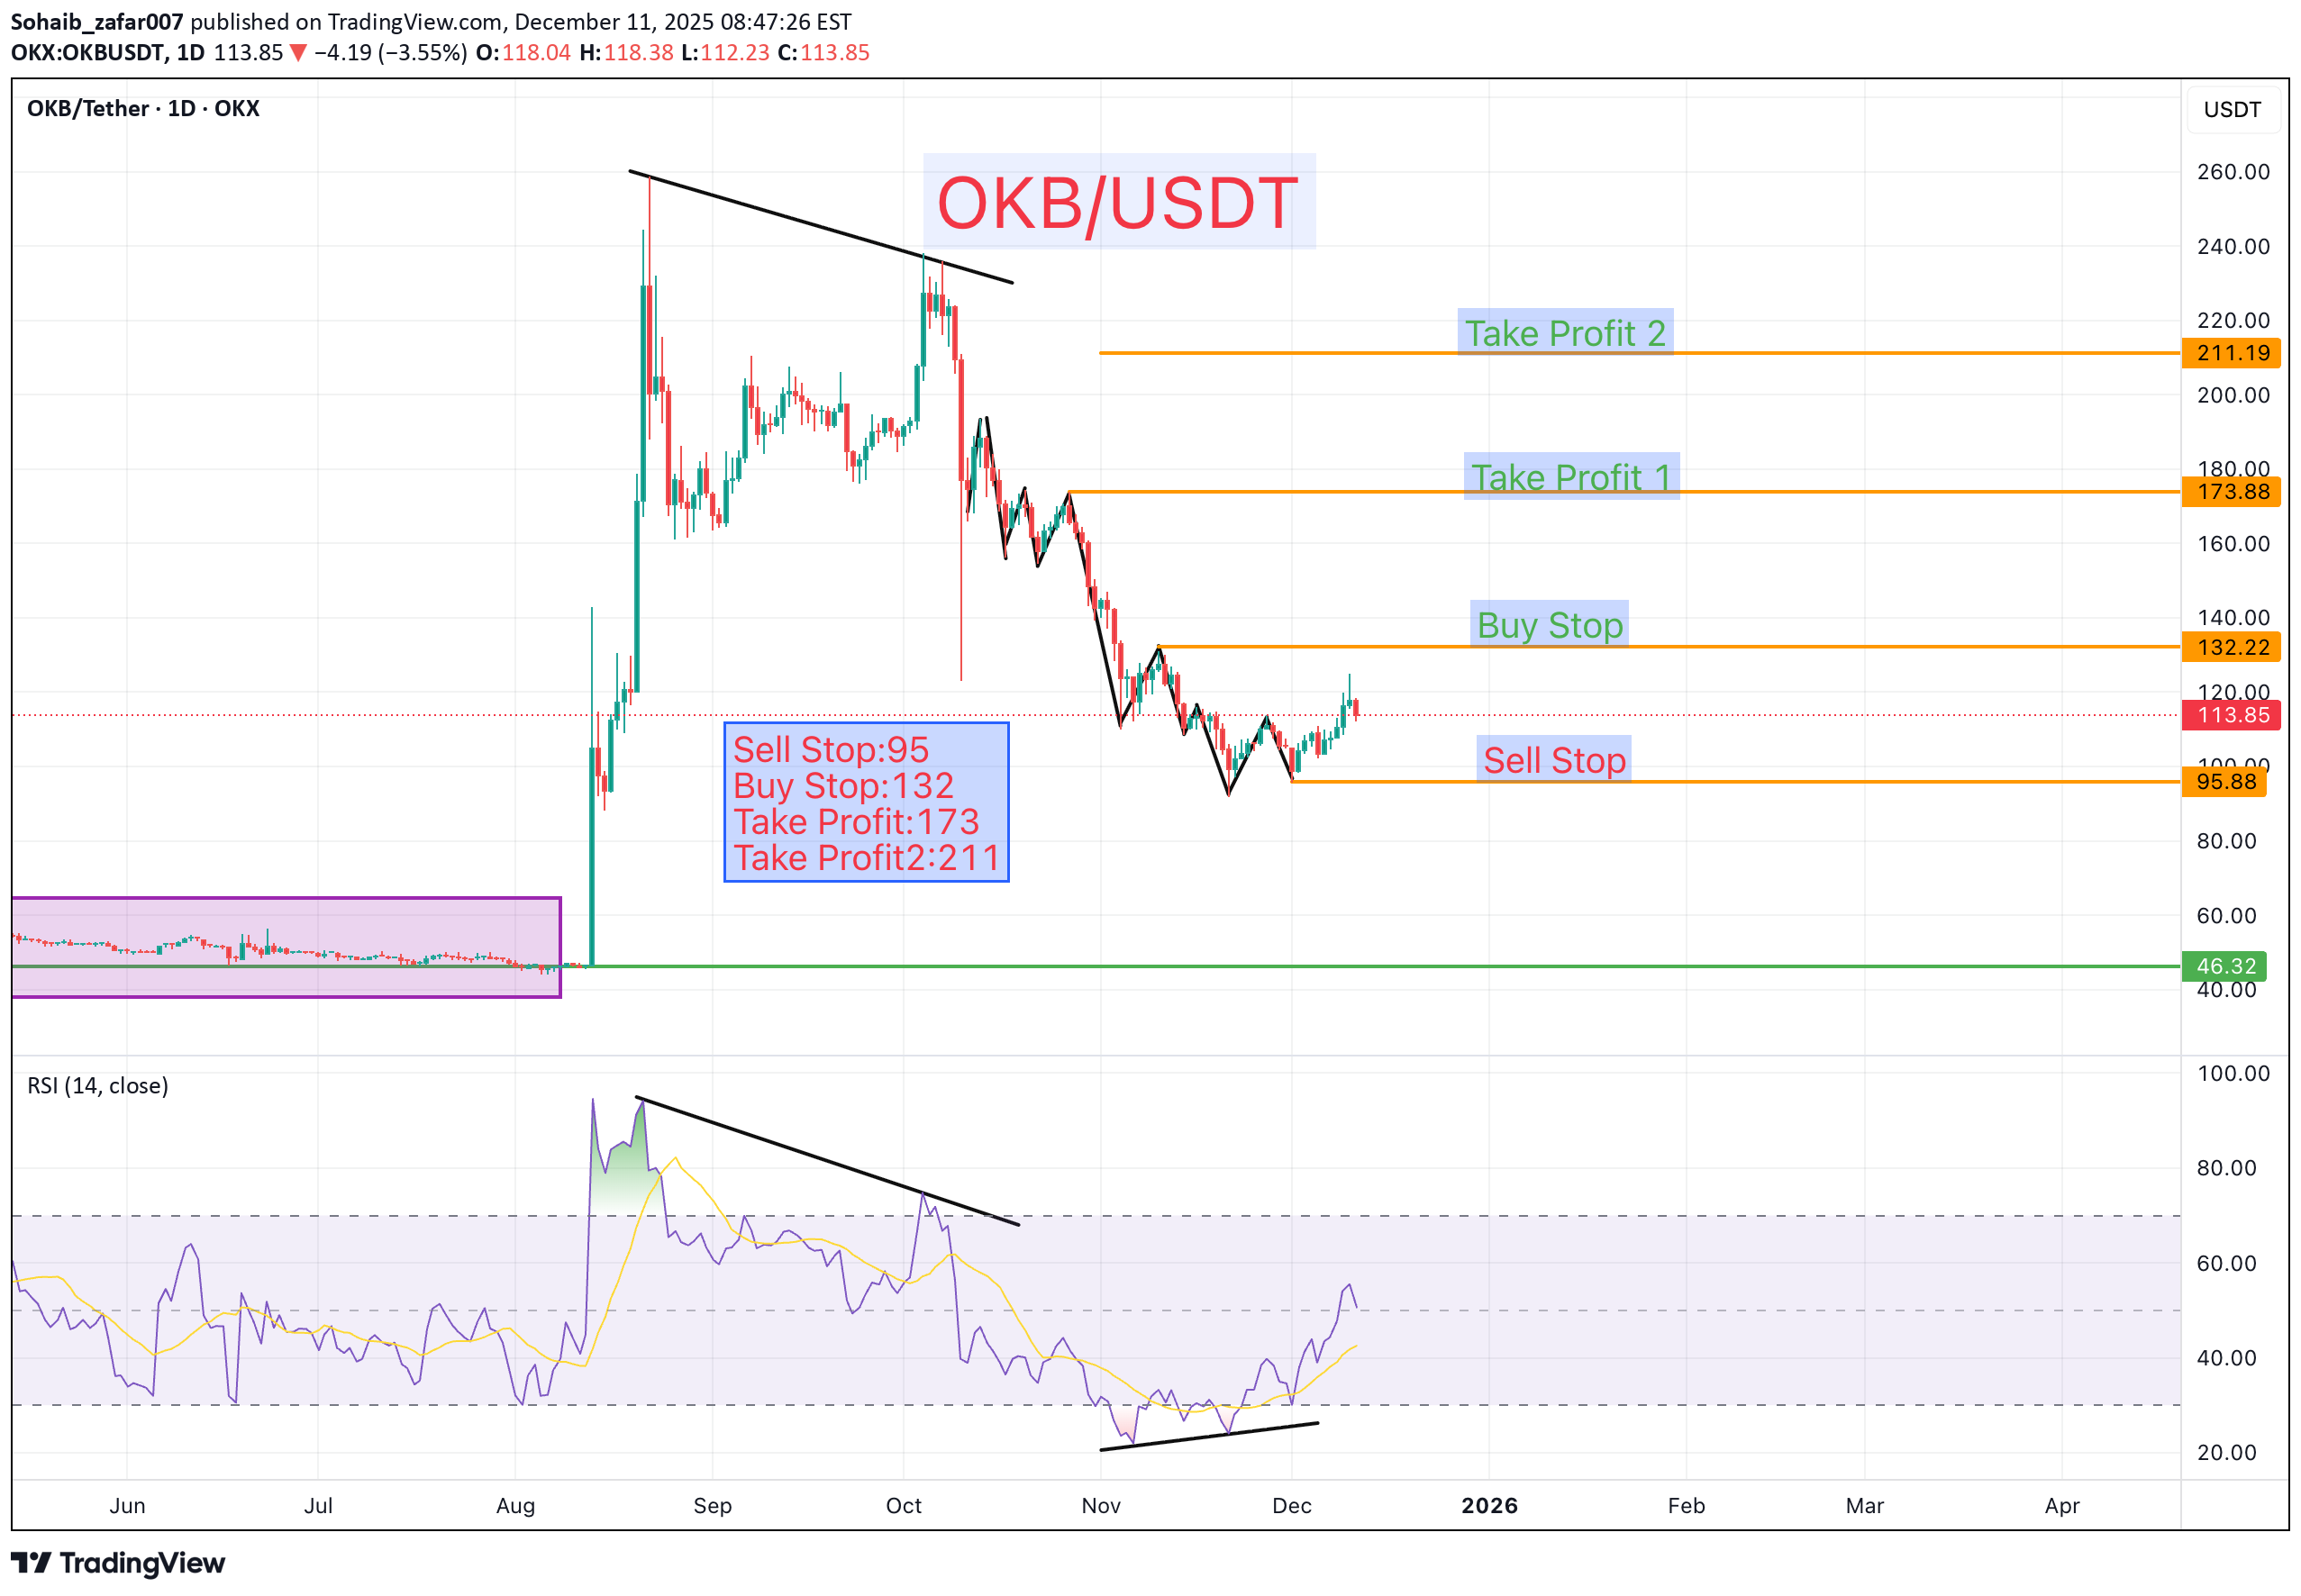
Sell Stop: 95 Buy Stop: 132 Take Profit 1: 173 Take Profit 2: 211 Following the recent bearish trend, a clear RSI divergence has formed, indicating weakening downside momentum. This divergence, combined with price structure, suggests a potential shift in market direction. The trend now appears to be transitioning into a bullish phase, and a continuation to the upside is expected if price sustains above the Buy Stop level. ⚠️ Always remember to safeguard your capital with a well-placed stop-loss and disciplined risk management.
TheSignalyst
حمایت قوی OKB در آستانه اصلاح؟ فرصت خرید در محدوده کلیدی!
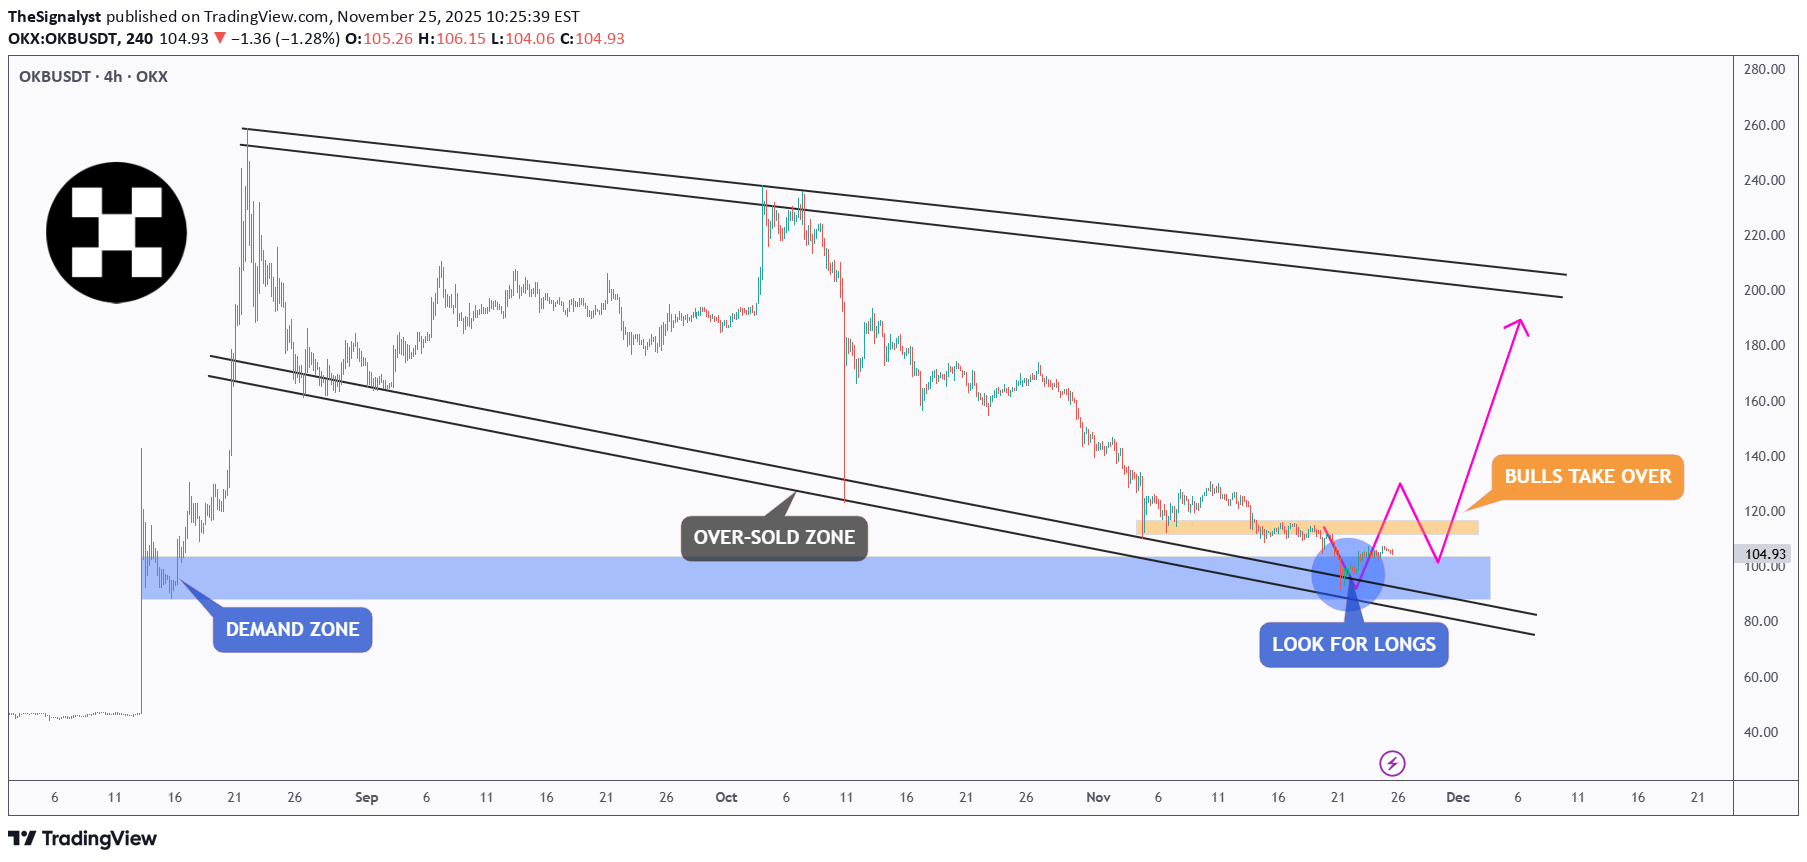
📉OKB is currently trading inside a broad falling channel , but price has just reacted from a major demand zone, which also aligns with the lower bound of the black channel. This confluence creates a strong oversold area where buyers typically step in. ⚔️As long as this demand zone continues to hold, we will be looking for bullish correction setups toward the upper bound of the falling channel. This would be the natural corrective wave after an extended sell-off. 🏹However, for the bulls to fully confirm control, price must break and hold above the orange high. A breakout above that structure would signal a shift in momentum and open the way for a larger trend reversal. For now, demand is holding, the channel is intact, and the market is positioned for a potential rebound… will OKB deliver the correction we’re waiting for? 🤔 ⚠️ Disclaimer: This is not financial advice. Always do your own research and manage risk properly. 📚 Stick to your trading plan regarding entries, risk, and management. Good luck! 🍀 All Strategies Are Good; If Managed Properly! ~Richard Nasr
TheSignalyst
OKB وارد منطقه اشباع فروش شد: آیا زمان خرید و جهش بزرگ فرا رسیده است؟

📉OKB has been steadily correcting within a descending channel , but the price is now approaching a massive confluence area, the intersection of the blue demand zone, lower black trendline, and the oversold region. ⚔️This area has historically acted as a strong accumulation zone, where buyers tend to step back in and drive the next impulsive wave. From here, I’ll be looking for long opportunities, ideally after a clear bullish confirmation or a break above the short-term red channel. 🏹If the bulls manage to defend this zone, we could see a strong push toward the upper bound of the black channel, around the $200 mark. ⚠️ Disclaimer: This is not financial advice. Always do your own research and manage risk properly. 📊All Strategies Are Good; If Managed Properly! ~Richard Nasr

pullbacksignal
سیگنال فروش داغ OKB/USDT: تحلیل تکنیکال کامل و نقاط ورود/خروج قطعی!

İşlem Kurulumu: OKBUSDT OKB'de (Vadeli İşlemler) bir İşlem Sinyali görülüyor (4 saat) İşlemciler Satış İşlemlerini ŞİMDİ açabilirler. ⬇️ Şimdi veya 176,0'dan sat ⭕️SL @ 195,0 🔵TP1 @ 140,0 🔵TP2 @ 126,0 🔵TP3 @ 101,0 Bu sinyaller neye dayanıyor? Klasik Teknik Analiz Fiyat Hareketi Mum Grafikleri Fibonacci RSI, Hareketli Ortalama, Ichimoku, Bollinger Bantları Risk Uyarısı Forex, CFD, Kripto, Vadeli İşlemler ve Hisse Senetleri ticareti kayıp riski içerir. Bu tür bir yatırımın sizin için uygun olup olmadığını lütfen dikkatlice değerlendirin. Geçmiş performans, gelecekteki sonuçların göstergesi değildir. Fikirlerimizi beğendiyseniz, lütfen beğenileriniz 👍 ve yorumlarınızla bizi destekleyin.
pullbacksignal
سیگنال فروش فوری OKB/USDT: تحلیل تکنیکال، نقاط ورود و خروج دقیق

Trading Setup: A Trading Signal is seen in the OKBUSDT OKB (Futures) (4h) Traders can open their Sell Trades NOW ⬇️ Sell now or sell on 176.0 ⭕️SL @ 195.0 🔵TP1 @ 140.0 🔵TP2 @ 126.0 🔵TP3 @ 101.0 What are these signals based on? Classical Technical Analysis Price Action Candlesticks Fibonacci RSI, Moving Average , Ichimoku , Bollinger Bands Risk Warning Trading Forex, CFDs, Crypto, Futures, and Stocks involve a risk of loss. Please consider carefully if such trading is appropriate for you. Past performance is not indicative of future results. If you liked our ideas, please support us with your likes 👍 and comments .

WaveRiders2
تحلیل فوری OKB: آیا موج صعودی جدید آغاز میشود؟


tomas_jntx
OKB/USD – Weak Below SMA200
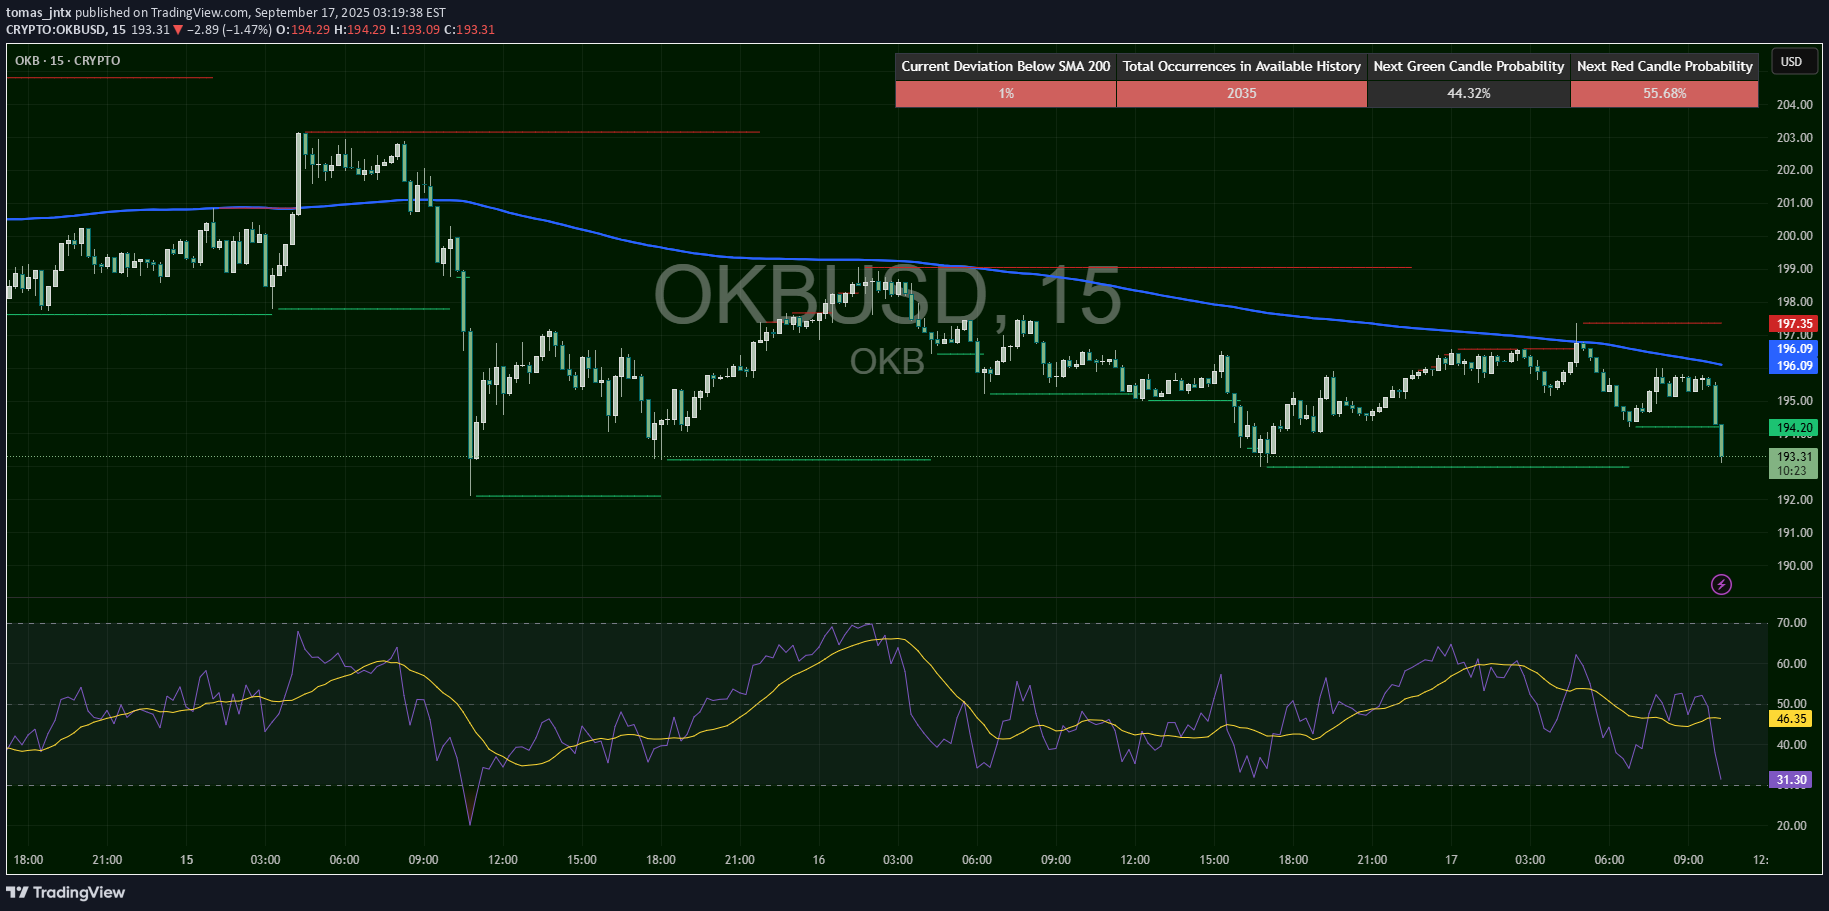
🔴 SHORT below $196 – target $192 OKB trades at $194, stuck below SMA200 ($196). Resistance: $196–197.5, support: $192–193. RSI at 36, weak momentum. Bears in control as long as price stays under $196. 📖 Keywords: #OKBUSD #OKX #CryptoResistance #BearishSetup
tomas_jntx
OKB/USD – Approaching Local Top
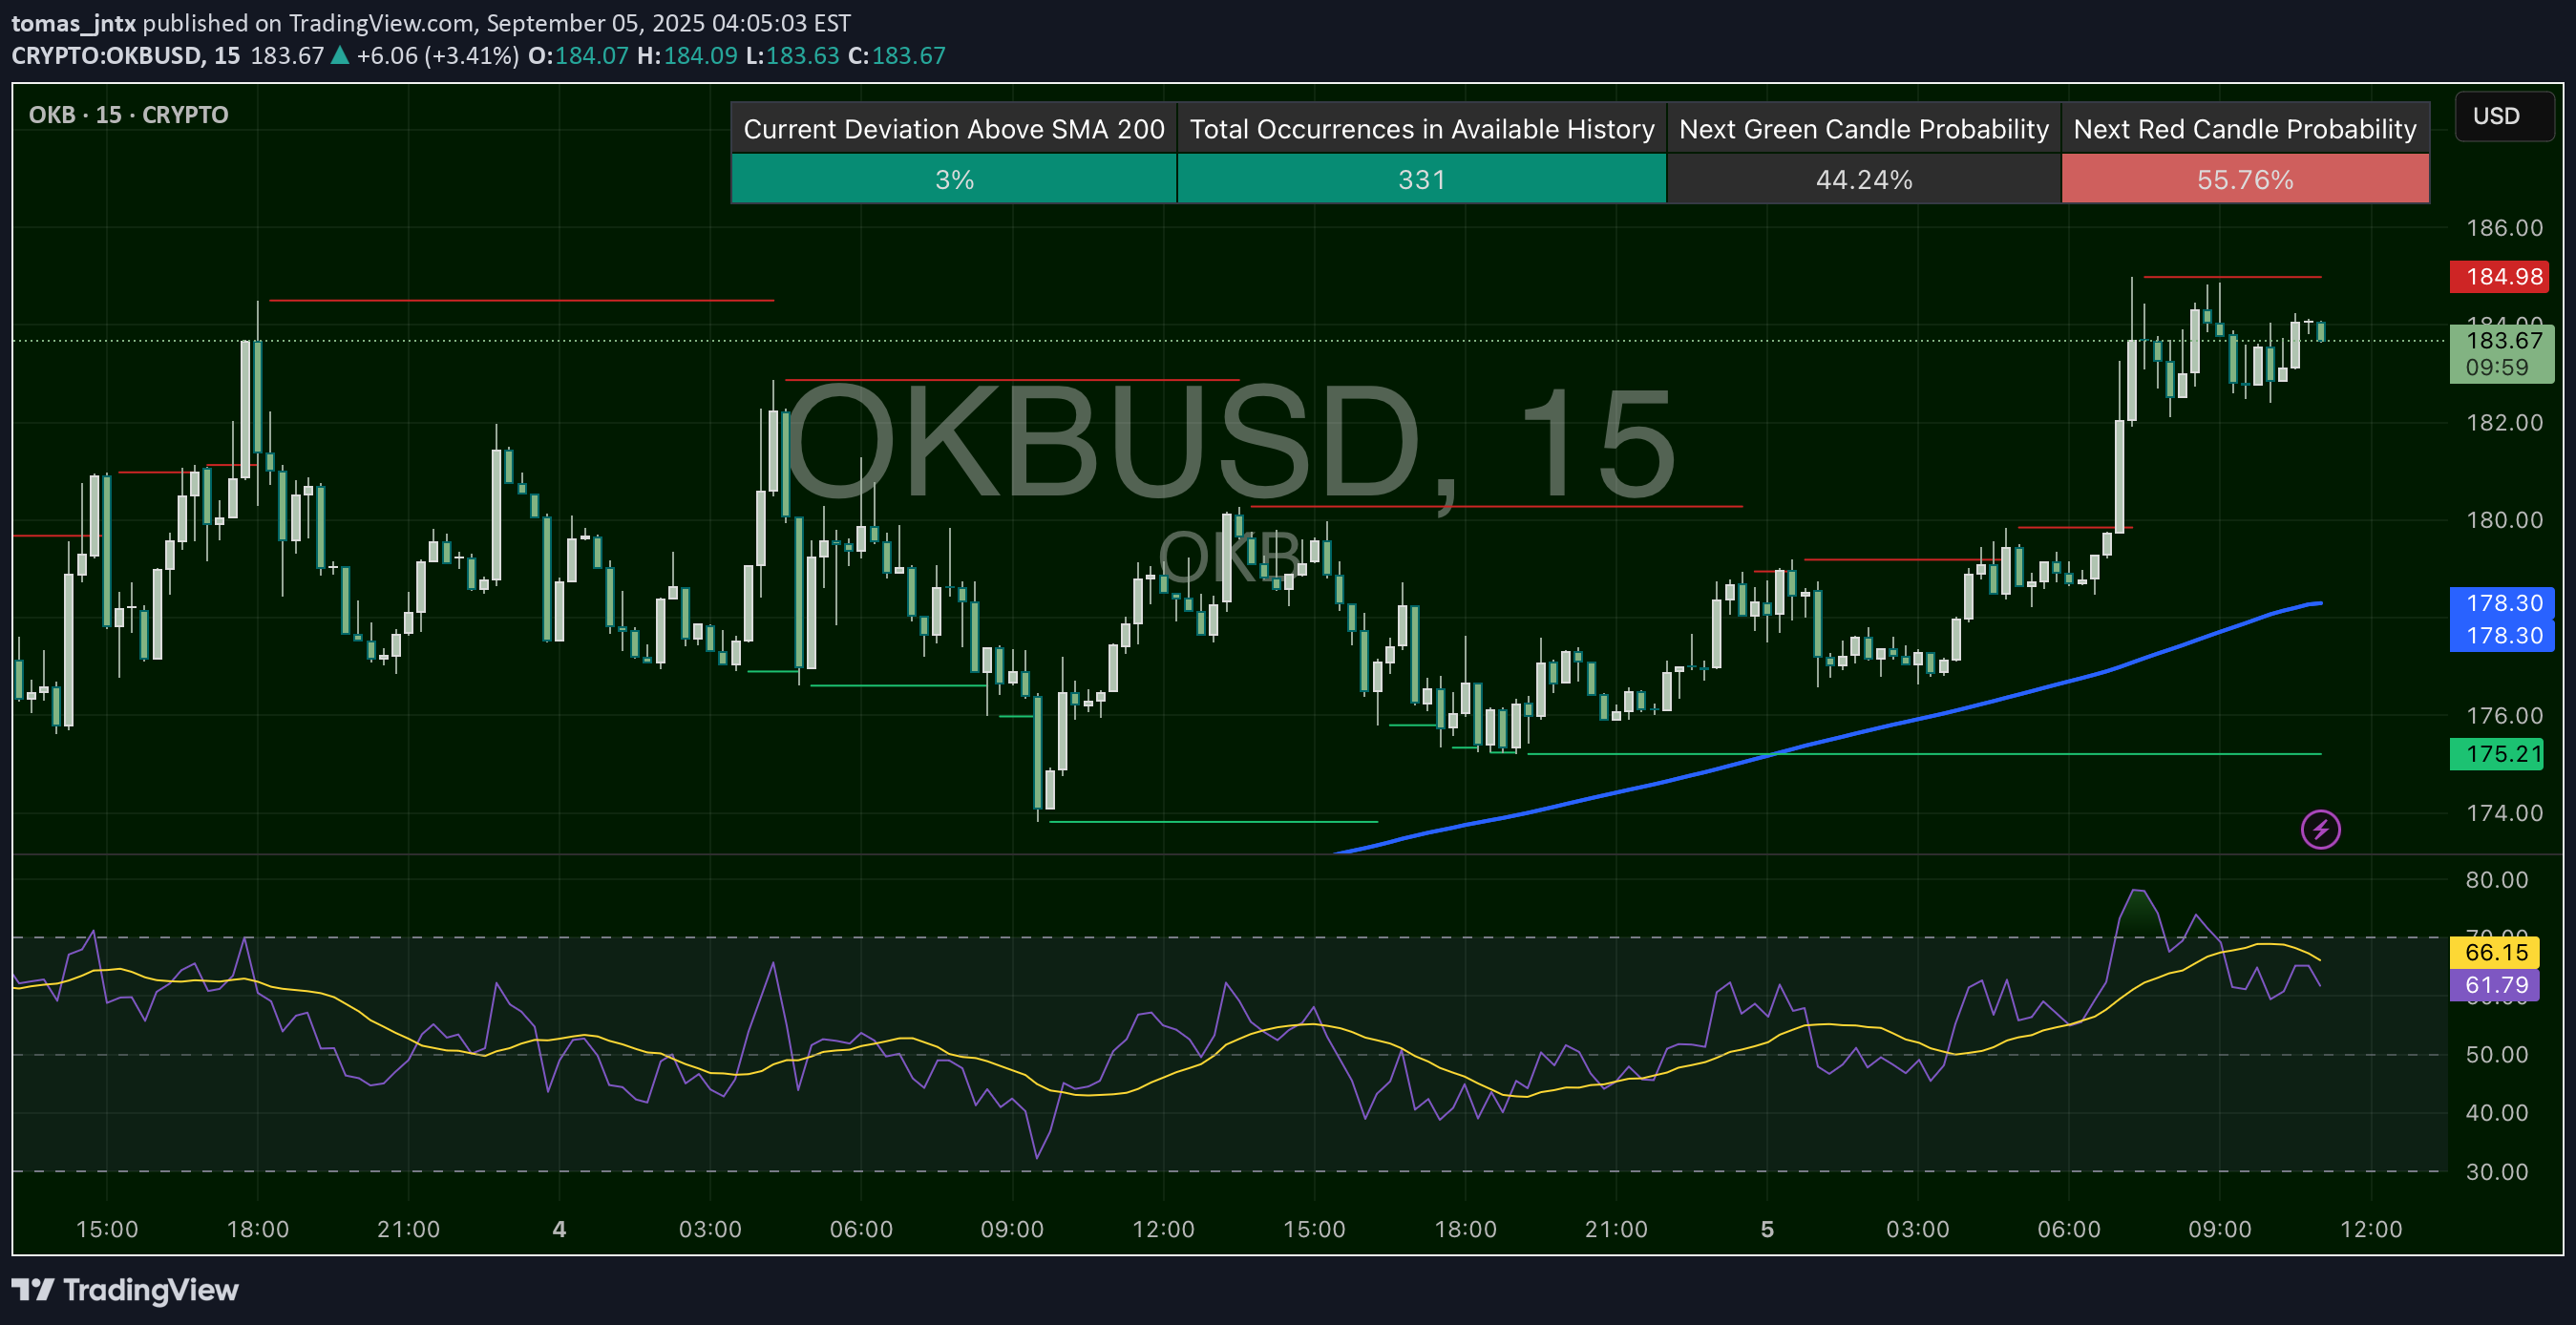
🔴 SHORT below $178.27 – target $175.21 OKB trades at $184.10, well above the 200 SMA ($178.27). Resistance at $184.98, support at $175.21. RSI at 67 signals overbought risk. If $185 fails to break cleanly, downside back to SMA200 is on the table. 📊 Keywords: #OKBUSD #OKB #CryptoShort #AltcoinWatch #ResistanceLevel
Disclaimer
Any content and materials included in Sahmeto's website and official communication channels are a compilation of personal opinions and analyses and are not binding. They do not constitute any recommendation for buying, selling, entering or exiting the stock market and cryptocurrency market. Also, all news and analyses included in the website and channels are merely republished information from official and unofficial domestic and foreign sources, and it is obvious that users of the said content are responsible for following up and ensuring the authenticity and accuracy of the materials. Therefore, while disclaiming responsibility, it is declared that the responsibility for any decision-making, action, and potential profit and loss in the capital market and cryptocurrency market lies with the trader.