
NTRN
Neutron
| تریدر | نوع سیگنال | حد سود/ضرر | زمان انتشار | مشاهده پیام |
|---|---|---|---|---|
No results found. | ||||
Price Chart of Neutron
سود 3 Months :
سیگنالهای Neutron
Filter
Sort messages by
Trader Type
Time Frame

Strateg_
افشای پتانسیل انفجاری NTRN: سود 200 درصدی در انتظار است!
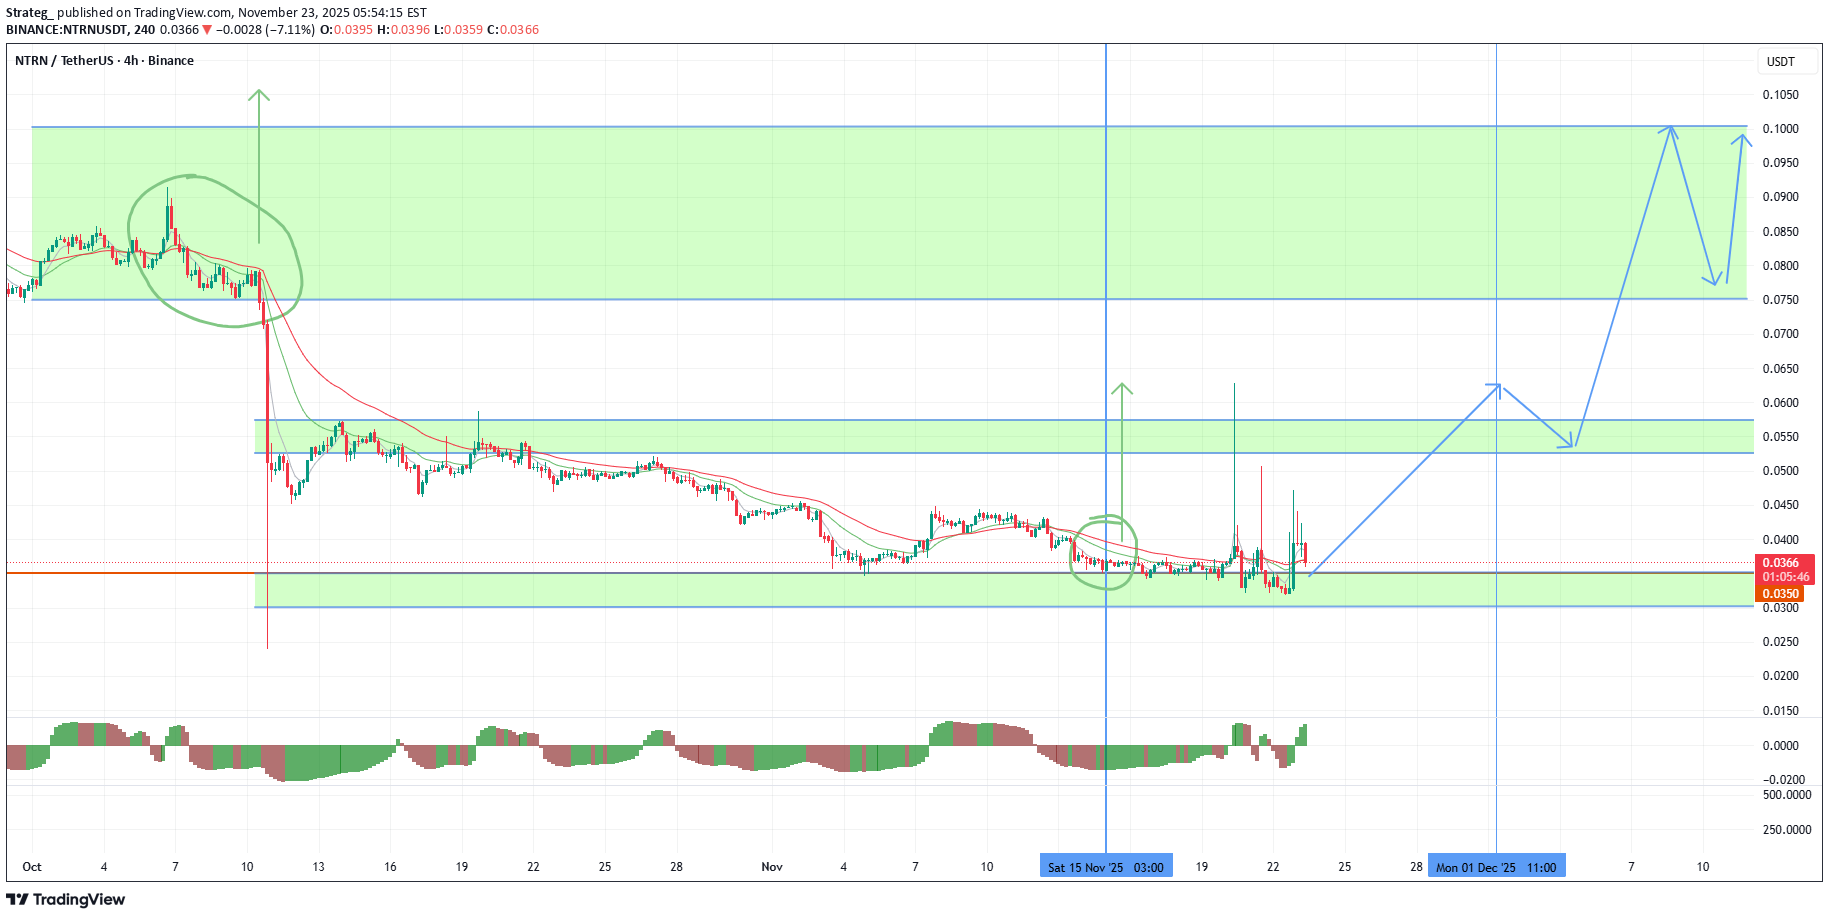
I hired NTRN today. For this token, the second half of the quarter opened above the 0.035 support, which gives a clear signal for growth. The first large investments have been made in recent days, but a stable trend can be expected by the end of the year with an attempt to consolidate in the range of 0.0750-1000. The main resistance is the 0.050-55 range. So far, it has not been taken against the background of a bearish trend that has gained a foothold on the indicators. Starting next week, the indicators will allow stable growth. If a new monthly candle opens above 0.05, further purchases will not be long in coming. The token has fallen to an extremely oversold position due to binance's speculation with the issue data. The actual number of tokens in circulation is still significantly lower, which gives great growth potential. I'm also considering TURTLE CHESS HOOK VIC BMT MITO for work.

Crypto_alphabit
سیگنال خرید NTRN: با این استراتژی، سودهای نجومی در انتظار شماست!
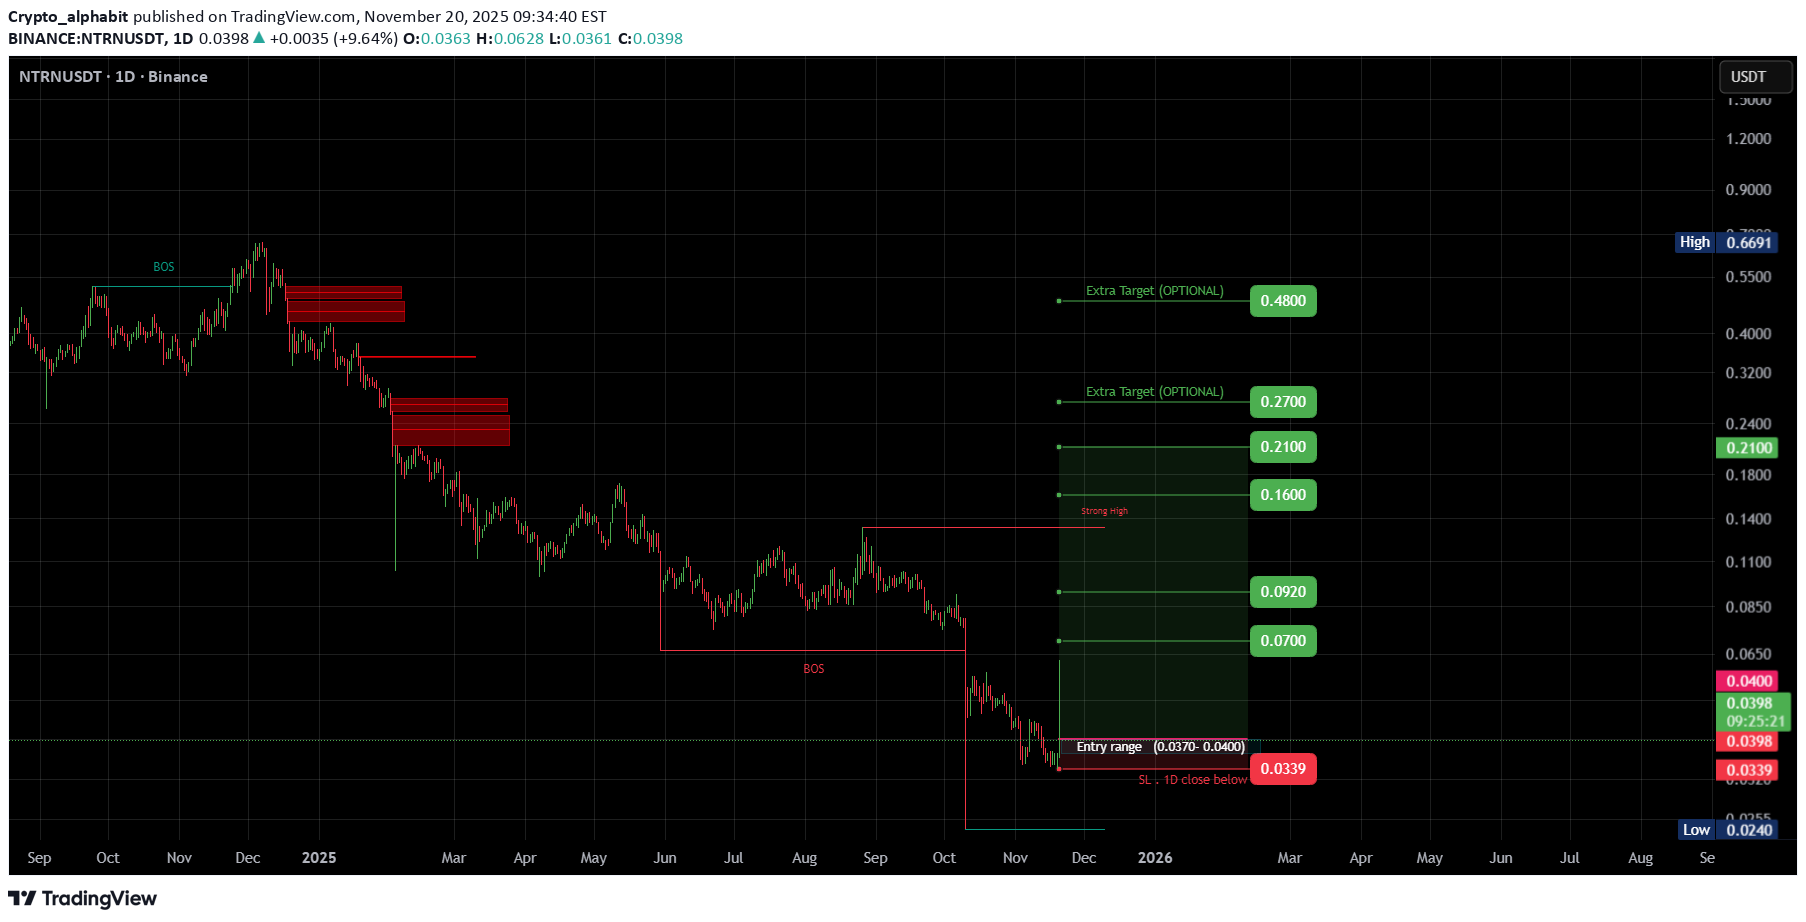
NTRNUSDT #NTRN/ USDT Entry range (0.0370- 0.0400) SL 1D close below 0.0339 T1 0.070 T2 0.092 T3 0.160 T4 0.210 2 Extra Target is optional 0.27 & 0.48 _______________________________________________________ Golden Advices. ******************** * collect the coin slowly in the entry range. * Please calculate your losses before the entry. * Do not enter any trade you find it not suitable for you. * No FOMO - No Rush , it is a long journey.

FortuneAI
بازگشت انفجاری بیت کوین؟ تحول بزرگ در برنامه سوددهی Neutron!
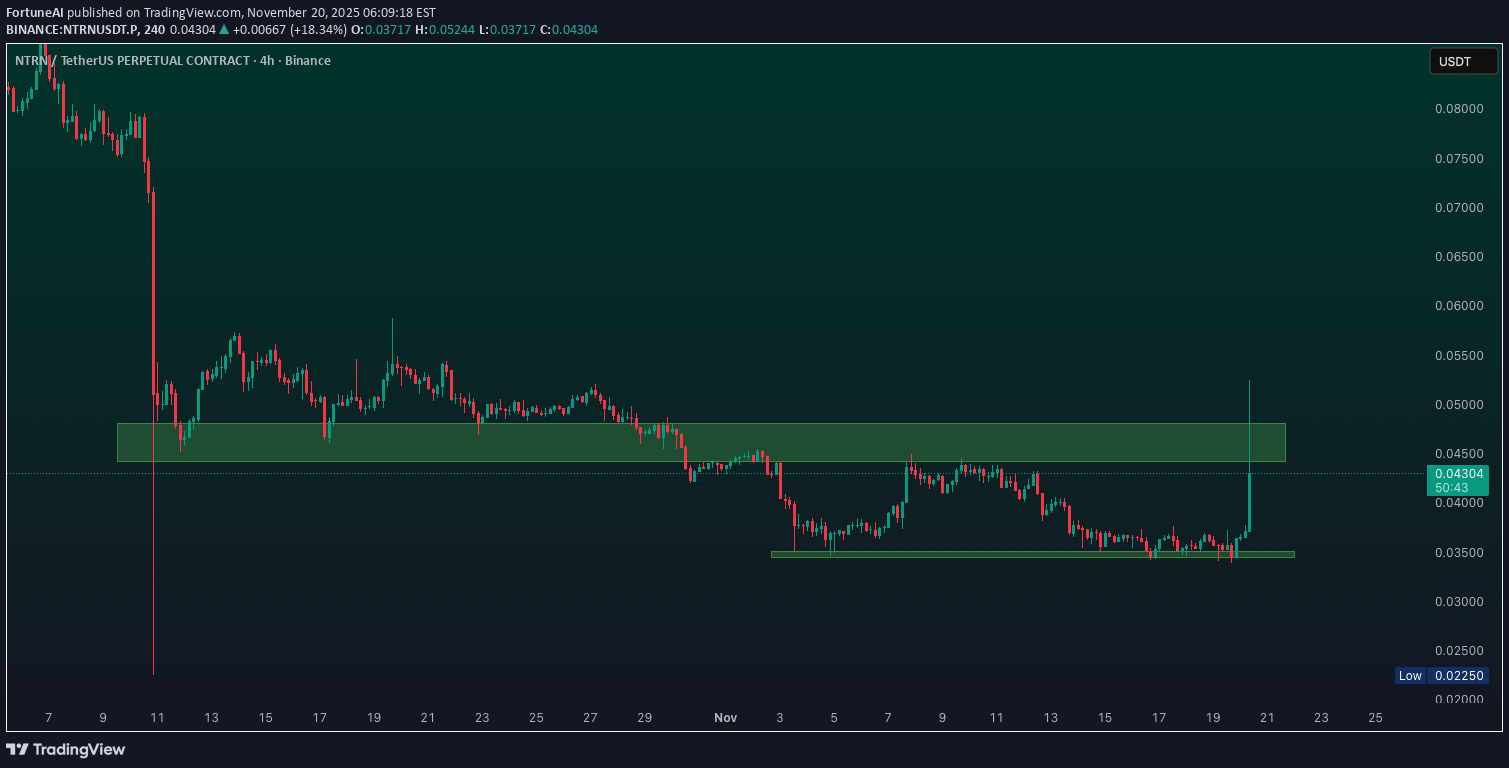
Neutron announced Phase II of its Bitcoin yield program on November 19, introducing new vaults for BTC staking and enhanced rewards. The update aligns with growing demand for BTC-centric DeFi, with Neutron’s TVL at $71M amid a $30B+ Bitcoin Summer ecosystem. Technicals looking bullish and Technical Rebound possible From Oversold Levels

ferhatdnc
acaba güzel yerlere gidermi
10,000 x Food: DD joke joke investment is not advice to myself.
ferhatdnc
acaba güzel yerlere gidermi

10,000 x Food: DD joke joke investment is not advice to myself.

Alpha-GoldFX
NTRNUSDT Forming Symmetrical Triangle
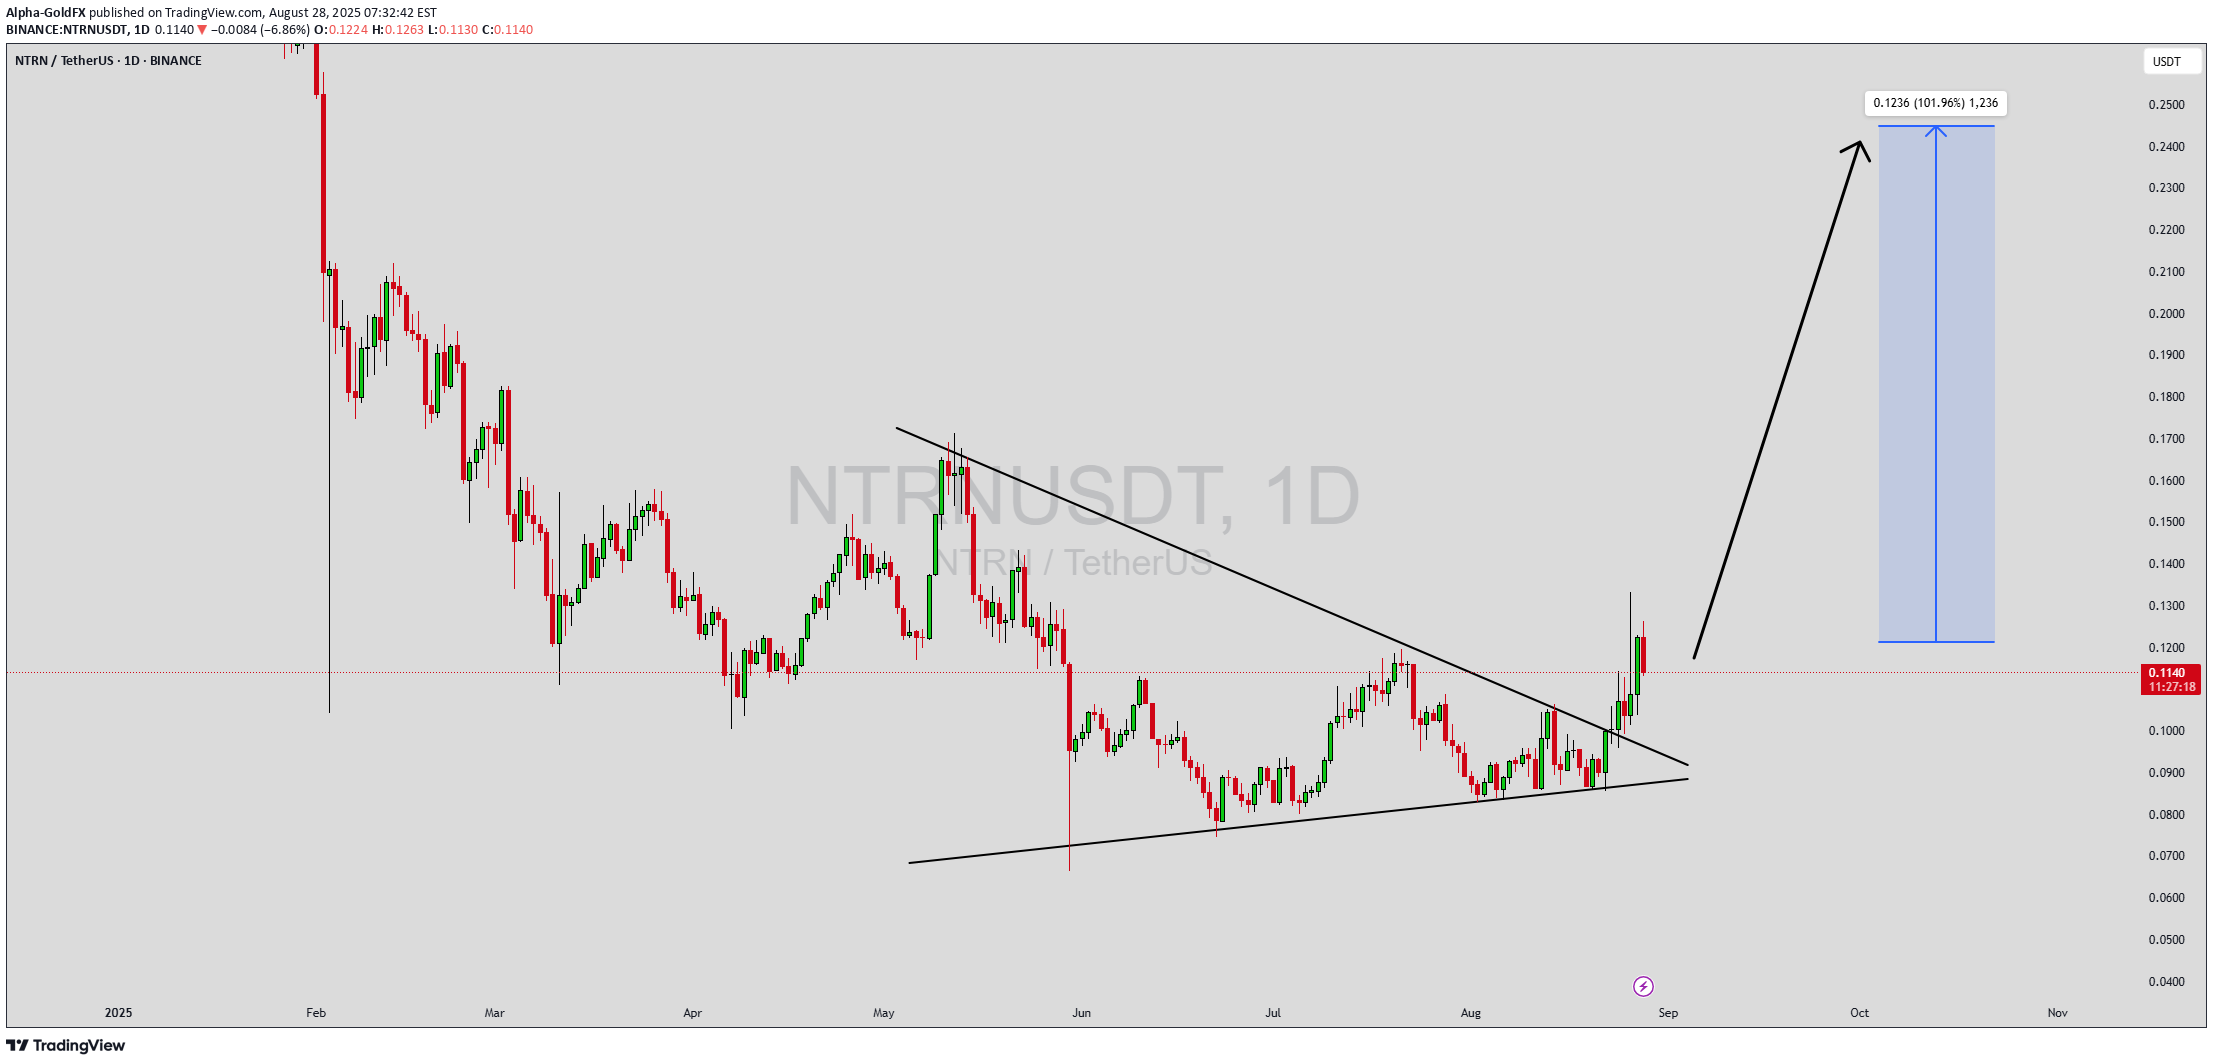
NTRNUSDT is displaying a strong technical setup, recently breaking out of a consolidation phase that had been forming for weeks. The chart structure indicates a breakout from a symmetrical triangle pattern, which often signals the beginning of a new bullish trend. With good trading volume supporting the move, momentum is favoring buyers, and the market sentiment appears to be shifting toward accumulation. Based on the current structure, this breakout has the potential to push NTRNUSDT toward significant upside targets. The projected move suggests possible gains in the range of 90% to 100%+, making this an attractive setup for traders looking for high-reward opportunities. The clear breakout level and continuation signal add further strength to the bullish case, particularly if volume continues to support the move. Investors are beginning to take a stronger interest in this project, adding more confidence to the long-term outlook. As adoption grows and the technical picture aligns with investor demand, NTRNUSDT could continue to build momentum and challenge higher resistance levels. Keeping an eye on retests of the breakout zone may provide solid entry opportunities for those waiting on confirmation. ✅ Show your support by hitting the like button and ✅ Leaving a comment below! (What is You opinion about this Coin) Your feedback and engagement keep me inspired to share more insightful market analysis with you!

Crypto-Adda_Official
$NTRN shows a Double bottom pattern.
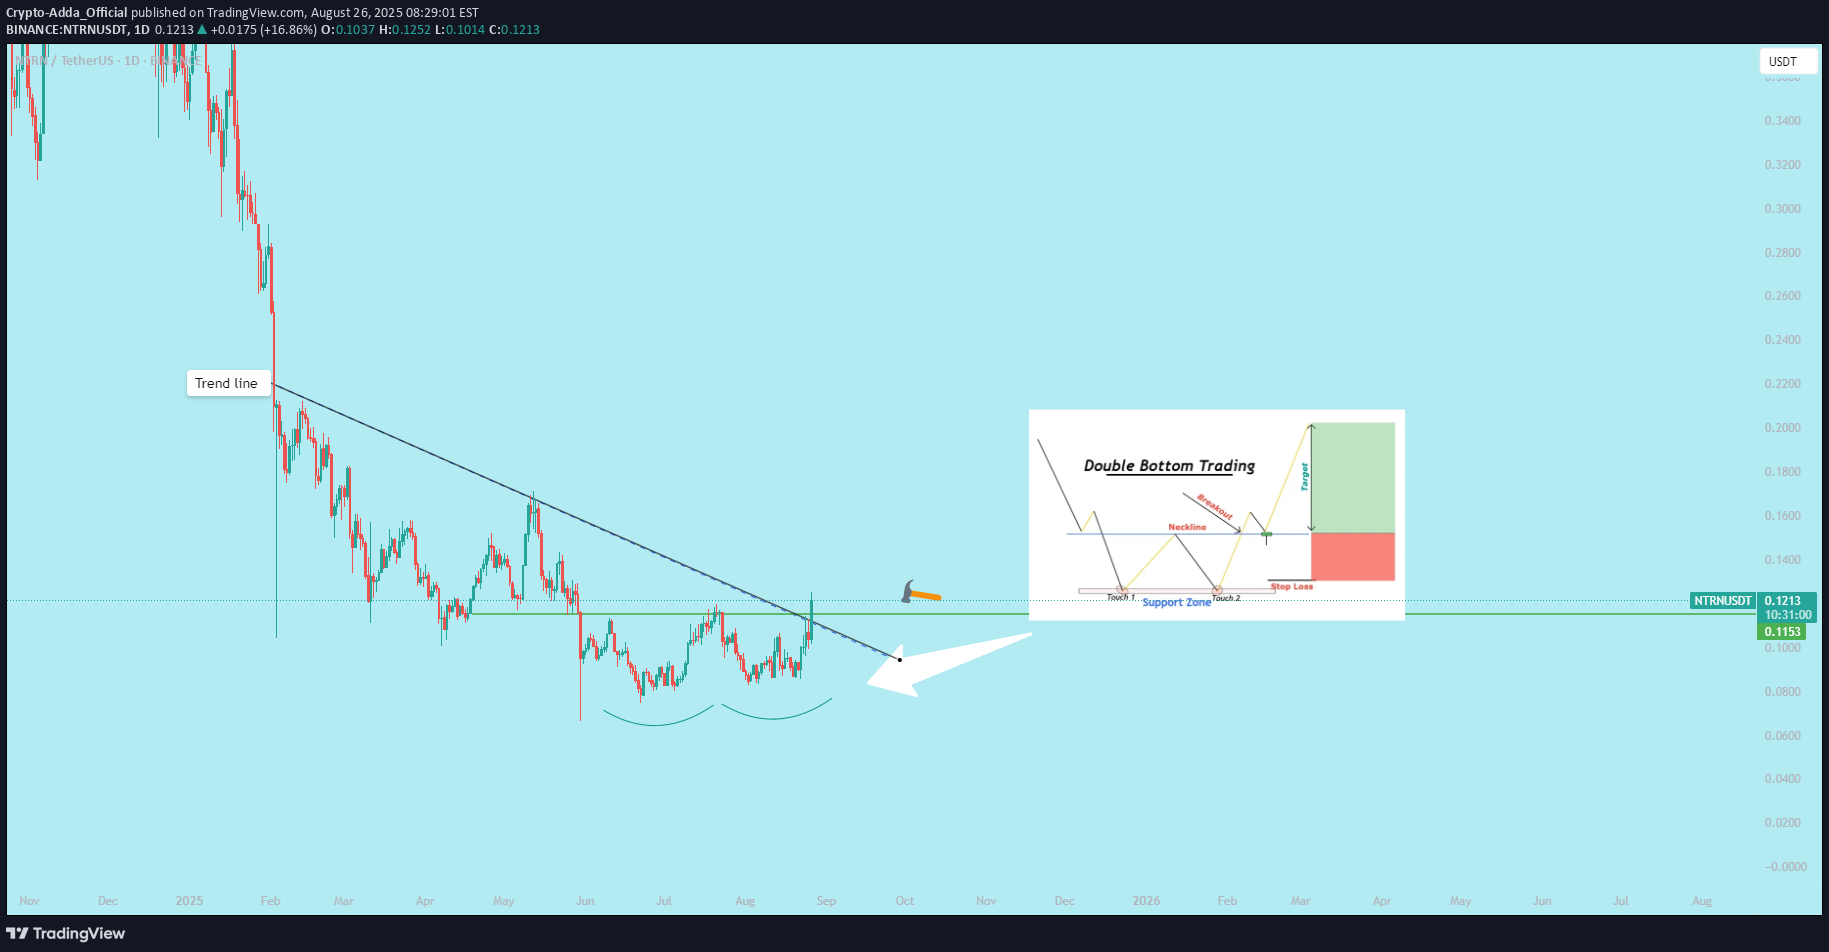
Steps to Trade the Double Bottom PatternIdentify the Pattern Look for a downtrend in the price chart. Spot two lows (bottoms) at approximately the same price level, forming a support zone. These lows should be separated by a peak (the middle of the "W"). The pattern is more reliable on higher timeframes (e.g., daily or 4-hour charts). Confirm the Pattern:Ensure the two bottoms are well-defined and not too far apart in time. Check for increased volume on the second bottom or during the breakout, as it supports the pattern's validity. Use additional indicators like RSI or MACD to confirm bullish momentum (e.g., RSI showing oversold conditions or a bullish divergence). Define Key Levels:Support: The price level of the two bottoms. Neckline: The horizontal line connecting the high point between the two bottoms (the peak of the "W"). Target: Measure the vertical distance from the bottoms to the neckline and project it upward from the breakout point for a potential price target. Entry Point:Enter a long (buy) position when the price breaks above the neckline with strong momentum (e.g., a strong bullish candle or increased volume). Alternatively, wait for a retest of the neckline (now acting as support) after the breakout to confirm the move. Set Stop-Loss:Place a stop-loss just below the second bottom to protect against false breakouts. A tighter stop-loss can be placed below the neckline if you're entering on a retest, but ensure it accounts for market volatility. Set Profit Target:Use the height of the pattern (distance from bottoms to neckline) to estimate the target. For example, if the distance is $10, the target is $10 above the neckline. Alternatively, trail your stop-loss or use resistance levels to lock in profits. Manage the Trade:Monitor volume and momentum during the breakout. Weak volume may indicate a false breakout. Adjust your stop-loss to breakeven once the price moves significantly in your favor. Be cautious of news or events that could invalidate the pattern. ExampleStock/Forex/Crypto: Price drops to $50 (first bottom), rises to $55 (neckline), drops back to $50 (second bottom), then breaks above $55. Entry: Buy at $55.50 (breakout confirmation). Stop-Loss: $49.50 (below the second bottom). Target: $60 (neckline $55 + pattern height $5). Risk-Reward Ratio: Calculate to ensure at least 1:2 (risk $1 to gain $2).

سیگنال آلفا کریپتو
⚜️ $ ntrn/USDT 🛒 Purchase range: 0.09 - 0.10 ⚡️ Target: 🎯t1: 0.115 🎯t2: 0.130 🎯t3: 0.150 🎯T4: 0.180 🎯t5: 0.220 🎯t6: 0.280 🔺 Loss limit: 0.074 💵 Suggested Balance: 5 % Capital 🔥 @signal_alpha 🔥

Bithereum_io
NTRNUSDT 1D

#NTRN has broken above the neckline of the inverse head & shoulders pattern on the daily chart. The retest has been successfully completed. Targets are:🎯 $0.1924🎯 $0.2141🎯 $0.2449🎯 $0.2843⚠️ Use a tight stop-loss.

UmutTrades
NTRNUSDT – Watch Out! Red Boxes Are Strong Resistance Zones

The red boxes on NTRUSDT mark powerful resistance areas where significant selling pressure is likely to emerge. These levels are not to be taken lightly, as they have historically been strong barriers for price movement.🔴 Key Takeaways:Strong Resistance: The red boxes act as tough resistance zones where sellers are likely to step in.Exercise Caution: Before making any decisions, ensure you wait for lower timeframe (LTF) breakouts and confirmation using CDV and volume analysis.Don't Rush: Be patient and allow the market to show you the proper direction. Only engage when the signals are crystal clear.💡 Plan Your Trade:Watch the market carefully, be disciplined, and only enter when confirmations align. If you don’t get the right setup, don’t force the trade—let the market come to you.📌I keep my charts clean and simple because I believe clarity leads to better decisions.📌My approach is built on years of experience and a solid track record. I don’t claim to know it all but I’m confident in my ability to spot high-probability setups.📌If you would like to learn how to use the heatmap, cumulative volume delta and volume footprint techniques that I use below to determine very accurate demand regions, you can send me a private message. I help anyone who wants it completely free of charge.🔑I have a long list of my proven technique below, (I created this list in a couple of months here, most of the traders doesn't have these much runners in their lifes) :🎯 ZENUSDT.P: Patience & Profitability | %230 Reaction from the Sniper Entry🐶 DOGEUSDT.P: Next Move🎨 RENDERUSDT.P: Opportunity of the Month💎 ETHUSDT.P: Where to Retrace🟢 BNBUSDT.P: Potential Surge📊 BTC Dominance: Reaction Zone🌊 WAVESUSDT.P: Demand Zone Potential🟣 UNIUSDT.P: Long-Term Trade🔵 XRPUSDT.P: Entry Zones🔗 LINKUSDT.P: Follow The River📈 BTCUSDT.P: Two Key Demand Zones🟩 POLUSDT: Bullish Momentum🌟 PENDLEUSDT.P: Where Opportunity Meets Precision🔥 BTCUSDT.P: Liquidation of Highly Leveraged Longs🌊 SOLUSDT.P: SOL's Dip - Your Opportunity🐸 1000PEPEUSDT.P: Prime Bounce Zone Unlocked🚀 ETHUSDT.P: Set to Explode - Don't Miss This Game Changer🤖 IQUSDT: Smart Plan⚡️ PONDUSDT: A Trade Not Taken Is Better Than a Losing One💼 STMXUSDT: 2 Buying Areas🐢 TURBOUSDT: Buy Zones and Buyer Presence🌍 ICPUSDT.P: Massive Upside Potential | Check the Trade Update For Seeing Results🟠 IDEXUSDT: Spot Buy Area | %26 Profit if You Trade with MSB 📌 USUALUSDT: Buyers Are Active + %70 Profit in Total🌟 FORTHUSDT: Sniper Entry +%26 Reaction🐳 QKCUSDT: Sniper Entry +%57 Reaction📊 BTC.D: Retest of Key Area Highly Likely*📊 XNOUSDT %80 Reaction with a Simple Blue Box!*📊 BELUSDT Amazing %120 Reaction!I stopped adding to the list because it's kinda tiring to add 5-10 charts in every move but you can check my profile and see that it goes on..
Disclaimer
Any content and materials included in Sahmeto's website and official communication channels are a compilation of personal opinions and analyses and are not binding. They do not constitute any recommendation for buying, selling, entering or exiting the stock market and cryptocurrency market. Also, all news and analyses included in the website and channels are merely republished information from official and unofficial domestic and foreign sources, and it is obvious that users of the said content are responsible for following up and ensuring the authenticity and accuracy of the materials. Therefore, while disclaiming responsibility, it is declared that the responsibility for any decision-making, action, and potential profit and loss in the capital market and cryptocurrency market lies with the trader.