
NKN
NKN
| تریدر | نوع سیگنال | حد سود/ضرر | زمان انتشار | مشاهده پیام |
|---|---|---|---|---|
No results found. | ||||
Price Chart of NKN
سود 3 Months :
سیگنالهای NKN
Filter
Sort messages by
Trader Type
Time Frame

asilturk
NKN: سقوط عمیق و طلایهدار پامپ بعدی؟ فرصت یا دام؟

Another crypto stock we will add to the portfolio today is NKN 0.02 cents. The only reason why we added it is that with the decreases starting from the $ 1.50 price band in the POW status, decreasing to 0.0063 cents and subsequent corrections, a transaction volume of 1.4 Million dollars is realized with the price of 0.02 cents. There is no reason that makes NKN special; the high transaction volumes in alt coins, which are completely in POW status. NKN As of now, it seems that even the volume of 2 million dollars has not been realized. When we look from a technical perspective, we see a monthly trend around 30 levels. A real trend, which shows that the monthly correction is complete. If there is a serious increase in volume, I predict that there will be sharp increases in NKN with new price targets. Although other alt coins have recorded stable increases, I believe that there will be harsher movements in the alt coins, which are in pow status, in the next monthly period. I determine the NKN monthly trend direction as up. I would also like to point out that it carries risks for spot investors. Binance has kept a close watch on it and its BTC dominance weight is 0.0004, so we can say that it is a crypto that is almost destroyed. The risk of becoming a delist should not be ignored. Friends who will open futures transactions must keep their liquidity risk level within the 0.1 cent band. I Wish You Enjoyable Spending

CryptoNuclear
سرنوشت NKN/USDT: آیا زمان انباشت عظیم فرا رسیده یا سقوط نهایی در راه است؟

🧩 Full Analysis & Market Narrative NKN is currently at a critical historical crossroads. After a prolonged downtrend since 2021, price has finally returned to retest the legendary support zone at 0.021–0.015, an area that once served as the foundation of its previous bullrun. The massive wick down to 0.0055 appears to be a liquidity sweep — where the market flushed out weak long positions before potentially beginning a new accumulation phase. This yellow zone now stands as “The Last Defense Zone” for NKN to maintain its long-term technical structure. --- 🔹 Structure & Pattern Primary Trend: Long-term bearish (since the 2021 peak). Current Phase: Sideways/accumulation above major support. Candle Behavior: Deep wick rejection signals strong buying reaction — a sign that demand is still present. Key Scenario: This phase often marks the early stage of a macro reversal if confirmed by a weekly breakout. --- 🚀 Bullish Scenario If price holds above 0.021–0.015 and successfully reclaims 0.0340, it could trigger a strong structural reversal. Confirmation: Weekly close above 0.0340 → successful retest. Upside Targets: 🎯 Target 1: 0.045 🎯 Target 2: 0.057 🎯 Target 3: 0.137–0.200 If momentum mirrors 2021’s cycle, extended targets up to 0.30–0.68 are still within reach. 📈 Market Insight: From a market psychology standpoint, this zone may represent institutional accumulation — when public sentiment is exhausted and disbelief is high. --- ⚠️ Bearish Scenario However, if the 0.015 zone fails to hold and weekly closes occur below it, the market could enter its final capitulation phase toward: 🩸 0.010 → minor psychological zone 🩸 0.0055 → final liquidity zone (panic selling area) Such breakdowns would confirm a multi-year bearish continuation, potentially leading to new price discovery below 0.005. --- 🧠 Conclusion & Outlook NKN is in a “survival phase” — a make-or-break moment between structural recovery and complete undervaluation. The upcoming weekly candles will likely decide the next macro direction. For experienced traders, this region offers a high-risk, high-reward opportunity, but strict risk management remains essential. --- #NKN #CryptoAnalysis #Altcoin #TechnicalAnalysis #SwingTrading #SupportAndResistance #MarketStructure #AccumulationZone #CryptoChart #PriceAction #ReversalZone #BullishSetup #BearishScenario

OguzhanAfsarSarac
معاملهای در نمودار: راز سودآوری بزرگ که باید بدانید!

I'm taking the transaction on the chart, good luck to everyone.

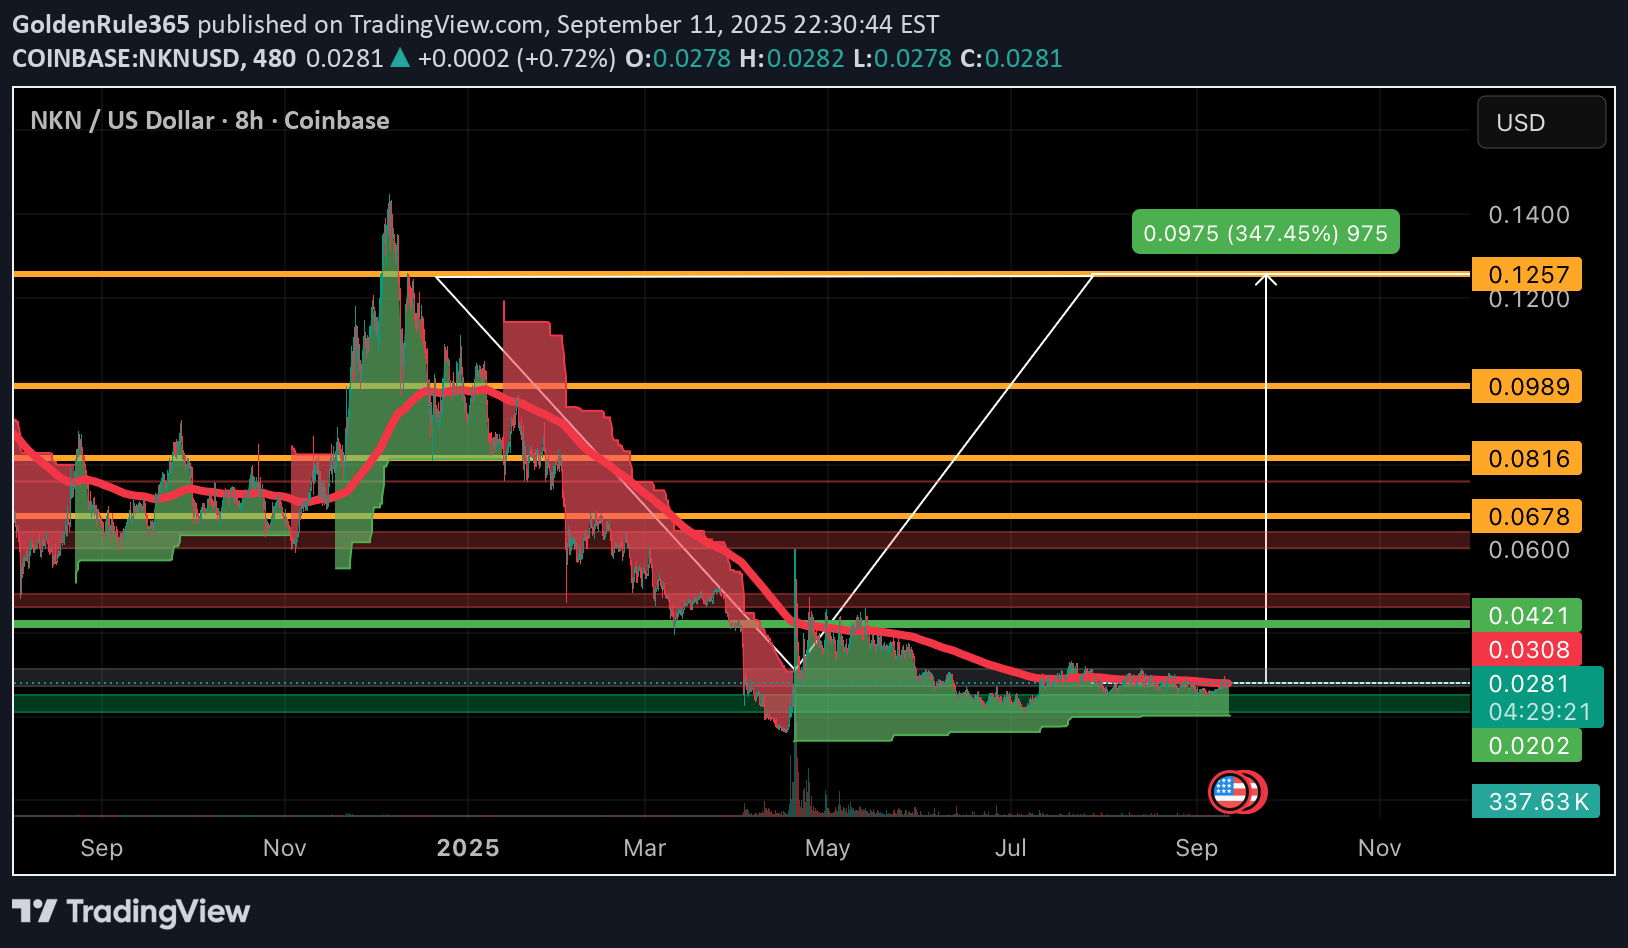
GoldenRule365

Thebitcoin37
NKNUSDT DETAILED ANALYSIS ON 15m.
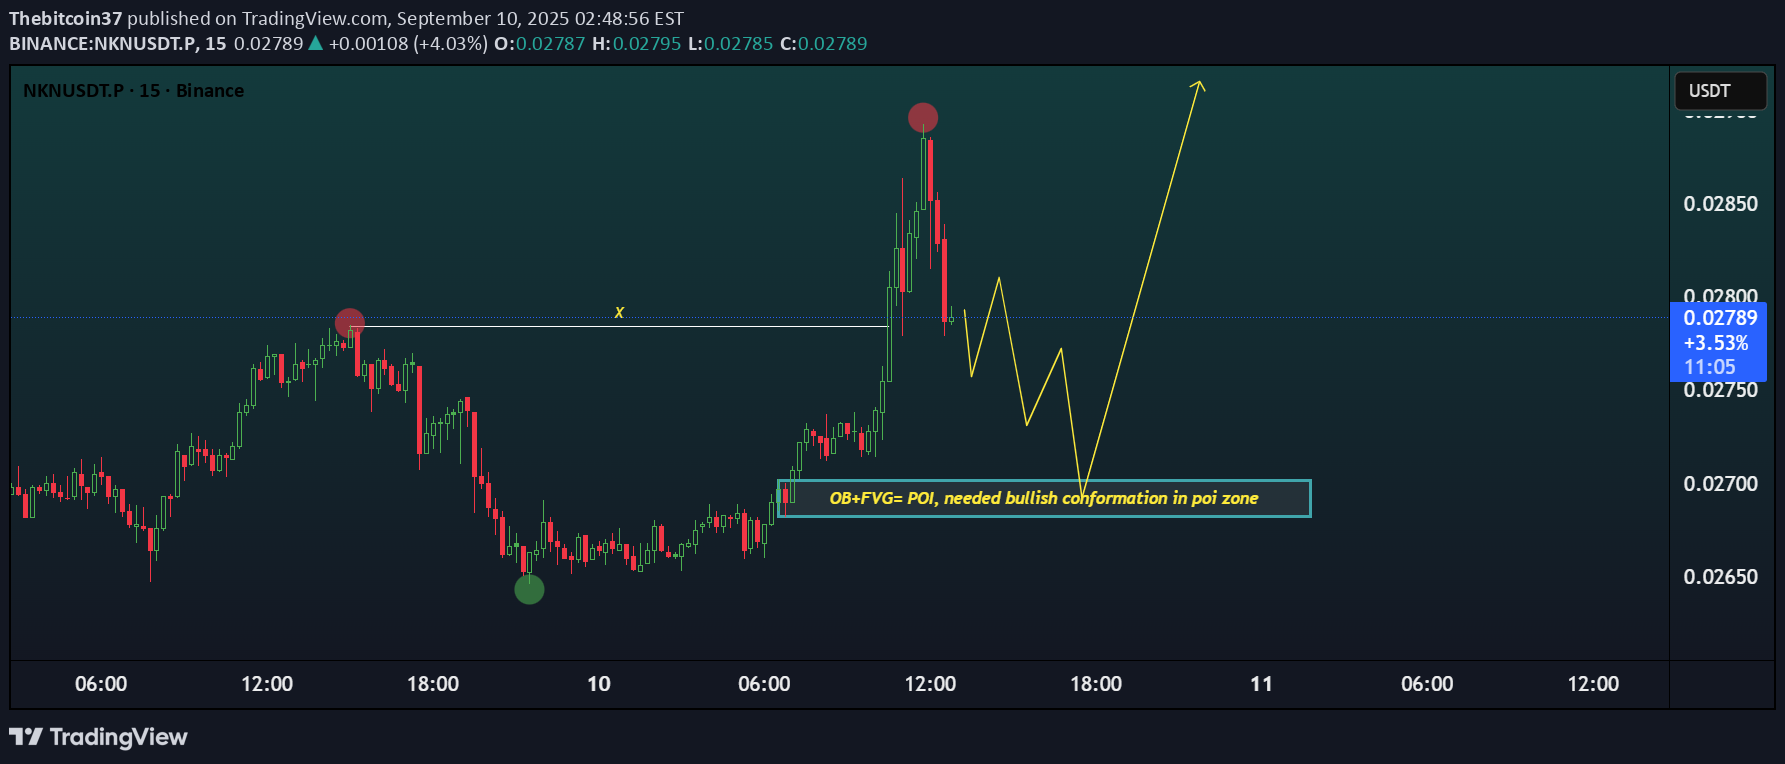
Chart Context Pair: NKN/USDT Timeframe: 15 minutes Current Price: ~0.02796 Recent Move: Strong push upward into ~0.02900 followed by rejection. 📝 Key Levels Resistance / Supply Area Around 0.02900 – marked by the red circle. Price rejected sharply here, showing sellers are active. Break of Structure (BOS) Previous highs (X) were broken, showing bullish momentum. Point of Interest (POI) Zone OB + FVG overlap (around 0.02700 – 0.02720) This is the main demand zone to watch. 📊 Market Structure Short-Term: Bullish (higher highs & BOS). Pullback Likely: Price is retracing after rejection. Confirmation Needed: A bullish reaction from the POI zone (engulfing / rejection wick / momentum candle). 🚀 Expectation If price holds above the POI: → Likely continuation toward 0.02850 – 0.02900. If POI fails: → Possible deeper retrace to 0.02650 support. ✅ Summary;- NKNUSDT (15m) – Price rejected from 0.029 resistance after a strong move up. Watching 0.02700 – 0.02720 demand zone (OB + FVG) as POI. If bullish confirmation appears here, we can expect another leg upward toward 0.0285–0.029. If it breaks, deeper retracement toward 0.0265 possible.

without_worries
July 2025 - New Kind of Network (NKN) 4000% before October 2025
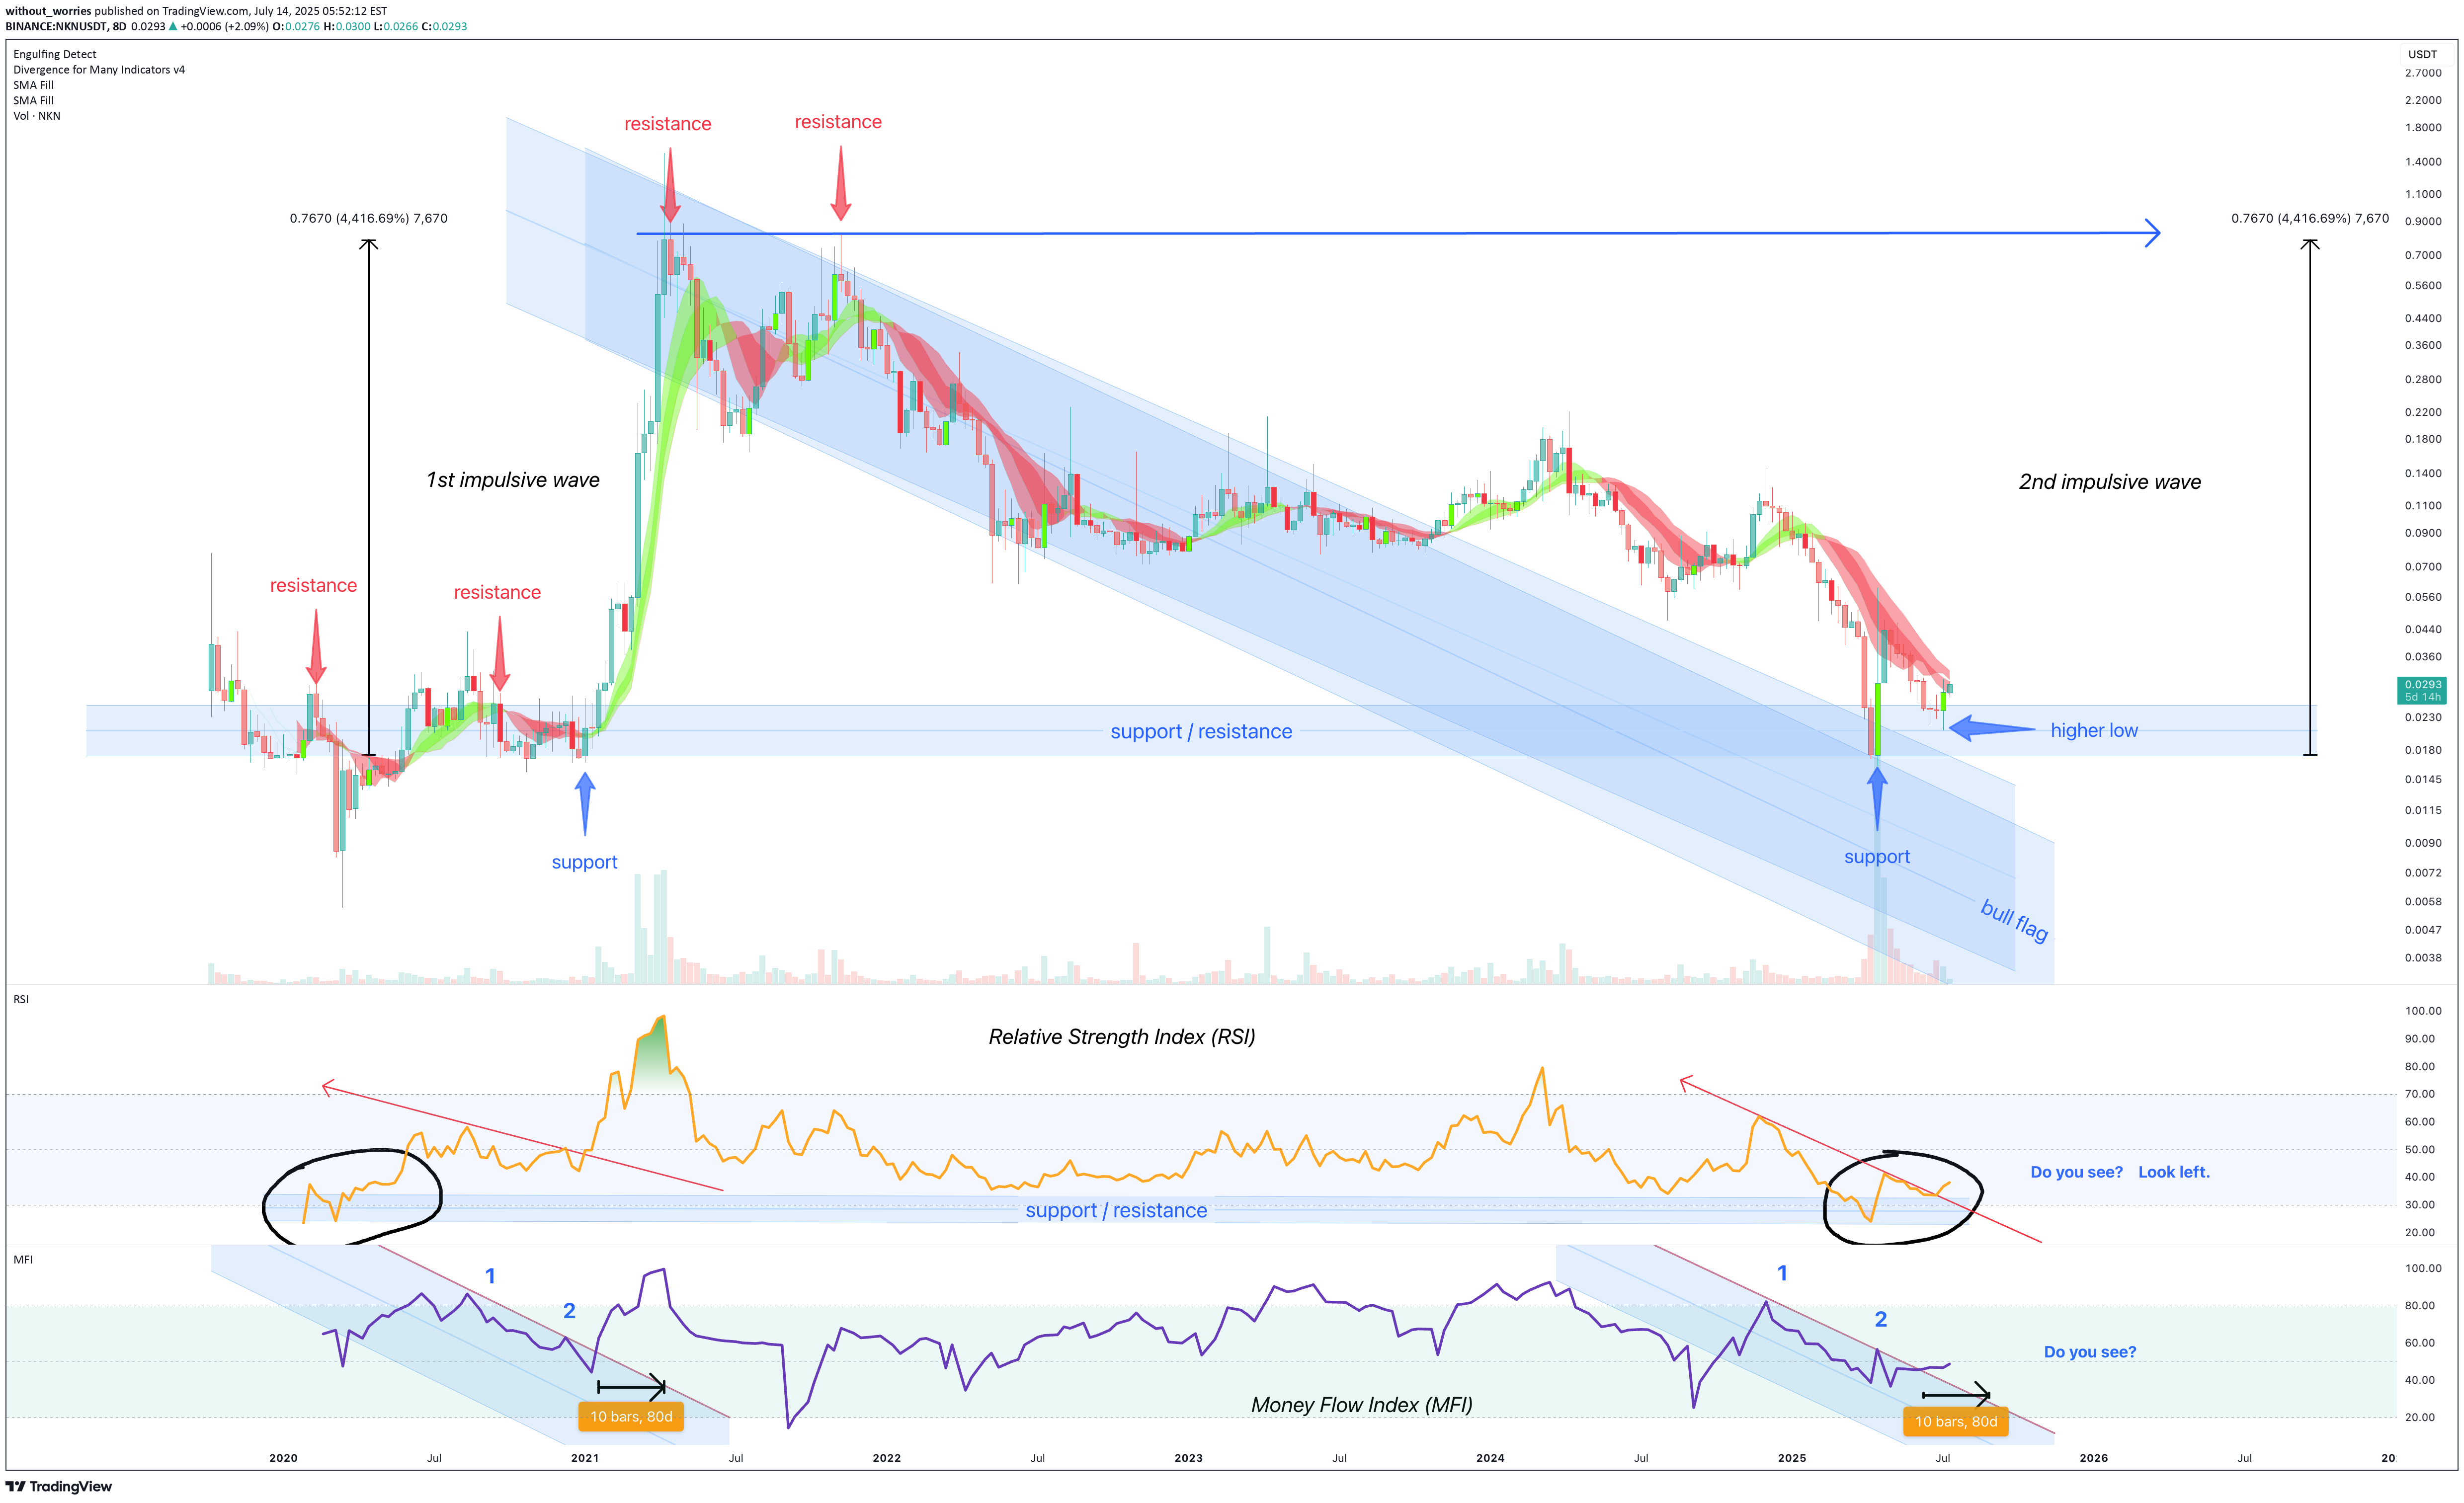
** The months ahead ** On the above 8 day chart price action has corrected 99% since 2021. The chart now displays a compelling technical setup that suggests a strong bullish continuation could be on the horizon. Bullish Arguments: Price action forms a clear bull flag pattern A classic continuation pattern typically appears after a strong upward movement (the "flag pole" or impulsive wave) and is followed by a period of downward consolidation (the "flag"). Albeit the formation rarely prints over such a long period of time for a crypto. The downtrend resistance is now broken with a support confirmation suggesting price action is preparing for another leg up, resuming its prior bullish momentum from 2020. Strong support confirmation on past resistance Look left. Historical price zone has proven its significance in the past, acting as both a ceiling and a floor for price movements. The current bounce off past resistance, marked by a higher low, indicates buyers are stepping in at this area. The volume entering the market, collecting emotional seller capitulations, is notable. Relative Strength Index (RSI) confirms resistance breakout The Relative Strength Index (RSI) reinforces the bullish outlook. Notice prior to the resistance breakout the index would now print a higher low from the same support area as in 2020. Money Flow Index (MFI) resistance breakout The Money Flow Index (MFI) in the lower panel provides excellent confirmation of the bullish sentiment, follow the money! The new money shows a clear pattern of resistance breakout, mirroring previous instances (marked as 1 and 2) where similar money flow preceded to see strong upward moves in price action. This indicates that money is flowing back into the token, for whatever reason I do not know. Considering the clear bull flag formation, the strong bounce off a critical support/resistance zone, and the confirming signals from RSI and MFI indexes (or indices?!) NKN appears poised for a significant upward continuation. Is it possible price action continues to print lower lows? Sure. Is it probable? No. WwNow we wait... wait until until recently liquidated retail traders return with fresh exit liquidity on next month's pay day.

TraderNexusX
$NKNUSDT - Buy Zone Ready
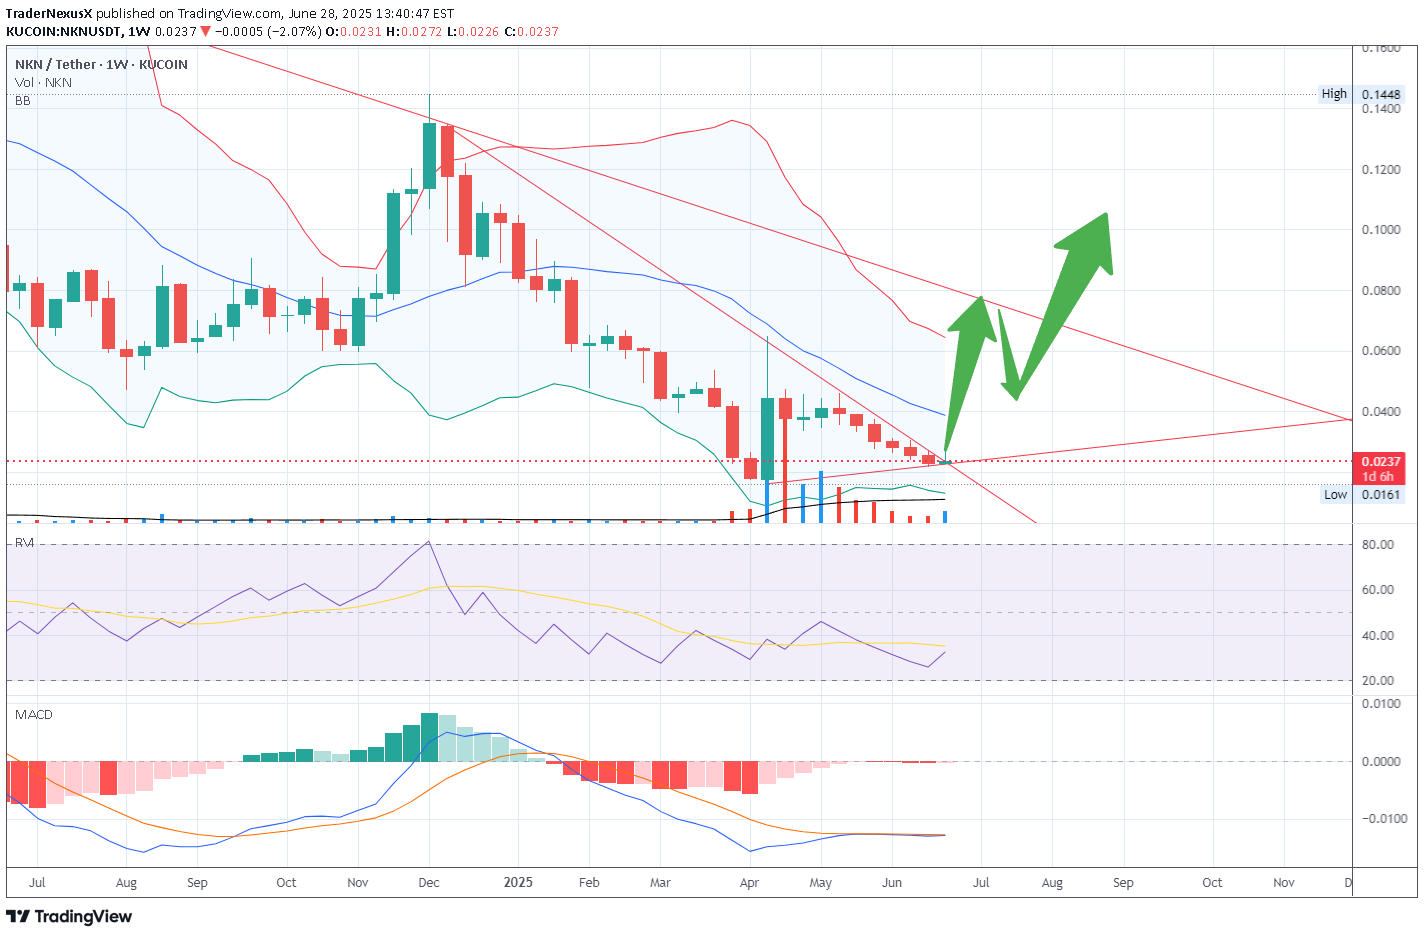
BINANCE:NKNUSDT - I'd jump into NKN at this point. Price is a steal in my opinion. Wont sell this until it reaches a minimum 1x. All charts to me are posing a potential buy signal. All the best
CryptoNuclear
NKN/USDT — Epic Reversal from Major Demand Zone
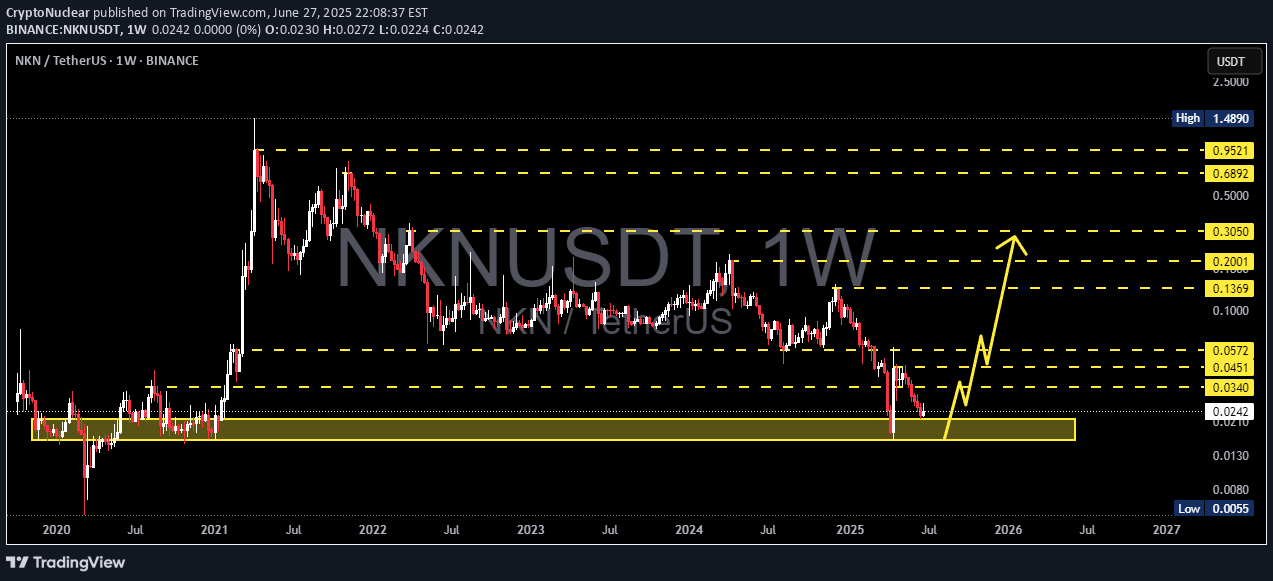
🔍 Chart Breakdown:1. Strong Historical Demand Zone:Highlighted by the thick yellow box between $0.0055 – $0.0240.Price has returned to this accumulation range, which previously launched a major rally in 2021.2. Potential Bullish Reversal Pattern:After hitting the lower support, recent weekly candles suggest a potential double bottom or bullish engulfing pattern forming.The yellow projected path shows a possible gradual recovery.3. Layered Resistance Levels (Take-Profit Targets):$0.0340$0.0451$0.0572$0.1369$0.2001Up to $0.3050 as a major psychological barrier4. Profit Potential:From the current price (~$0.0242), reaching the top target of $0.3050 offers a potential gain of over +1100% in the medium to long term.5. Bearish Exhaustion & Sentiment Shift:The long downtrend since 2021 appears to be losing momentum.Buyers are defending this critical historical support zone.🛡️ Conclusion:NKN is at a pivotal level, sitting on a historically significant support zone. If volume increases and price holds above the demand area, a strong reversal could play out. This setup presents a high-risk, high-reward opportunity worth monitoring closely in the coming weeks.#NKN #AltcoinSeason #CryptoReversal #NKNUSDT #Binance #CryptoTrading #TechnicalAnalysis #BullishSetup #SwingTrade #CryptoNuclear

Alpha-GoldFX
NKNUSDT Forming Falling Wedge Breakout
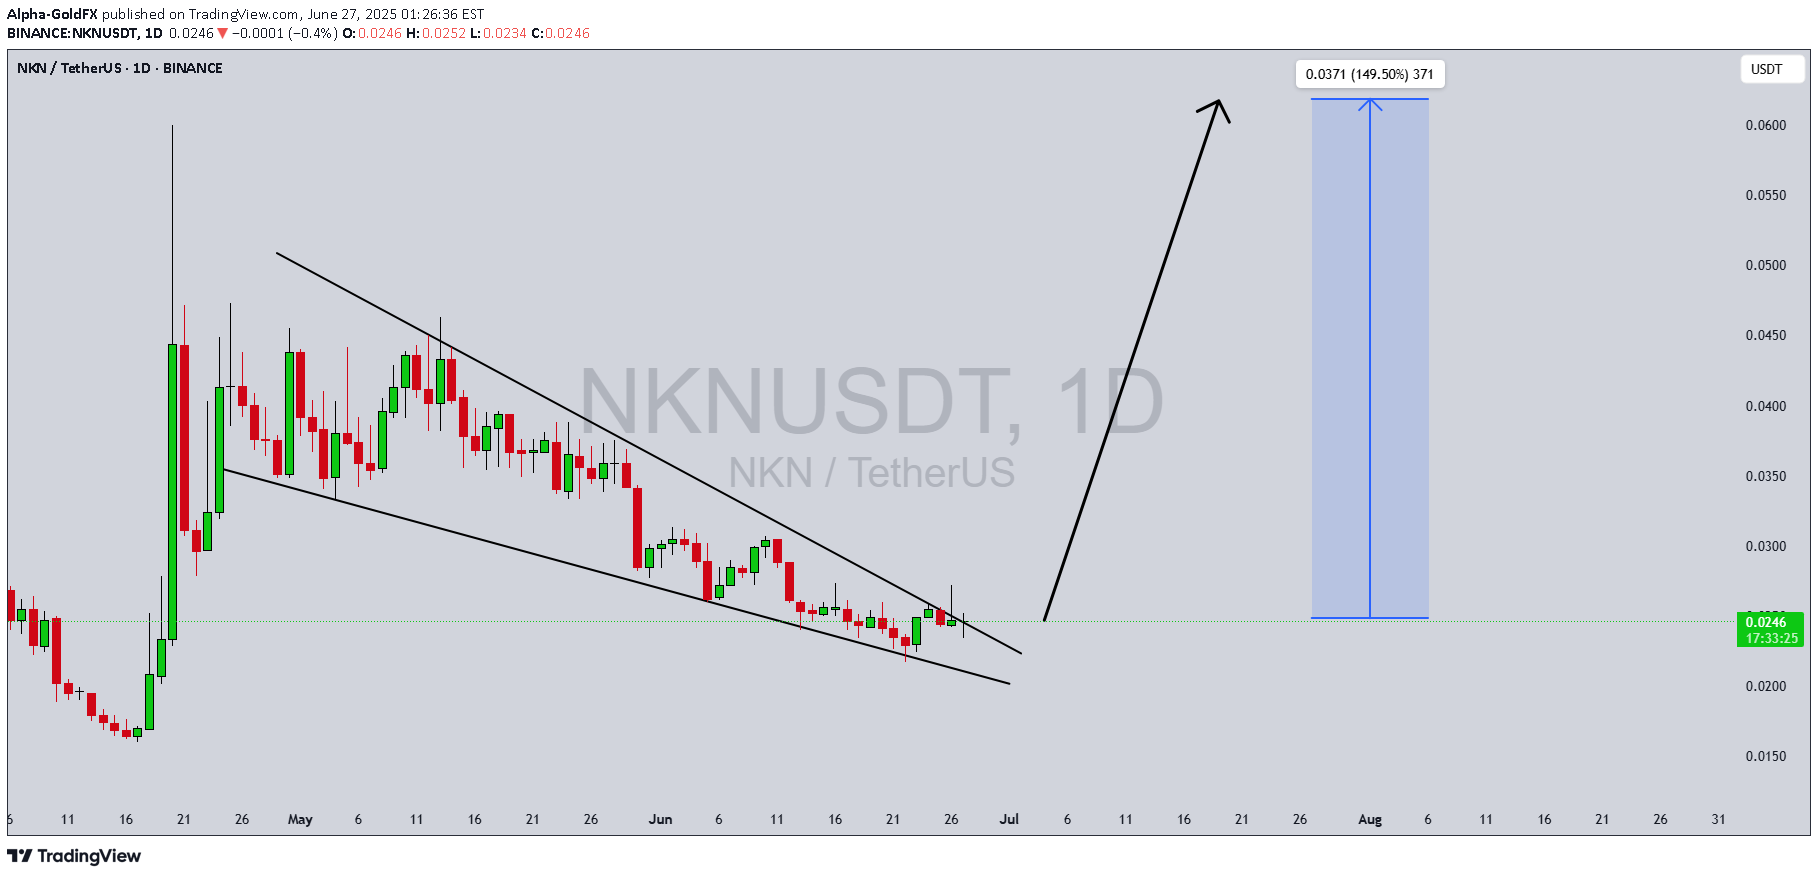
NKNUSDT has recently confirmed a Falling Wedge Breakout Pattern, signaling a strong bullish reversal after a prolonged downtrend. This classic reversal structure is often considered a high-probability setup, especially when accompanied by increasing volume, as seen in this case. The breakout suggests that bears have exhausted their momentum and bulls are stepping in with confidence. With this setup, an expected gain of 130% to 140%+ appears technically justified if follow-through buying pressure continues.NKN (New Kind of Network) is gaining attention due to its innovative approach to decentralized communication networks. As the Web3 ecosystem grows, projects like NKN that enable secure, censorship-resistant data transmission are seeing increased adoption and speculative interest. This surge in investor attention is translating into positive price momentum, which aligns with the current technical breakout. The good volume behind the move strengthens the case for a sustained upward rally.The current price action is forming strong higher highs and higher lows following the breakout, which could attract both short-term traders and long-term holders. Technical indicators such as moving averages and RSI are likely flipping bullish, supporting the view that this breakout may lead to a major trend shift. If bullish momentum continues, NKNUSDT may reclaim key resistance levels and potentially exceed the projected targets.Given the overall positive sentiment across altcoins and the strategic utility of the NKN project, this breakout could be the start of a significant trend. Traders and investors should keep an eye on continuation patterns and monitor volume closely for validation.✅ Show your support by hitting the like button and✅ Leaving a comment below! (What is You opinion about this Coin)Your feedback and engagement keep me inspired to share more insightful market analysis with you!

TurkiTrade
bullish fractal

As you can see, this fractal I think will happen it's not a deal just watch it with your analyze
Disclaimer
Any content and materials included in Sahmeto's website and official communication channels are a compilation of personal opinions and analyses and are not binding. They do not constitute any recommendation for buying, selling, entering or exiting the stock market and cryptocurrency market. Also, all news and analyses included in the website and channels are merely republished information from official and unofficial domestic and foreign sources, and it is obvious that users of the said content are responsible for following up and ensuring the authenticity and accuracy of the materials. Therefore, while disclaiming responsibility, it is declared that the responsibility for any decision-making, action, and potential profit and loss in the capital market and cryptocurrency market lies with the trader.