
NEAR
NEAR Protocol
| تریدر | نوع سیگنال | حد سود/ضرر | زمان انتشار | مشاهده پیام |
|---|---|---|---|---|
 vf_investmentRank: 16443 | خرید | حد سود: تعیین نشده حد ضرر: تعیین نشده | 12/2/2025 |
Price Chart of NEAR Protocol
سود 3 Months :
خلاصه سیگنالهای NEAR Protocol
سیگنالهای NEAR Protocol
Filter
Sort messages by
Trader Type
Time Frame

NEAR/USDT
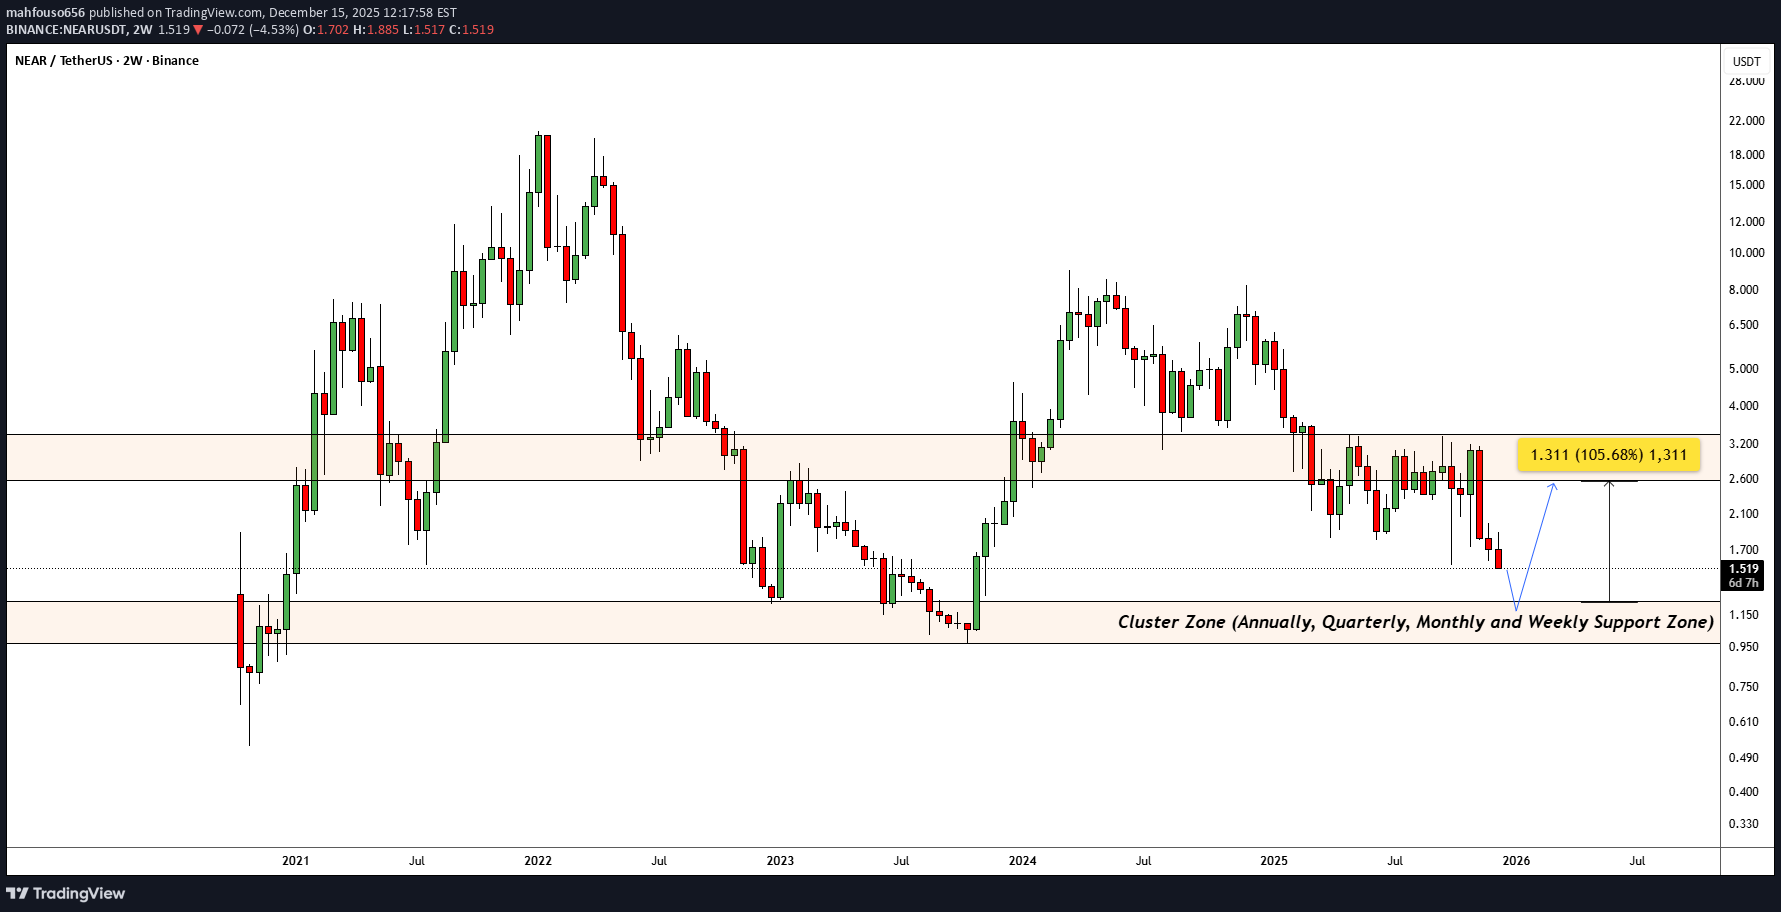
NEAR/USDT is heading to reach a strong cluster support zone (between 1.246 - 0.971) SL is whenever a weekly candle closes below 0.971 TP at 2.570 Technical view, not a financial advice

تحلیل NEAR: شکست ساختار بازار در محدوده نزولی و اهداف احتمالی قیمت
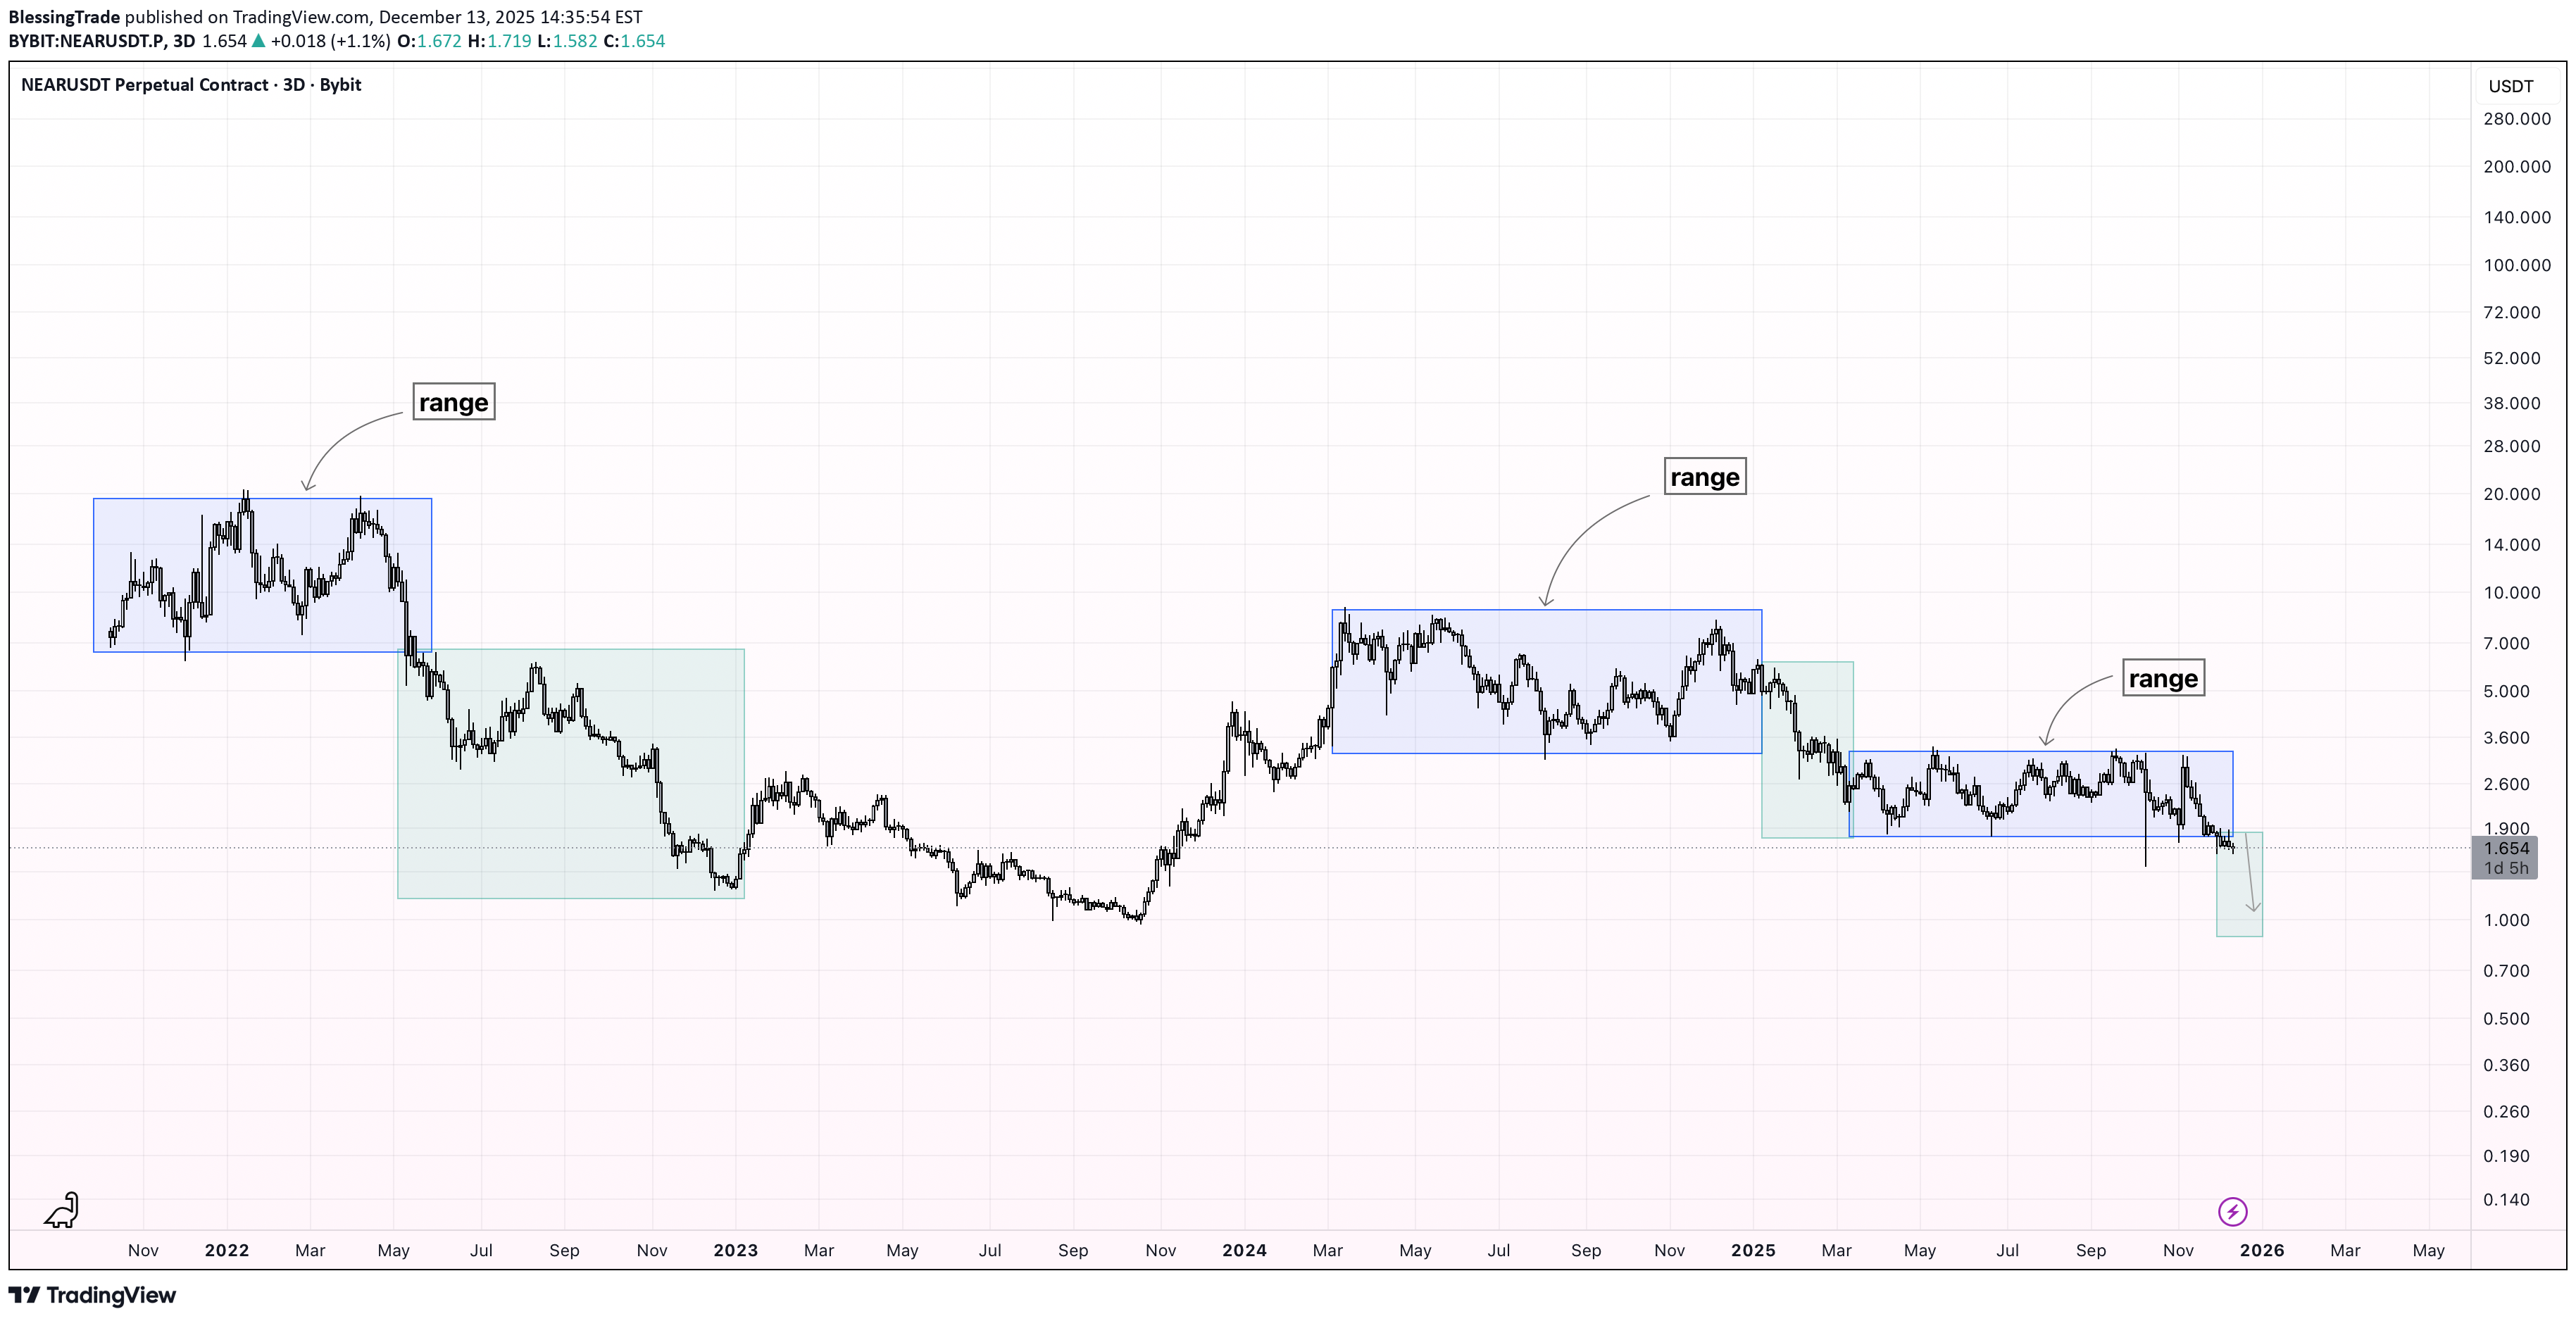
Price action is predominantly range-bound. Throughout the chart, price forms clear consolidation ranges, followed by directional moves after range breakouts. Currently, the latest range has been broken to the downside, confirming bearish continuation. Structure remains weak below former range support, which is now acting as resistance. Expectation: continuation of the downside move toward the following levels: $1.25 $1.00 $0.90 As long as price stays below the broken range, bearish bias remains valid.beaarrr run!!! DOWN!!!!
NEAR long trade idea
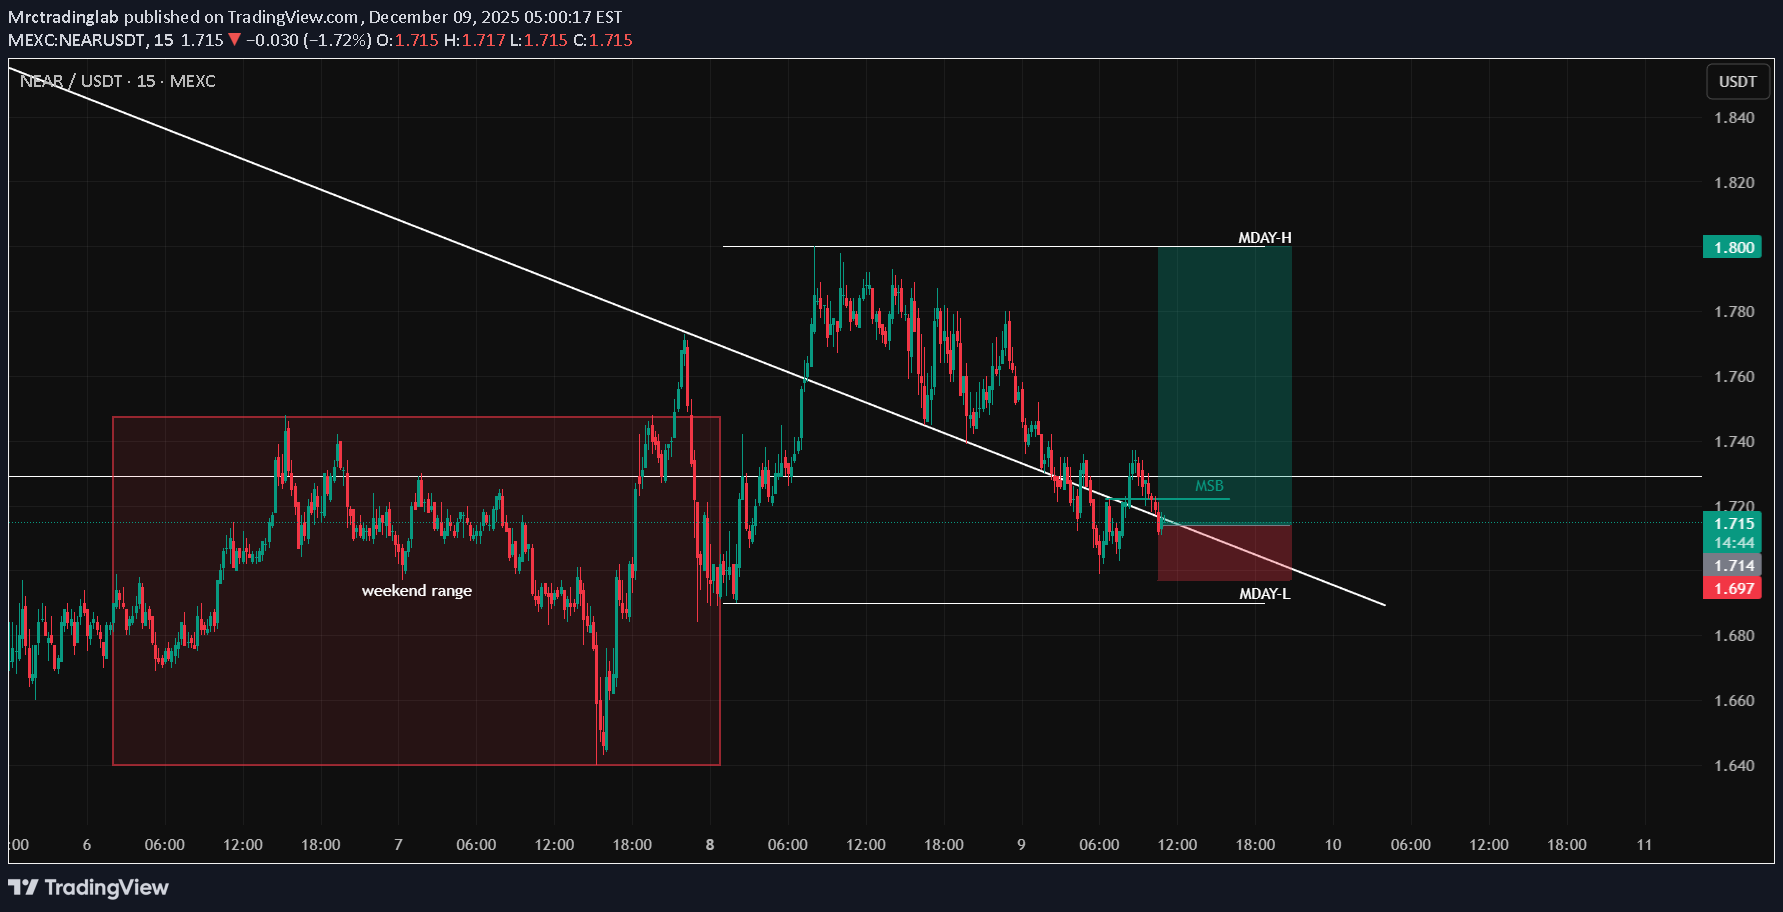
This long idea aligns with the current price action on the Total Market Cap, where I expect further upside in the short term. On the lower time frame, we have a market structure break (MSB) followed by a clean 50% retracement, providing a favorable intraday entry. The only notable risk in this setup is that the weekend range has not been fully taken yet. Ideally, I would have preferred to see liquidity sweep that range first before reclaiming the Monday range. However, the risk-to-reward profile on this setup is strong enough to justify taking the trade based on the current structure. This idea is purely based on price action: MSB, retracement into demand, and confluence with broader market momentum. MrCTarget hit. Hope you guys made some nice profits.

CryptoNuclear
نزدیک شدن NEAR به منطقه سرنوشت: آیا قیمت منفجر میشود یا سقوط میکند؟
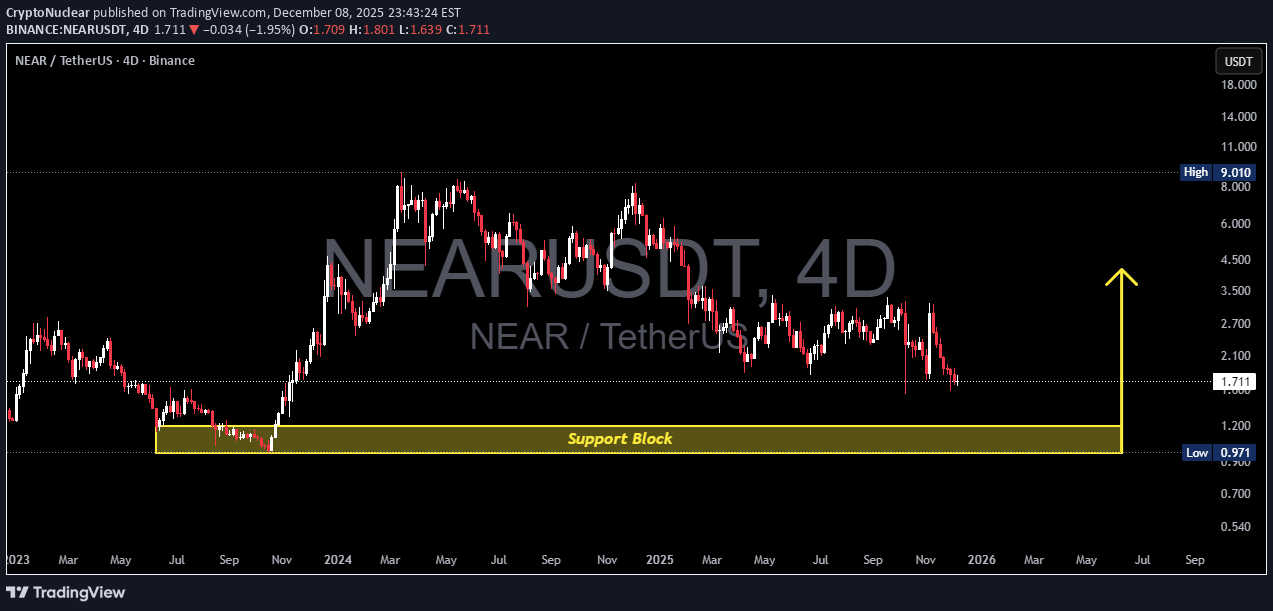
NEAR/USDT is entering a critical phase. Price is moving toward the major Support Block at 1.20–0.97, the same demand zone that previously triggered NEAR’s explosive rally during 2023–2024. This isn’t just another support level — it’s a macro accumulation zone where institutional orders historically stepped in. Although the broader trend still prints lower highs, signaling a bearish macro structure, NEAR is now testing the most significant demand area of the last two years. Zones like this often become the battlefield where large buyers versus exhausted sellers decide the next major trend. --- 🔥 Bullish Scenario — A Major Rebound Could Begin Here The 1.20–0.97 block has the potential to generate a macro reversal if we see: A strong 4D bullish reversal candle (engulfing/hammer) A clear volume spike The formation of a higher low after the retest If confirmed: Target 1: 2.70 Target 2: 3.50 – 4.50 Reward potential is massive because entries near the bottom give extremely favorable R:R. --- ⚠️ Bearish Scenario — A Breakdown Opens the Door to Deeper Discounts A 4D close below 0.97 would be a structural shift. The yellow block turns from demand → supply, and the next leg down could unfold: Target 1: 0.54 Target 2: 0.30–0.40 Failure to hold 0.97 signals buyers are not yet ready to defend the macro trend. --- 📌 Market Structure & Pattern Insight NEAR is currently within a descending structure, but approaching macro demand capable of ending this pattern. This zone may become the foundation for a large Double Bottom, or a full trend breakdown if it fails. This is a decision point that will define NEAR’s direction entering 2026. --- #NEAR #NEARUSDT #Crypto #PriceAction #SupportZone #DemandBlock #CryptoAnalysis #MarketStructure
$NEAR/USDT ANALYSIS
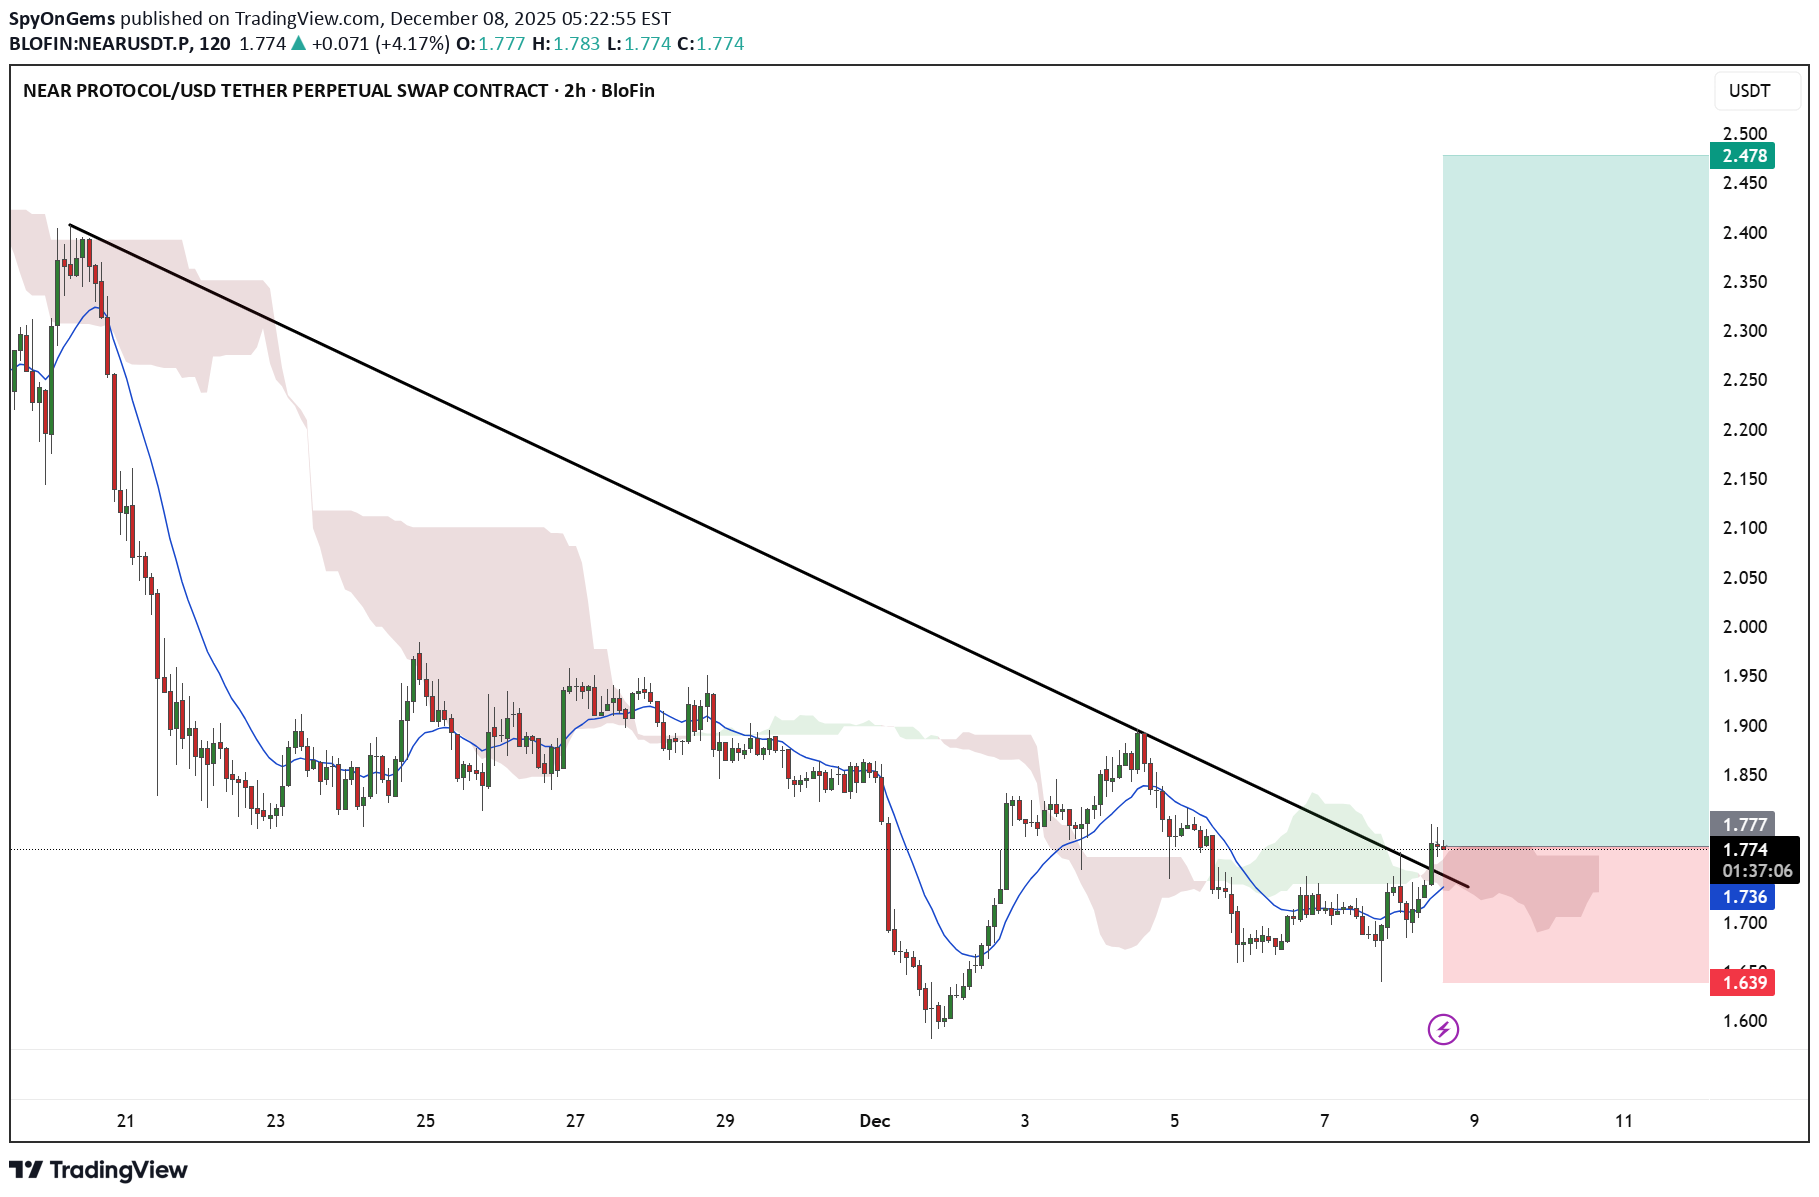
NEAR/USDT on the 2-hour chart is trading at 1.77 and has just broken above the descending trendline, showing the first sign of bullish strength after a long downtrend. Price is holding above the short-term moving average, and candles are trying to sustain the breakout level which is acting as fresh support. If the price remains above this trendline and the moving average continues supporting, momentum can slowly push towards higher levels, but if it fails to hold above the breakout zone then weakness may return back toward the previous lows.
تحلیل هفتگی NEAR: آیا حمایت چندساله خواهد شکست؟ (سیگنالهای حیاتی)
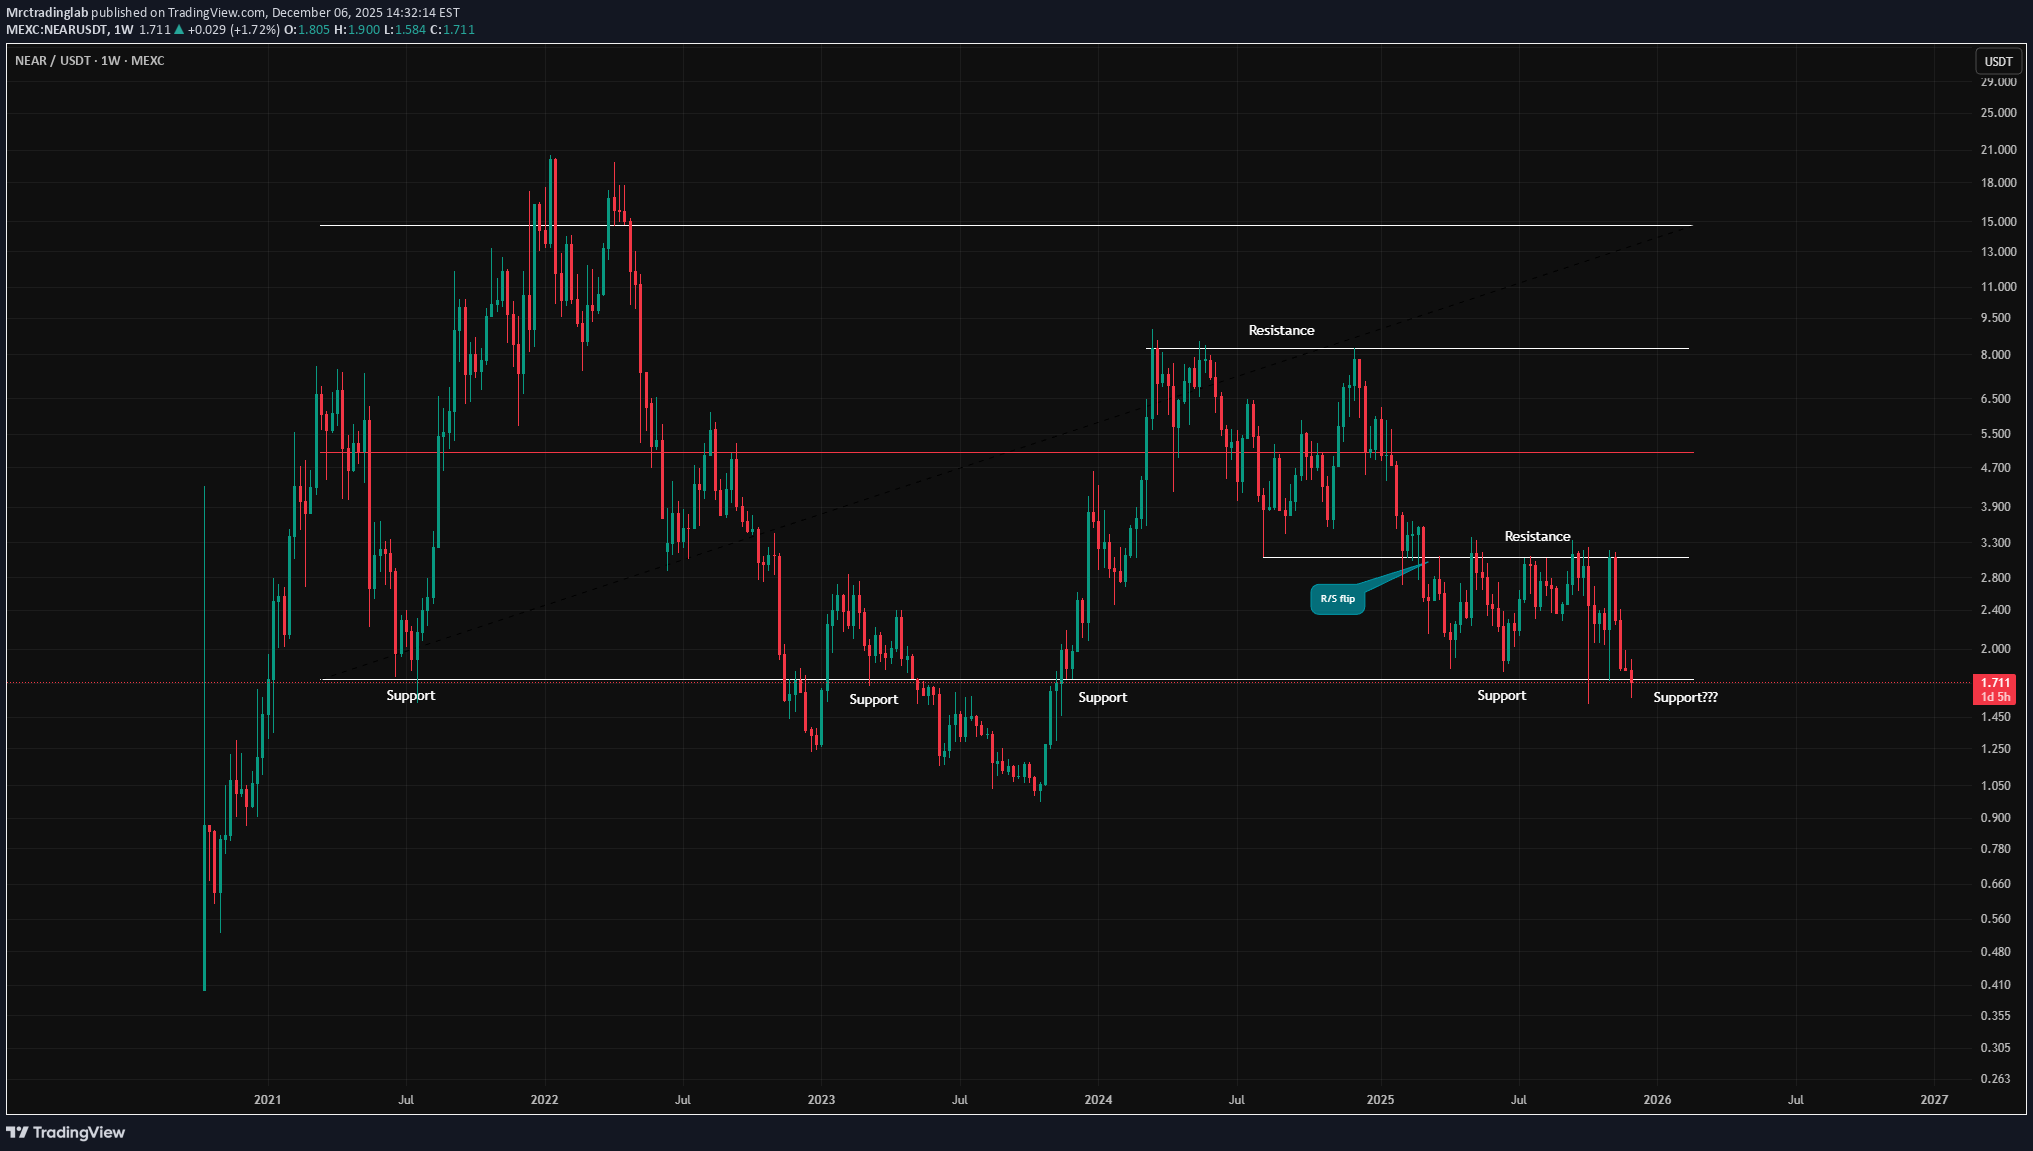
NEAR is sitting on a major multi-year support… but buyers are not showing strength yet. We’ve seen this level hold several times in the past, but the current weekly structure is still bearish. Here’s what I’m watching 👇 🔹 Support: Price is testing the same zone that acted as support multiple times over the years. A clean weekly close below could open room for deeper downside. 🔹 Market Structure: Lower highs + repeated taps on support = weakening demand. 🔹 Key Signal: If this support breaks, the next move could come fast. If it holds, we might see a strong reaction bounce. Monitoring on the lower TF voor deviation. I’m not rushing into any positions here — especially while my bias on the Total Market Cap remains bearish (see my previous post). Staying patient until the weekly candle gives a clear signal. Discipline first, always. MrC

iMoneyTeam
تحلیل تکنیکال NEAR: سیگنال خرید قوی در منطقه تقاضای کلیدی!
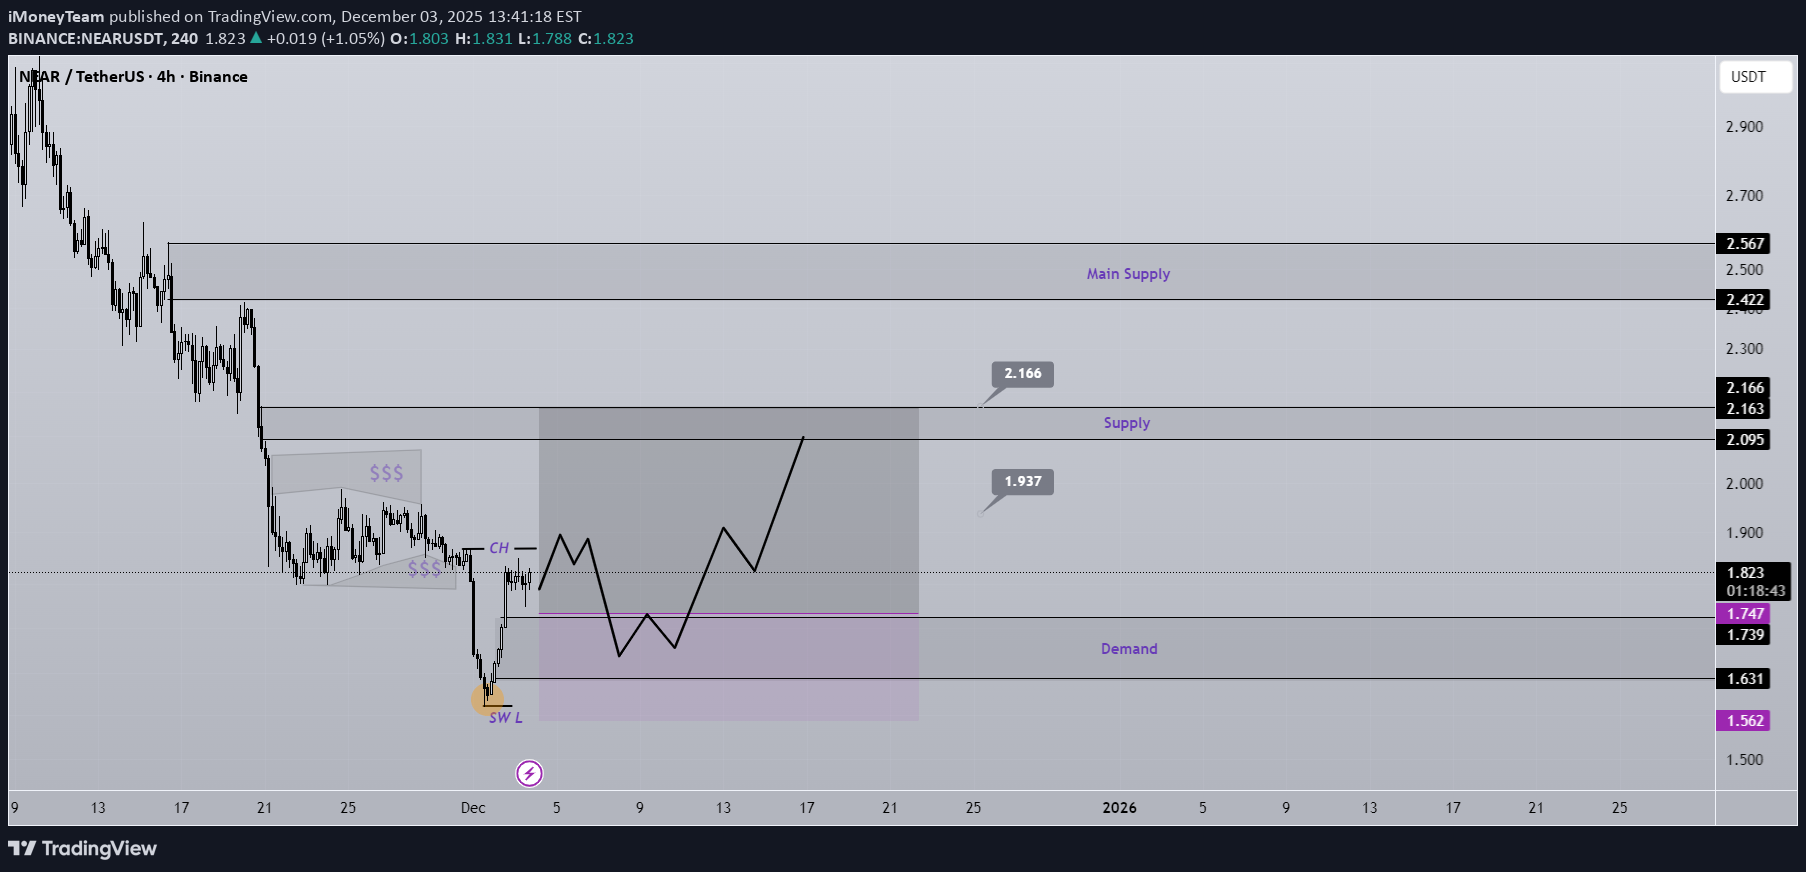
In the orange circle, liquidity has been swept, and the price has reacted to a strong historical demand zone. After the change of character (CH), we can enter a buy/long position on the pullback. The targets are marked on the chart. If the stop-loss is touched, the setup will be invalidated. Do not enter the position without capital management and stop setting Comment if you have any questions thank you

ceciliones
فومو NEAR! کف قیمت ارز نئو (NEAR) کجاست؟ زمان ورود به خرید!
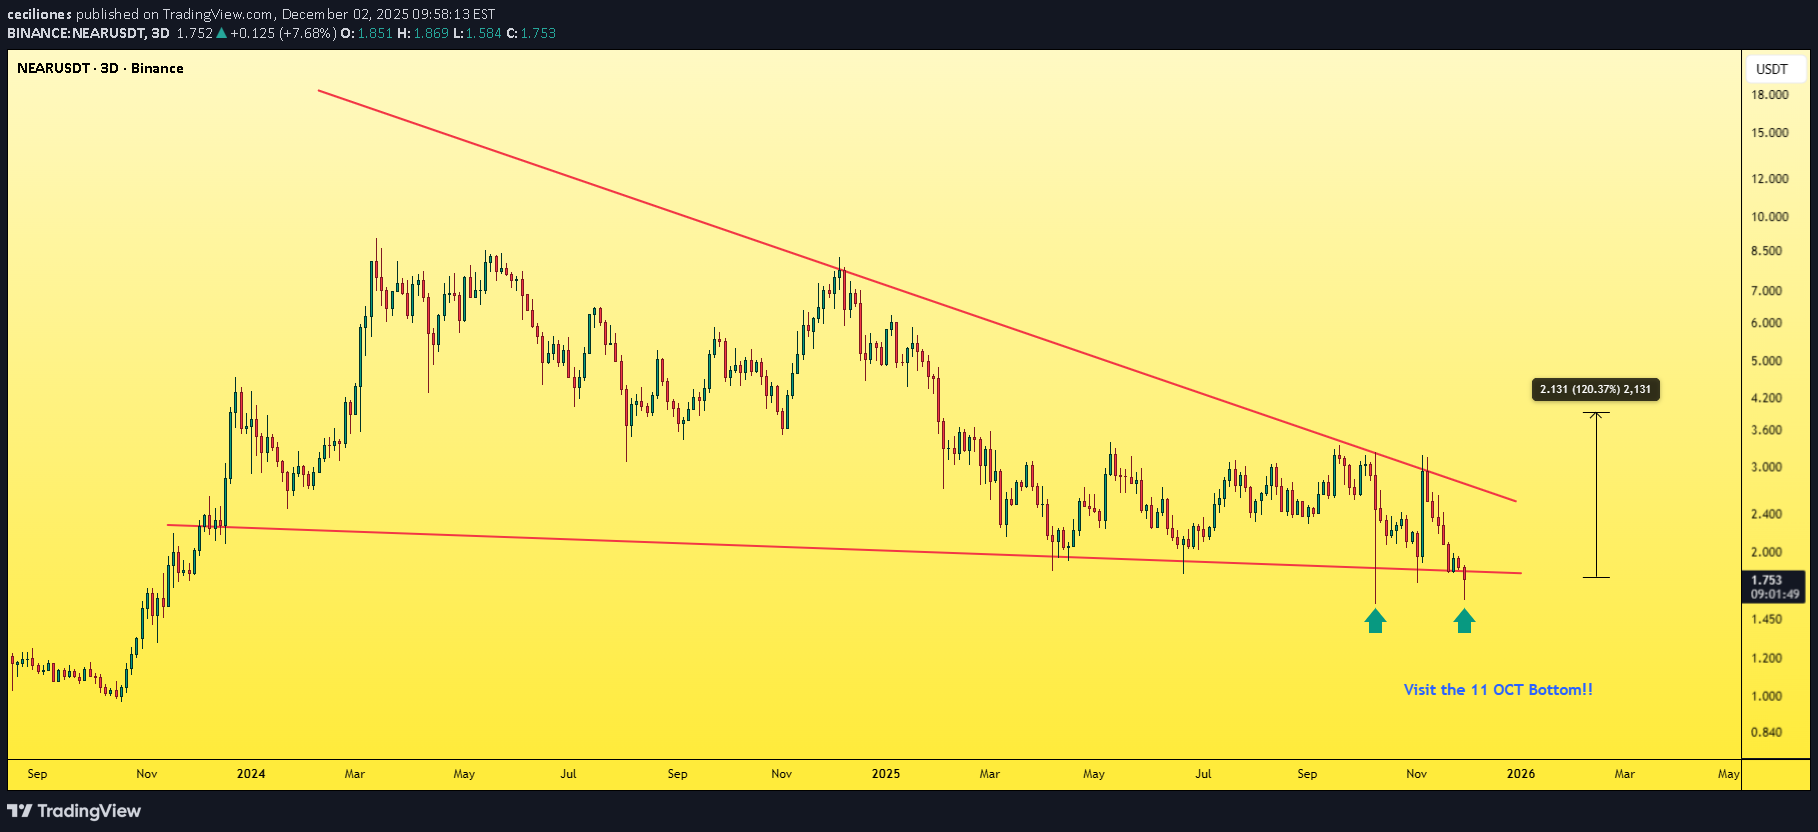
NEAR is pumping hard right now — honestly I really like its price action. Remember the post where I explained how to enter a successful futures setup? I’ll attach it below for you, take a look at it. NEAR is showing the same pattern from the Ceciliones futures methodology : -It’s a strong coin with a solid market cap. -It formed a bearish pattern and is giving a bearish signal suggesting a drop. -A lot of traders are hunting for the “perfect” short entry. -Almost everyone who was long either closed or got liquidity-grabbed. -Spot holders got hit hard and exited with losses. This creates the perfect environment for an upside move — remember what I’m telling you. Add it to your watchlist: the coin is currently at the bottom, fear levels are at their peak, and that’s exactly the kind of environment that fuels a bull run. Keep your eye on NEAR — you won’t regret it. Best Regards: Ceciliones🎯
vf_investment
خرید NEAR/USDT: سیگنال انفجاری صعودی بر اساس واگرایی مخفی!
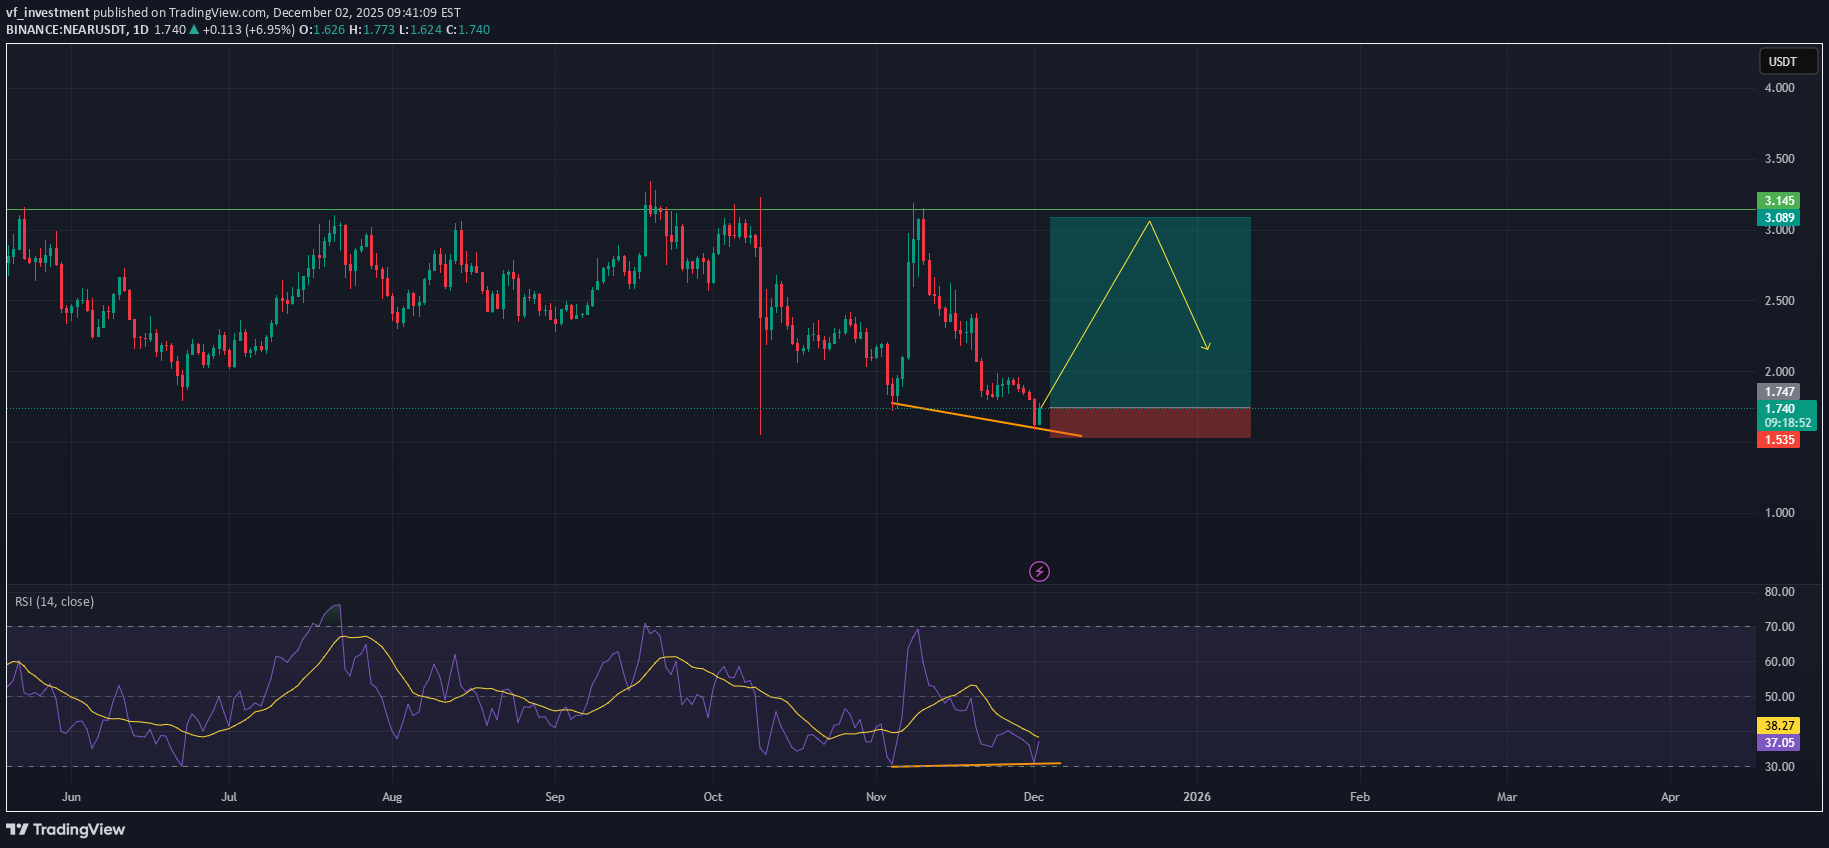
hi traders This trading idea is based on the Daily chart for the NEAR/USDT pair, identifying a strong reversal signal suggesting a significant bounce from a key support zone. Key Technical Observations Bullish Divergence: A clear Bullish Divergence has been established between the price and the Relative Strength Index (RSI). Price Action (Top Panel): The price is making lower lows (descending orange trendline), indicating continued selling pressure. RSI (Bottom Panel): The RSI is making higher lows (ascending orange trendline), suggesting that the downward momentum and selling strength are weakening despite the price continuing to drop. Interpretation: This divergence is a high-probability signal that the downtrend is exhausted and a reversal is imminent. Entry Zone at Key Support: The current price is near the critical psychological and structural support level around $1.76 to $1.80. The red box marks a tight risk area below this support. Trading Strategy Trade Bias: Long (Buy) Entry Zone: The green buy box indicates the entry range around the current price, with the ideal execution being within the $1.76 - $1.85 area, as the divergence confirms the potential bottom. Stop-Loss (Red Zone): A Daily close below the structural low at $1.530 would invalidate the bullish divergence pattern and confirm a further breakdown. Target: The green target box aims for the previous resistance zone and local swing high at $3.145 (marked by the green horizontal line). This target offers a substantial Risk/Reward ratio. Summary NEAR/USDT is presenting a powerful reversal setup on the Daily timeframe. The confirmed Bullish Divergence indicates that sellers are losing control, making the current price a high-probability accumulation zone before a projected bounce toward the $3.145 resistance level.

DAY11
الگوی گُوِه نَشراننده (Broadening Wedge) در NEAR: فرصتهای معاملاتی شگفتانگیز!
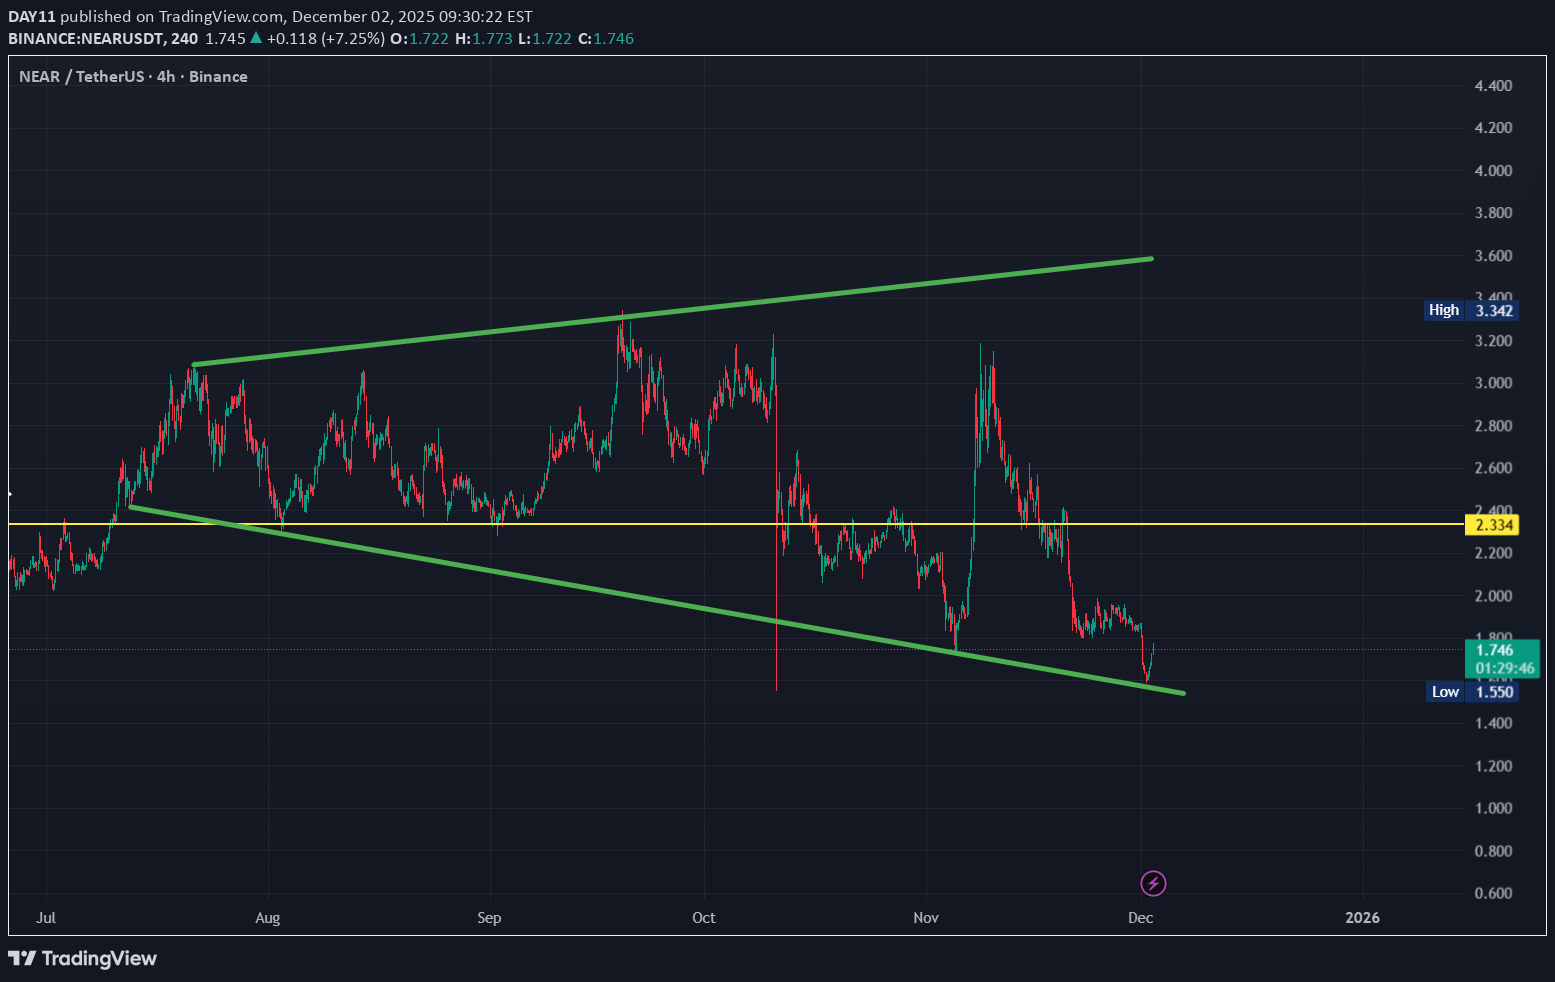
#near NEAR is forming broadening wedge pattern in the 4h time frame . Lets know about it- Broadening wedges can be either bullish or bearish depending on how they form within an existing trend. There are some clues in the pattern itself that suggest whether the market is likely to continue the same trend or reverse. Here we can trade these chart patterns as range trades between the highs and lows of the support/resistance lines. A broadening wedge forms when the price is holding between two diverging trend lines. The upper line is resistance and the lower line is support. When the broadening wedge is aligned horizontally, the price makes higher highs at the top and lower lows at the bottom. Broadening wedge patterns can also be sloping upwards or downwards. These are known as ascending broadening wedges and descending broadening wedges. Trade set up - (within the pattern) Long- $1.71 Stop Loss-$1.4 Take Profit1-$1.93. Take Profit2-$2.33. Take Profit3-$2.99. Take Profit4- $3.38.
Disclaimer
Any content and materials included in Sahmeto's website and official communication channels are a compilation of personal opinions and analyses and are not binding. They do not constitute any recommendation for buying, selling, entering or exiting the stock market and cryptocurrency market. Also, all news and analyses included in the website and channels are merely republished information from official and unofficial domestic and foreign sources, and it is obvious that users of the said content are responsible for following up and ensuring the authenticity and accuracy of the materials. Therefore, while disclaiming responsibility, it is declared that the responsibility for any decision-making, action, and potential profit and loss in the capital market and cryptocurrency market lies with the trader.