
ceciliones
@t_ceciliones

What symbols does the trader recommend buying?
Purchase History
پیام های تریدر
Filter
ceciliones
فومو NEAR! کف قیمت ارز نئو (NEAR) کجاست؟ زمان ورود به خرید!
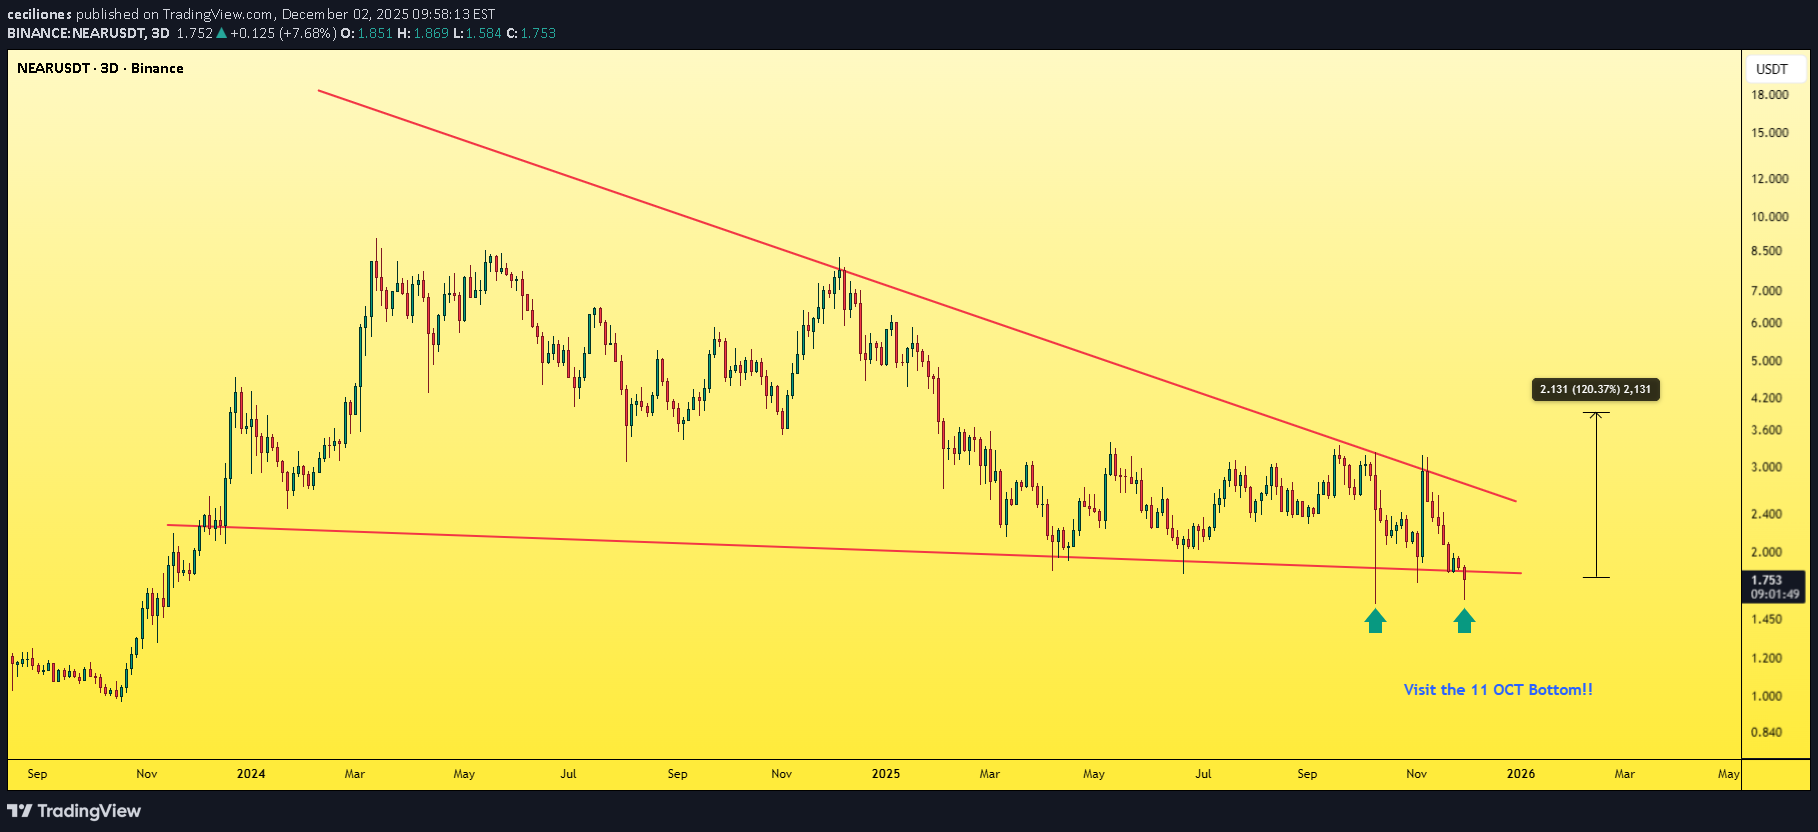
NEAR is pumping hard right now — honestly I really like its price action. Remember the post where I explained how to enter a successful futures setup? I’ll attach it below for you, take a look at it. NEAR is showing the same pattern from the Ceciliones futures methodology : -It’s a strong coin with a solid market cap. -It formed a bearish pattern and is giving a bearish signal suggesting a drop. -A lot of traders are hunting for the “perfect” short entry. -Almost everyone who was long either closed or got liquidity-grabbed. -Spot holders got hit hard and exited with losses. This creates the perfect environment for an upside move — remember what I’m telling you. Add it to your watchlist: the coin is currently at the bottom, fear levels are at their peak, and that’s exactly the kind of environment that fuels a bull run. Keep your eye on NEAR — you won’t regret it. Best Regards: Ceciliones🎯
ceciliones
STRK: ستارهای که تازه طلوع کرده! (پیشبینی انفجاری 3 برابری قیمت)
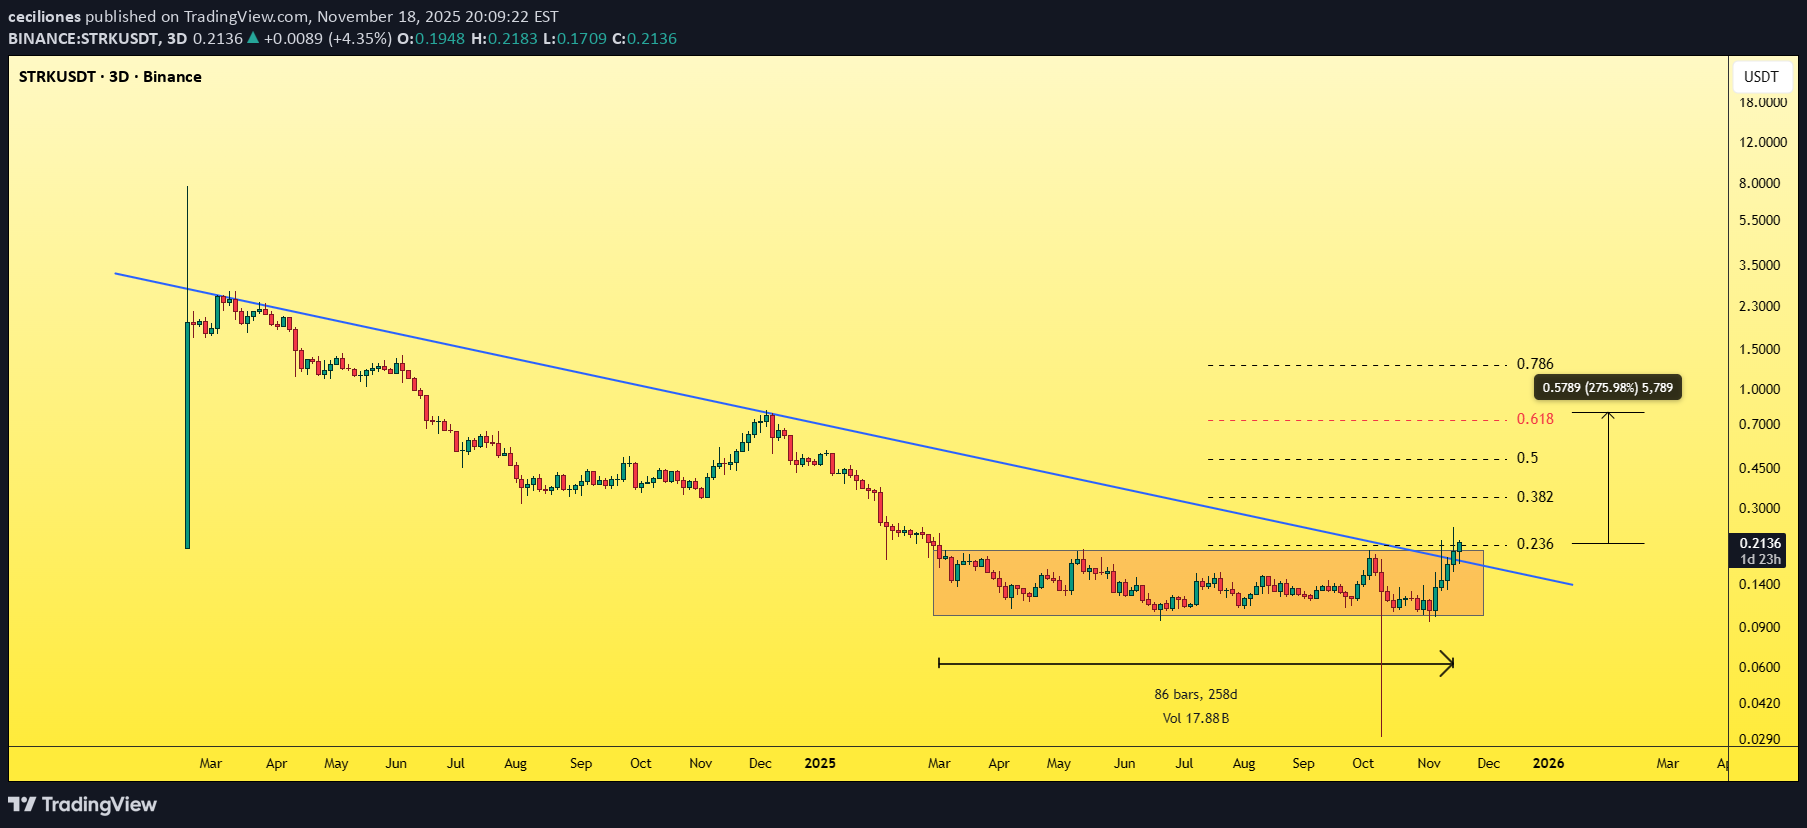
Let me introduce you to the new rising star that’s about to steal the spotlight: STRK. The coin has been pumping like crazy for the past few days, but once you zoom out and check the chart, you’ll see that this is just the beginning — a clean breakout from a 258-day accumulation range. Not only that, but it also broke the long-term descending trendline (from day one of the project) and successfully retested it. I’m not exaggerating when I say the minimum target lies around the 0.618 Fibonacci level, which is roughly a 3× move from the current price. Best Regards: Ceciliones🎯
ceciliones
DASH/USDT: آماده جهش بزرگ؟ احتمال صعود تا بالای ۱۸۰ دلار!
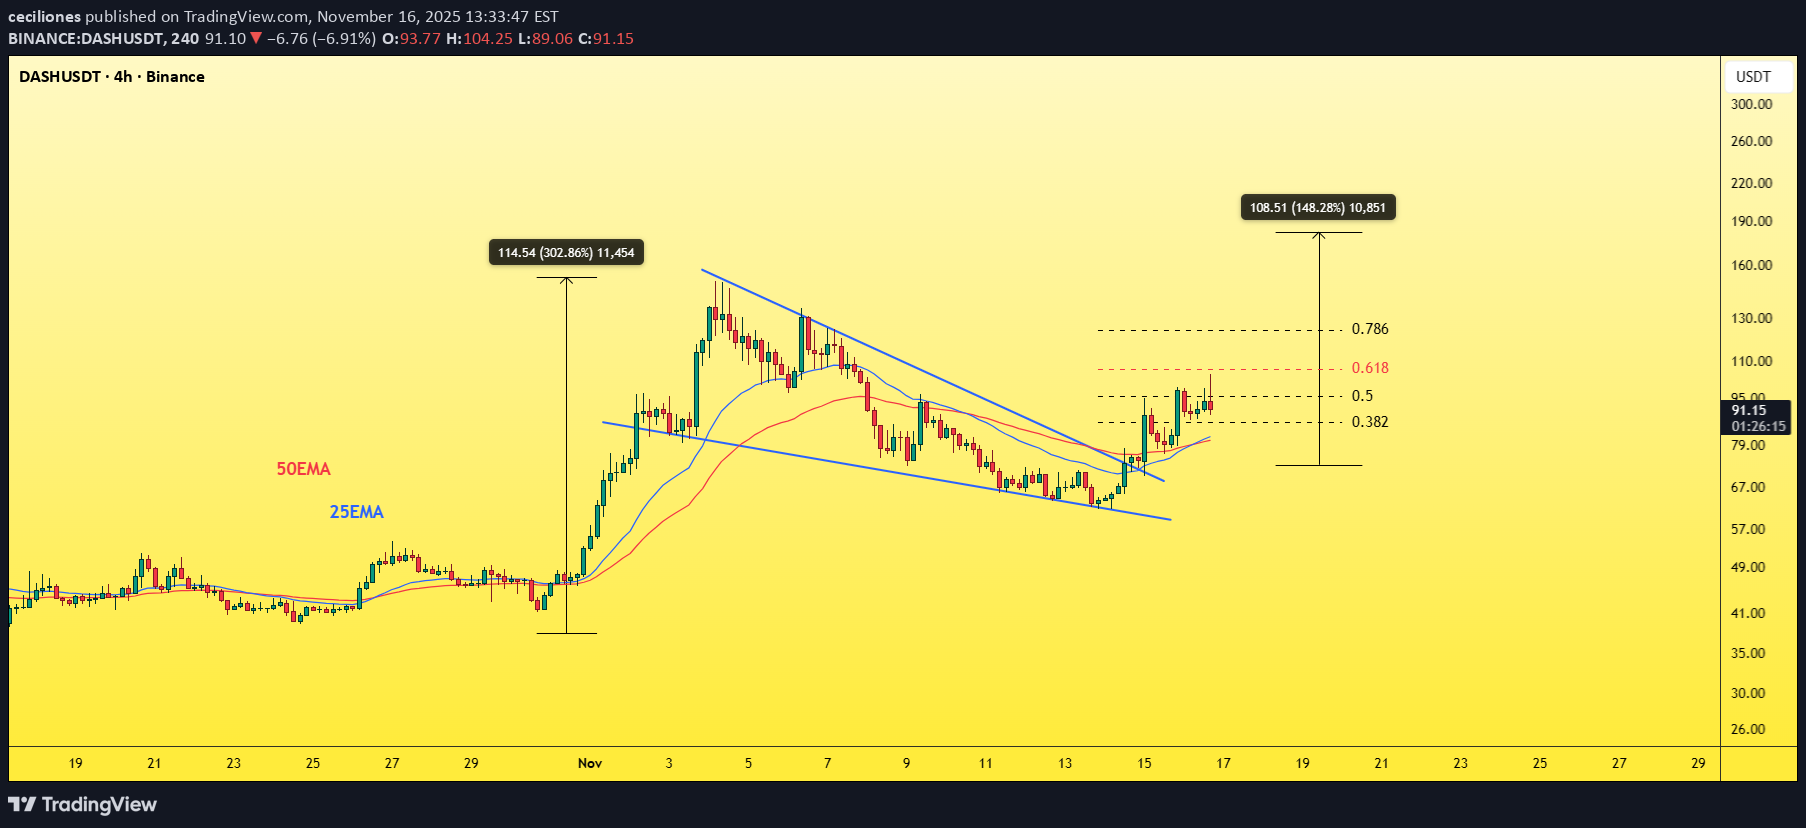
DASH has gained over 300% in the past few weeks and is now in a healthy correction. It formed a consolidation and a falling wedge pattern, which it broke and successfully retested. It’s starting to climb again. A golden cross has formed, which should give it the momentum to break the 0.618 Fibonacci resistance, potentially pushing it past the $180 level Best Regards: Ceciliones🎯
ceciliones
جشنواره دستکاری بیت کوین: پیشبینی شوکهکننده سقوط و پایان بازی تریدرها!
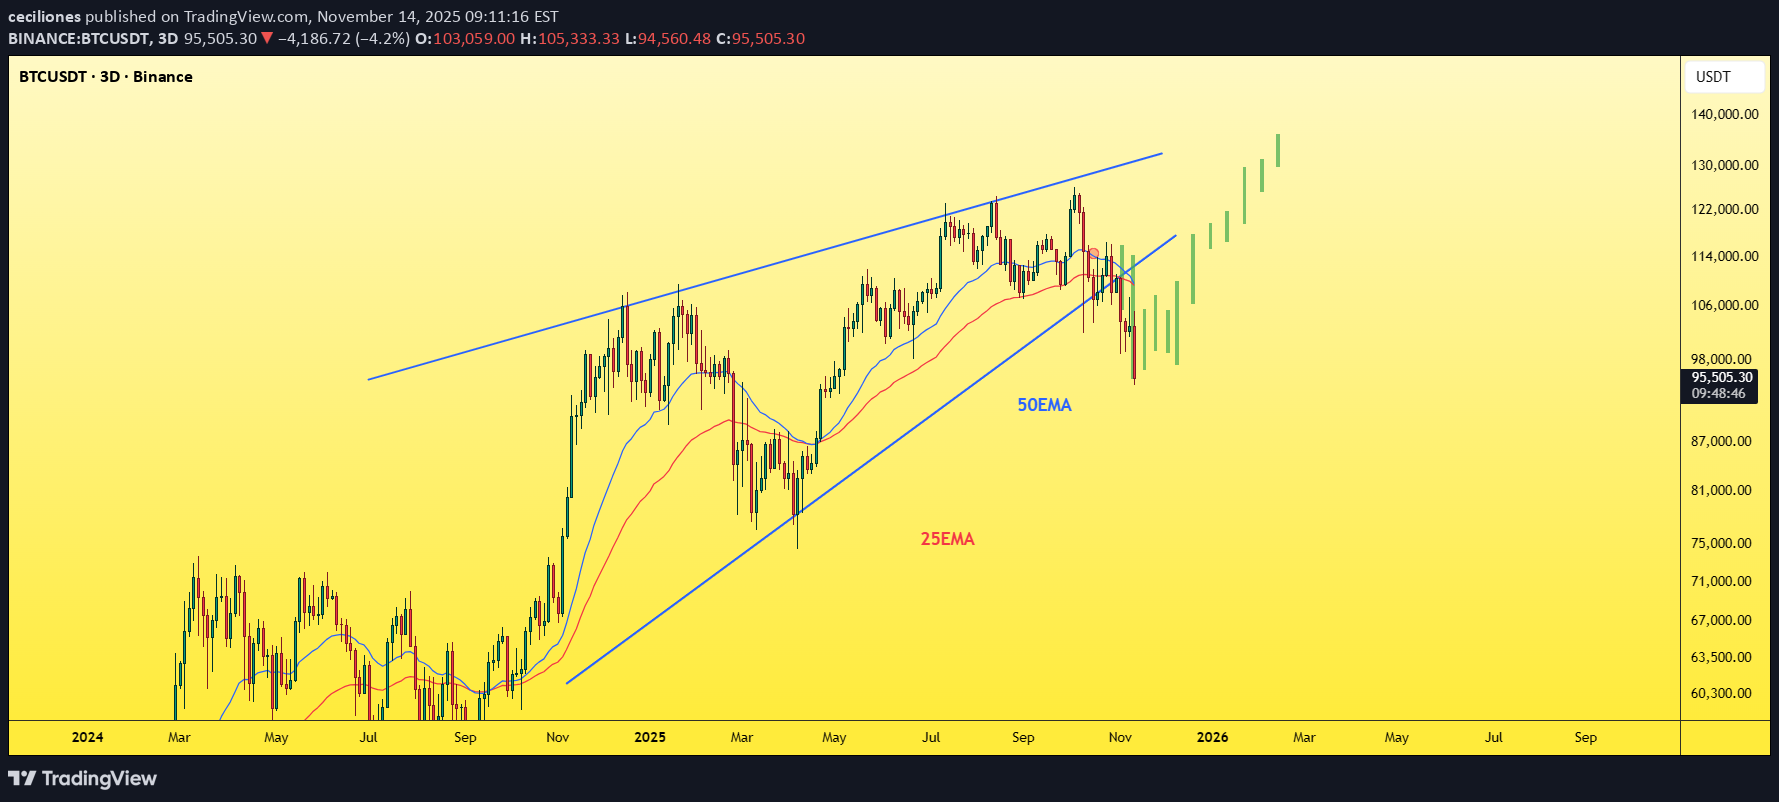
Bitcoin has already formed a rising wedge pattern, broke it downward after retesting it, and continued falling, even breaking below 100K just like you wanted? There’s also a death cross forming on the chart… and from here I’ll just sit back and watch the manipulation festival. Bitcoin never forms a bearish pattern and hits its targets the way people expect — not until it wipes out every type of trader first. And look at the candlestick formation I predicted; Bitcoin followed it exactly, to the millimeter, on the 3-day chart. The idea that Bitcoin is actually bearish and will drop more than this is a joke to me — something absurd. What about the people who have been holding short positions for the past 10 days? Nobody’s going to ask about them? It’s their turn now, of course… You’ve taken your profit and now you’re greedy for more downside? Come on, let’s liquidate all of you the same way we liquidated the long positions earlier, and the same way spot traders got shaken out. Let’s make everyone lose hope and exit the market. The market is built on manipulation, and technical analysis is just a tool to understand where that manipulation happens — nothing more. Study my candlestick projection carefully, because that’s exactly what’s going to happen in the coming days. And remember what I said. Best Regards: Ceciliones🎯
ceciliones
یونیتتر (UNI) در آستانه جهش بزرگ: راز ریتست حیاتی و هشدار ترید فیوچرز!
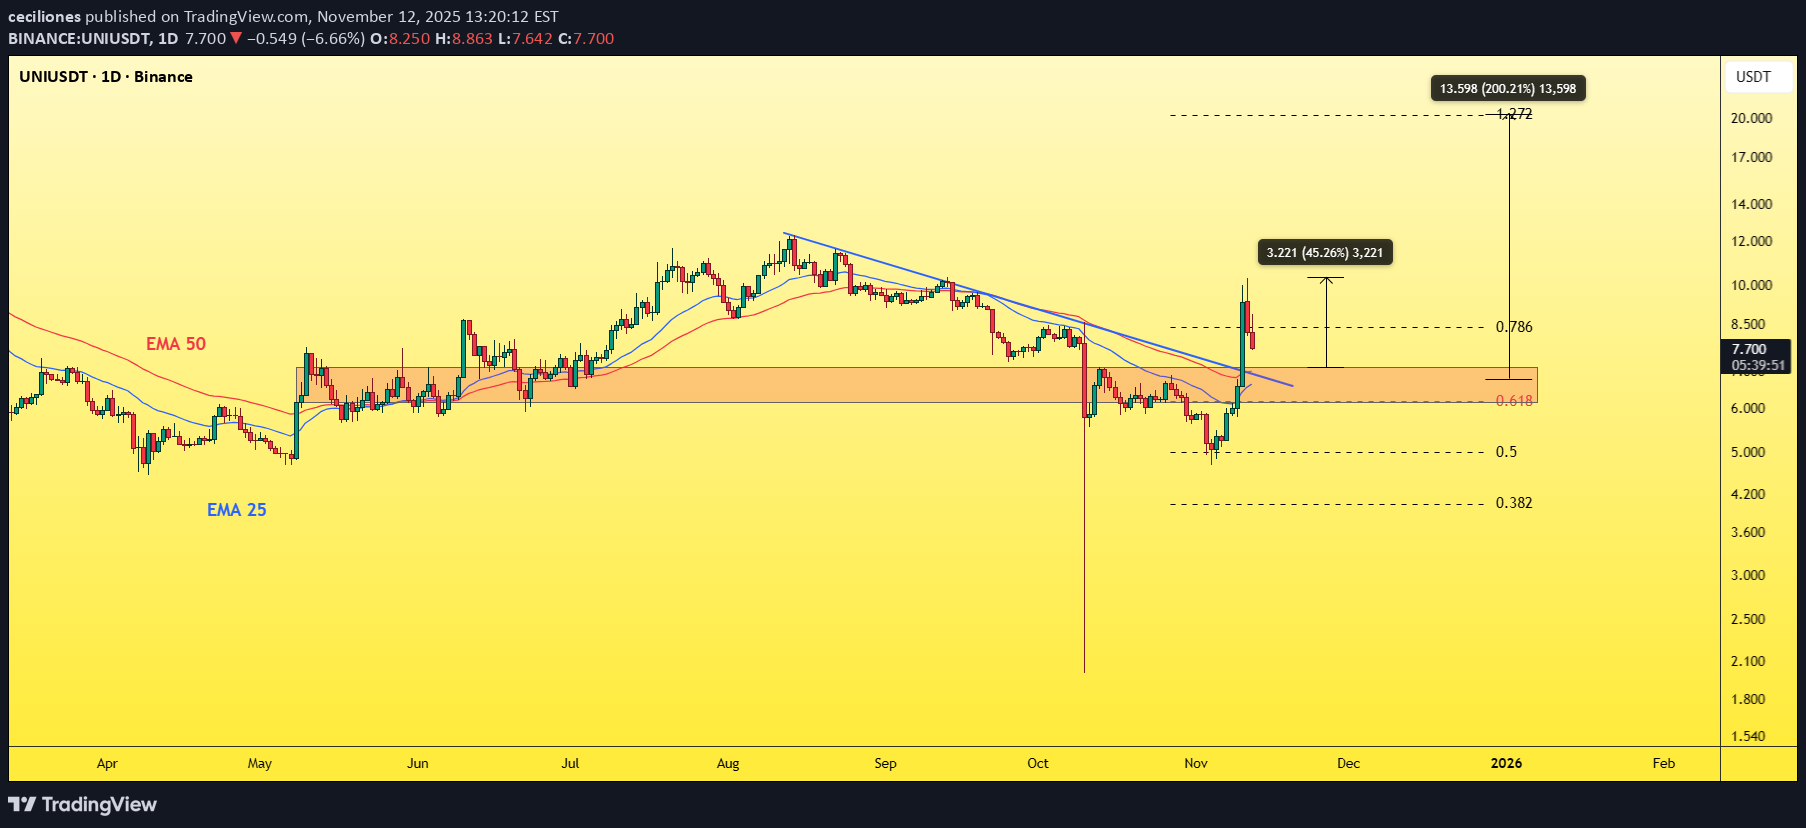
The coin skyrocketed 45% in a single daily candle right after breaking out of the red rectangle. That rectangle represents a major support zone on the chart — so as long as it’s pulling back, it’s likely just retesting that zone before starting a new bullish leg upward. This area lines up with the 0.618 Fibonacci level, plus both the 25 EMA and 50 EMA, which are getting ready to form a golden cross, and it also matches the descending trendline. ⚠️ Caution with futures trading though — market makers can easily play psychological tricks around this exact zone Best Regards: Ceciliones🎯
ceciliones
لایتکوین (LTC) در حال بیدار شدن است: آیا این هیولای بازار برای جهش ۱۰۰ درصدی آماده میشود؟
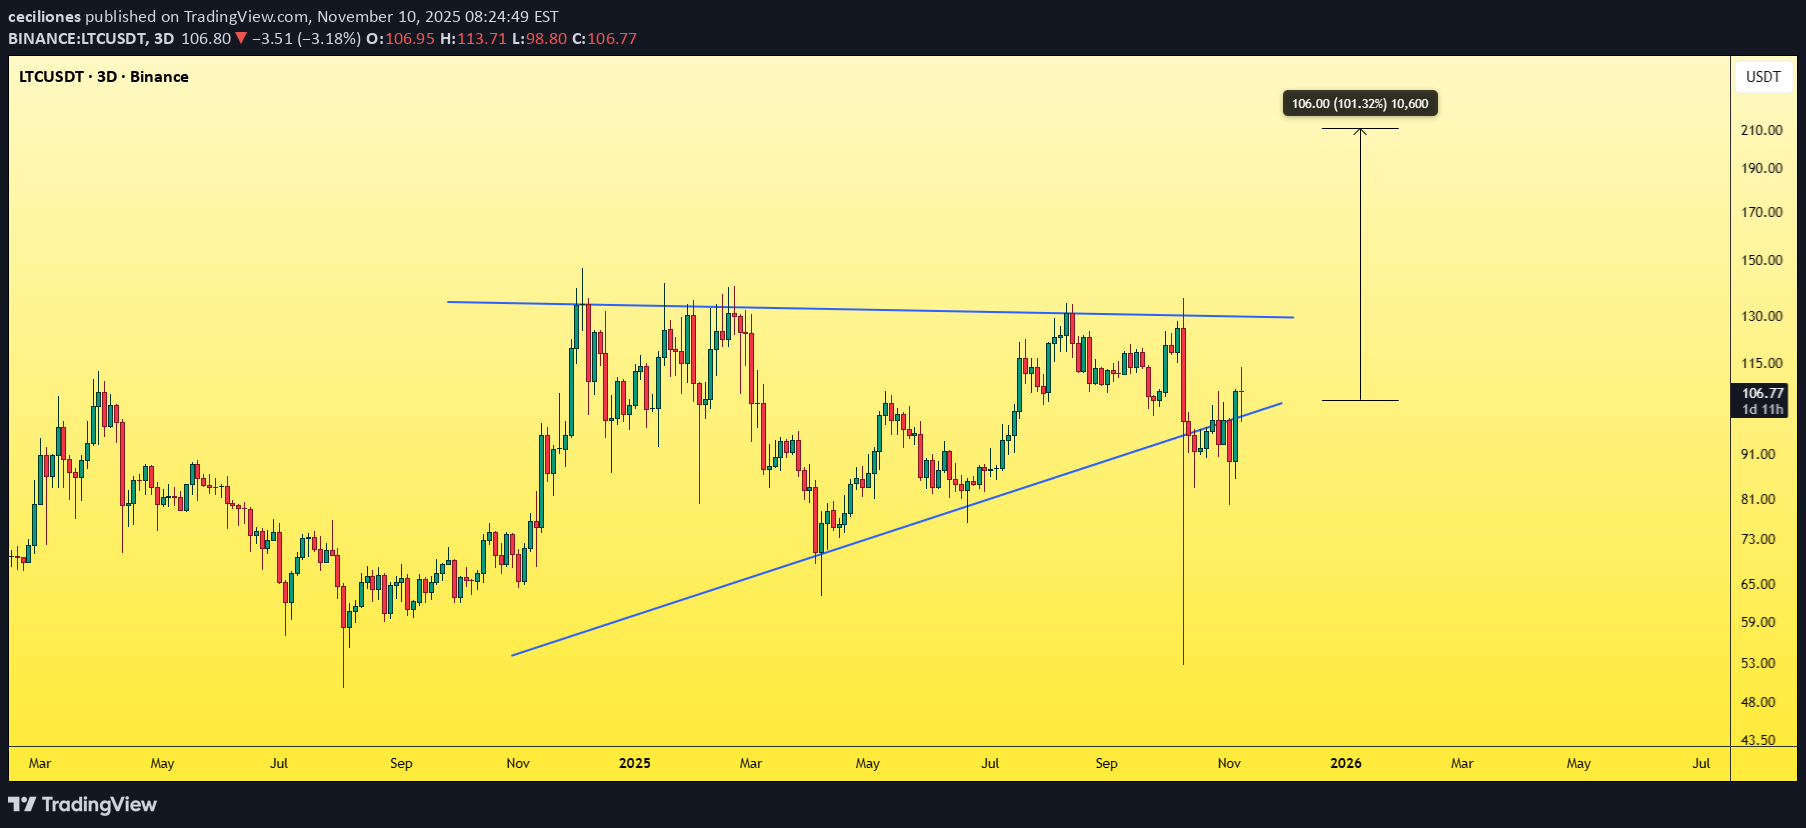
As usual, any popular coin like LTC tends to make you lose hope right before a major rally — it usually forms a bearish-looking triangle, breaks downward, and makes everyone think a bear market has started. Here’s how you know it’s actually preparing to pump: It gives a very bearish signal on the chart — spot traders panic sell at a loss, long traders get liquidated or trapped, and short traders start feeling confident right before price reverses and pumps hard. When everyone’s losing, that’s when the path upward becomes clear and safe. I believe a 100% move from here is the minimum we’ll see. Best Regards: Ceciliones🎯
ceciliones
فلوکس (FLUX) پس از جهش ۱۸۰ درصدی؛ آیا به زودی به ۱ دلار میرسد؟
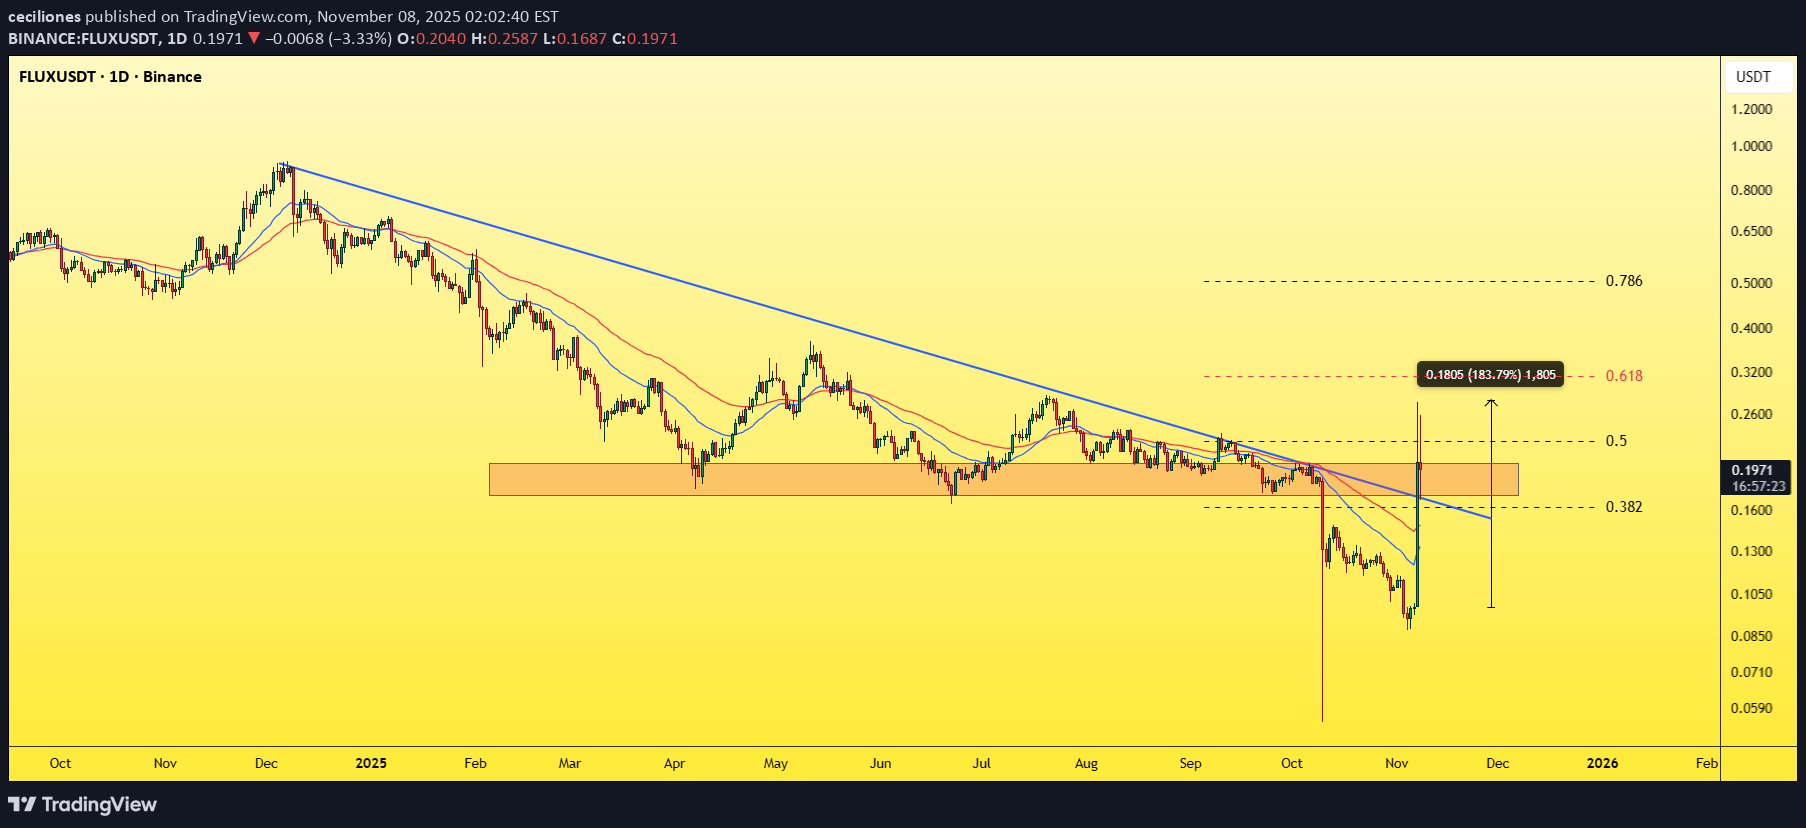
It broke a major trendline and pumped over 180% in a single candle — and this is just the beginning. Now it’s pulling back for a correction and getting ready for another series of impulsive bullish waves, similar to yesterday’s sudden rally. It’s on track to hit $1 very soon and with strong momentum — remember my words, just like every time before when the prediction played out perfectly. Best Regards: Ceciliones🎯
ceciliones
سیگنال انفجاری FILUSDT: الگوی گاوی عظیم و احتمال رشد ۳۰۰ درصدی!
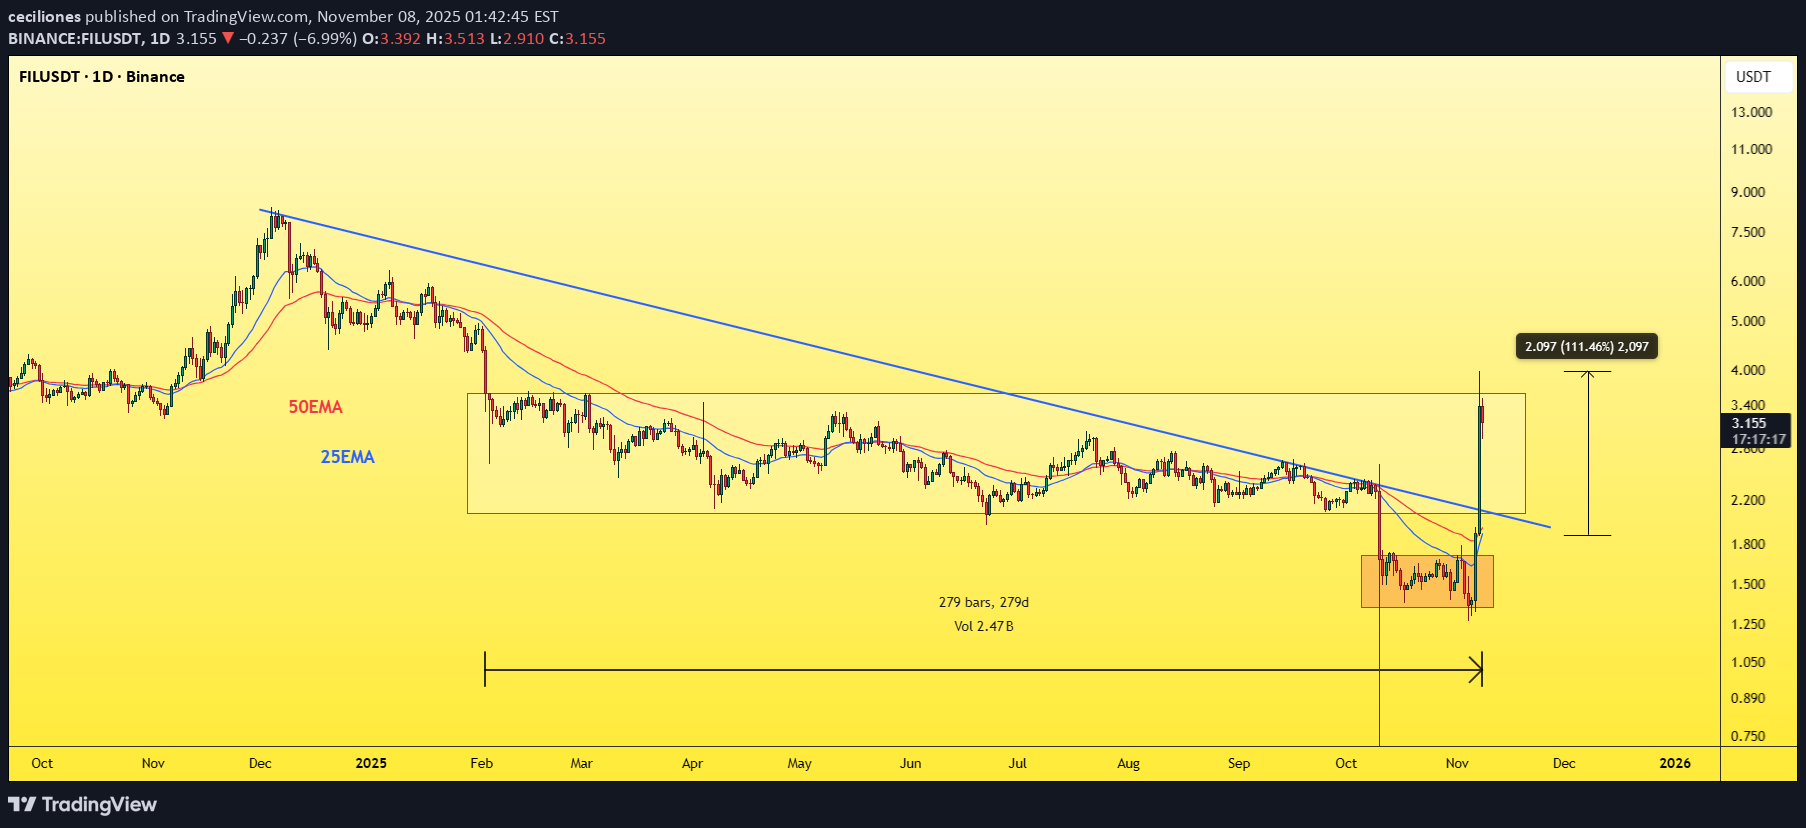
It broke the main trendline with a massive daily candle. A Golden Cross pattern is forming — the 25 EMA is about to cross above the 50 EMA, as you can see. The coin has been in accumulation for 276 days, initially breaking down to sweep liquidity, and now it’s trading back near that range. If it breaks upward, it could easily rally 300% or more from here. Best Regards: Ceciliones🎯
ceciliones
نزدیک به انفجار: راز خروج NEARUST از منطقه انباشت ۲۷۶ روزه!

Keep your eyes on it — it’s about to explode very soon. It’s currently sitting right on the trendline, and once it breaks through, that’ll give it the push it needs to break out of the accumulation zone it’s been forming for about 276 days. The EMA is preparing for a golden cross, and yesterday’s pump indicates a massive inflow of liquidity entering the market — a clear bullish signal showing strong buying pressure Try to get in while it’s still in the accumulation zone. Best Regards: Ceciliones🎯
ceciliones
پامپ ۱۶۰ درصدی ICP: آیا فرصت ورود طلایی برای رسیدن به ۳۰ دلار از دست رفته است؟
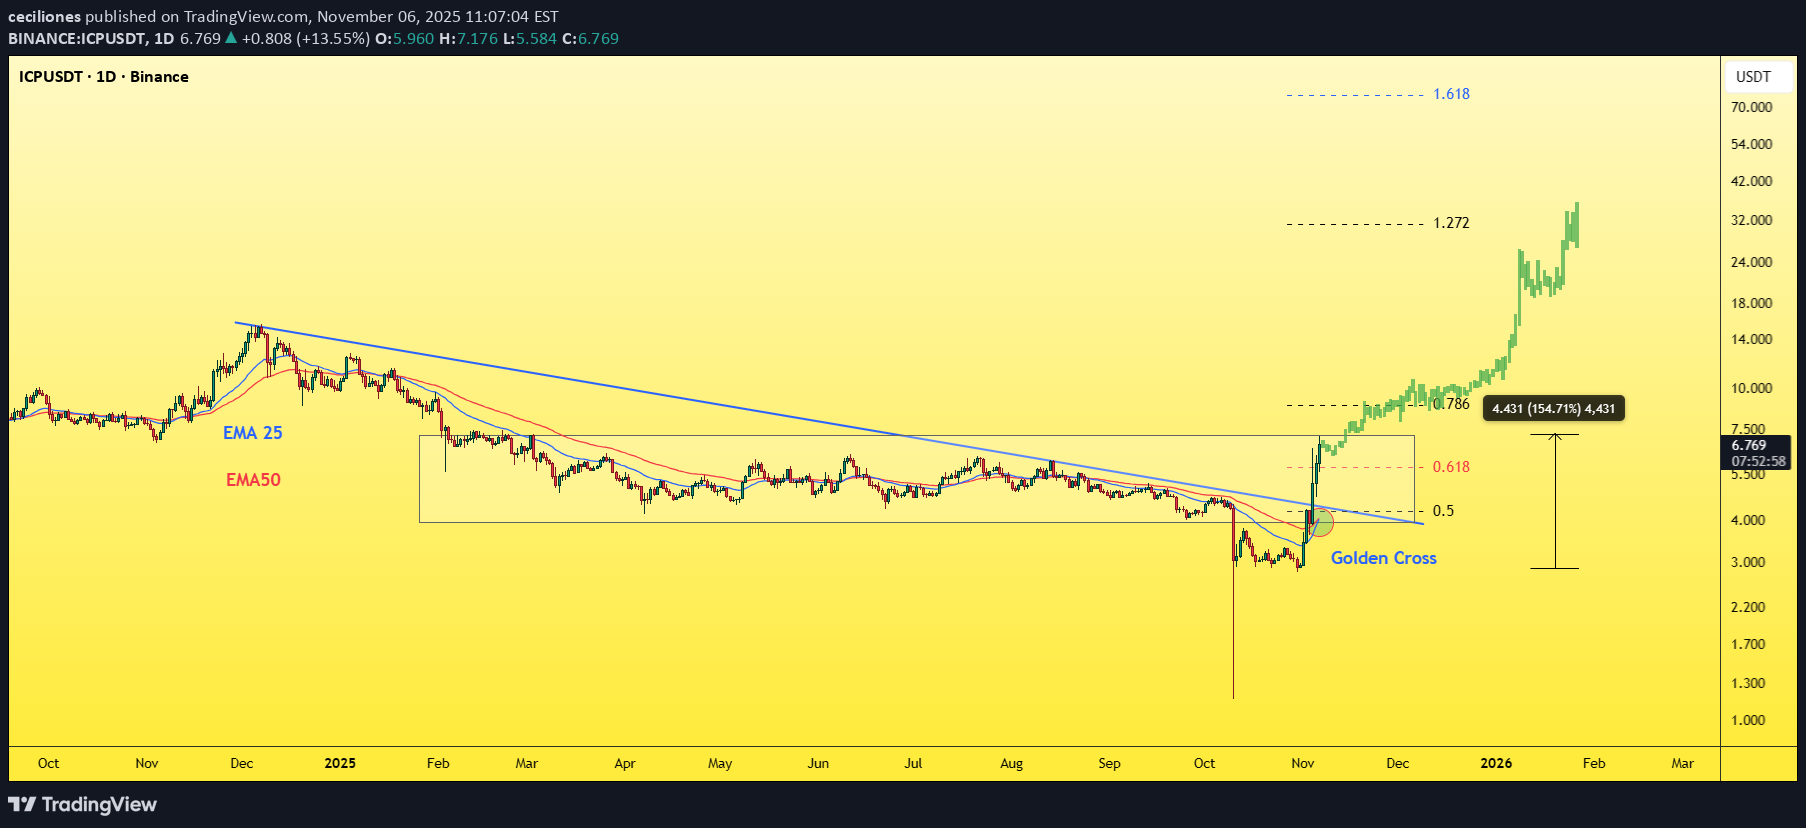
The coin ICP has pumped nearly 160% in just one week, and believe it or not — all that move happened without even breaking out of the accumulation range it’s been forming for over 275 days. So imagine what will happen once it finally breaks out! The high volume and bullish indicators on the chart suggest that this coin’s minimum target is around $30, meaning roughly a 5x potential from the current level. It has already broken above the 0.618 Fibonacci resistance, broken the main trendline (marked in blue), and even formed a Golden Cross pattern. It’s still inside the accumulation zone for now, so this is your early entry opportunity — because once it breaks out, you won’t catch it again. Mark my words. Best Regards: Ceciliones🎯breakout the accumulation zone with huge green candle ✅🔥 take a seat and watch the magic now👀
Disclaimer
Any content and materials included in Sahmeto's website and official communication channels are a compilation of personal opinions and analyses and are not binding. They do not constitute any recommendation for buying, selling, entering or exiting the stock market and cryptocurrency market. Also, all news and analyses included in the website and channels are merely republished information from official and unofficial domestic and foreign sources, and it is obvious that users of the said content are responsible for following up and ensuring the authenticity and accuracy of the materials. Therefore, while disclaiming responsibility, it is declared that the responsibility for any decision-making, action, and potential profit and loss in the capital market and cryptocurrency market lies with the trader.