
MOODENG
Moo Deng (moodengsol.com)
| تریدر | نوع سیگنال | حد سود/ضرر | زمان انتشار | مشاهده پیام |
|---|---|---|---|---|
No results found. | ||||
Price Chart of Moo Deng (moodengsol.com)
سود 3 Months :
سیگنالهای Moo Deng (moodengsol.com)
Filter
Sort messages by
Trader Type
Time Frame

$MOODENG
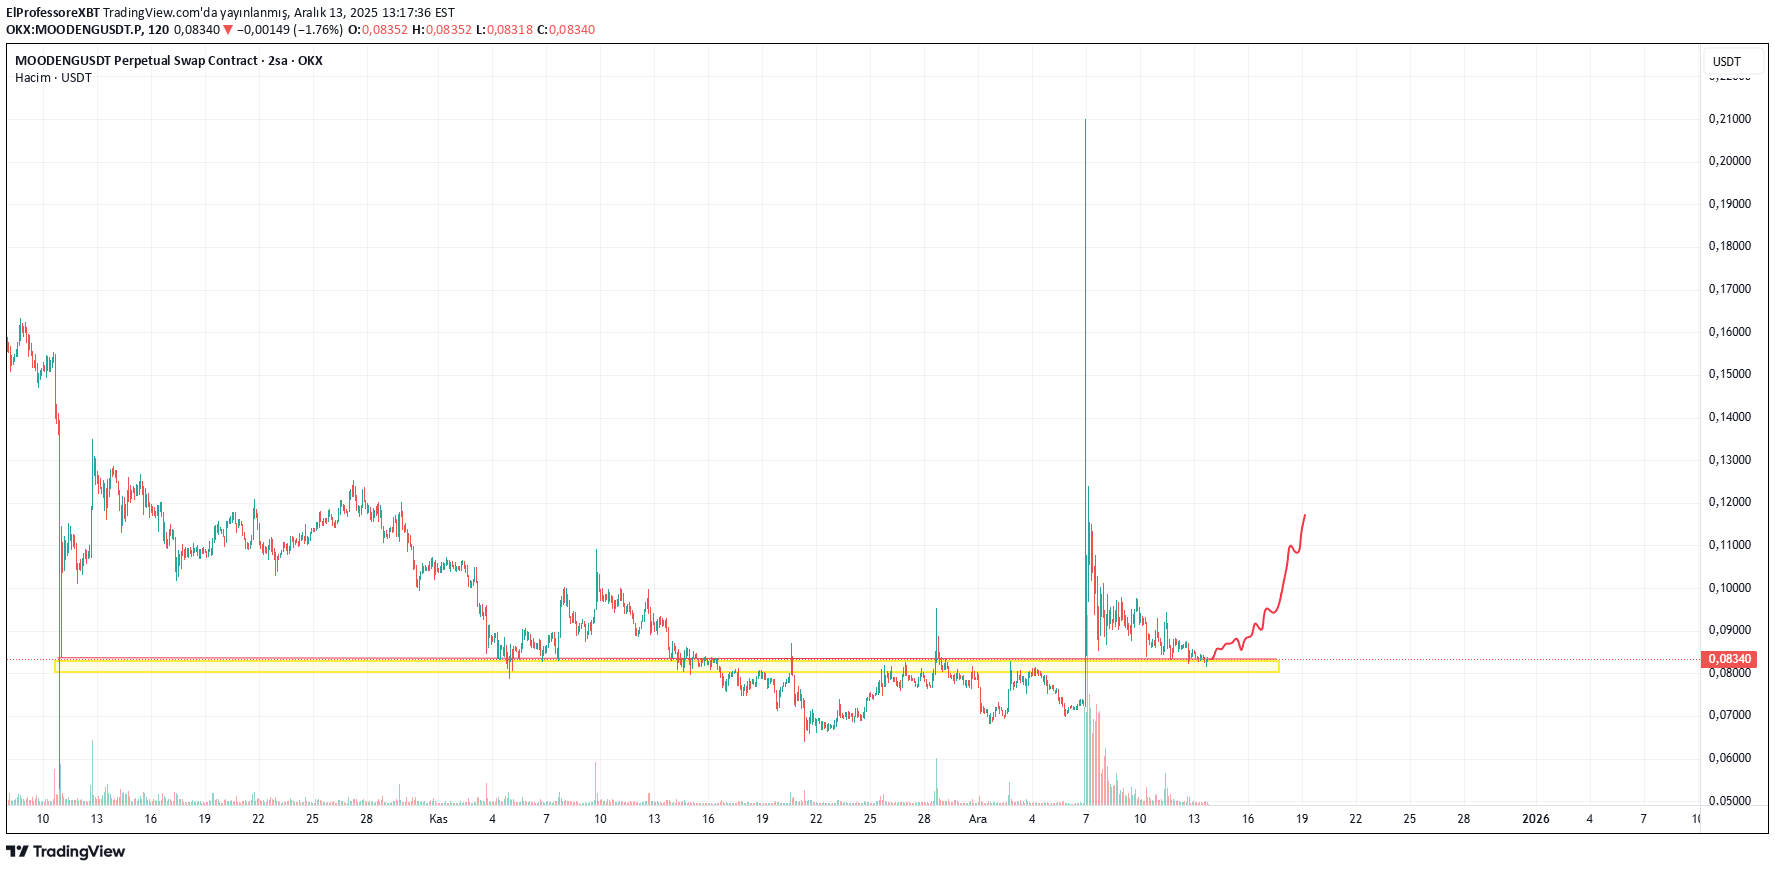
MOODENG — classic scam pump behavior, exactly as expected. After the initial hype-driven spike, price dumped hard and is now trying to fake strength around a weak support area. Low trust structure, high volatility, and obvious liquidity grabs. Any bounce here looks more like a temporary relief / exit pump rather than sustainable upside. Trade carefully — this is the kind of move where late buyers usually pay the price.

midyhkn
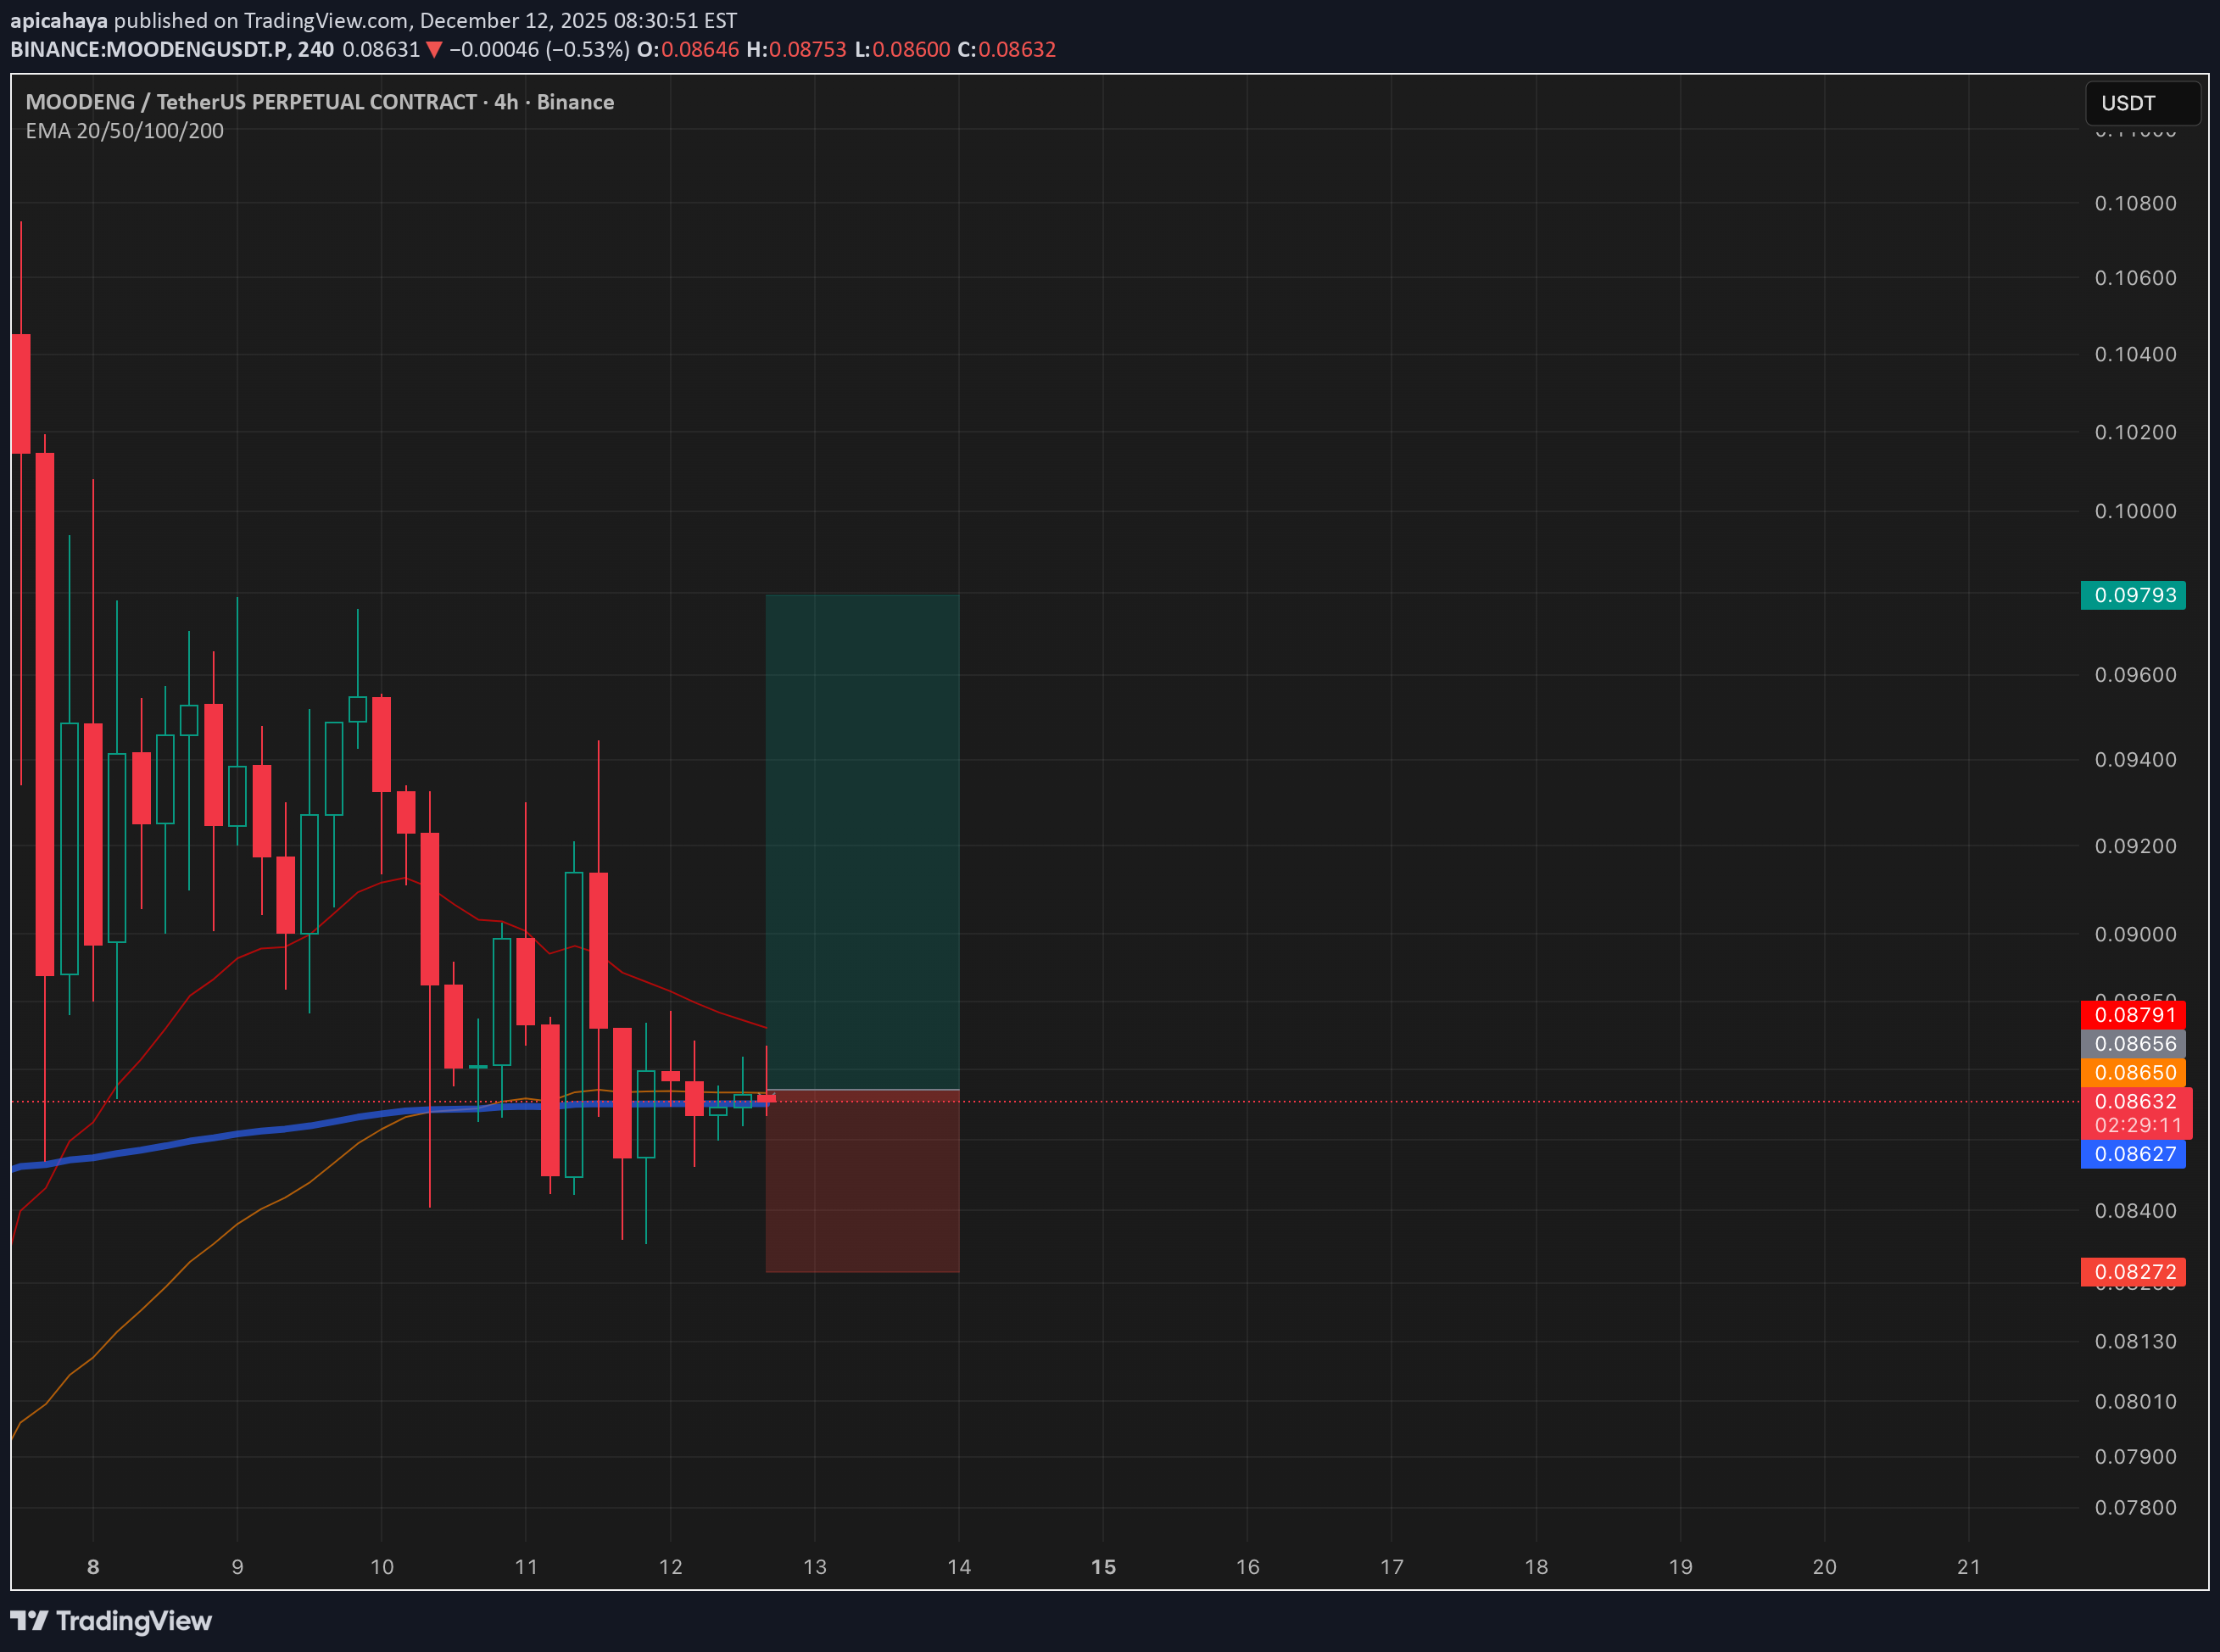
mooddengusdt güzel hedefleri olan birşey
I think the increase will continue and there are impressions that it will go to TP 1 and TP 2. It needs to fill the necessary places, my friend.

Tealstreet
الگوی قیمتی $PENGU تکرار میشود؟ آیا پنگوئن هم مثل MOODENG منفجر میشود؟
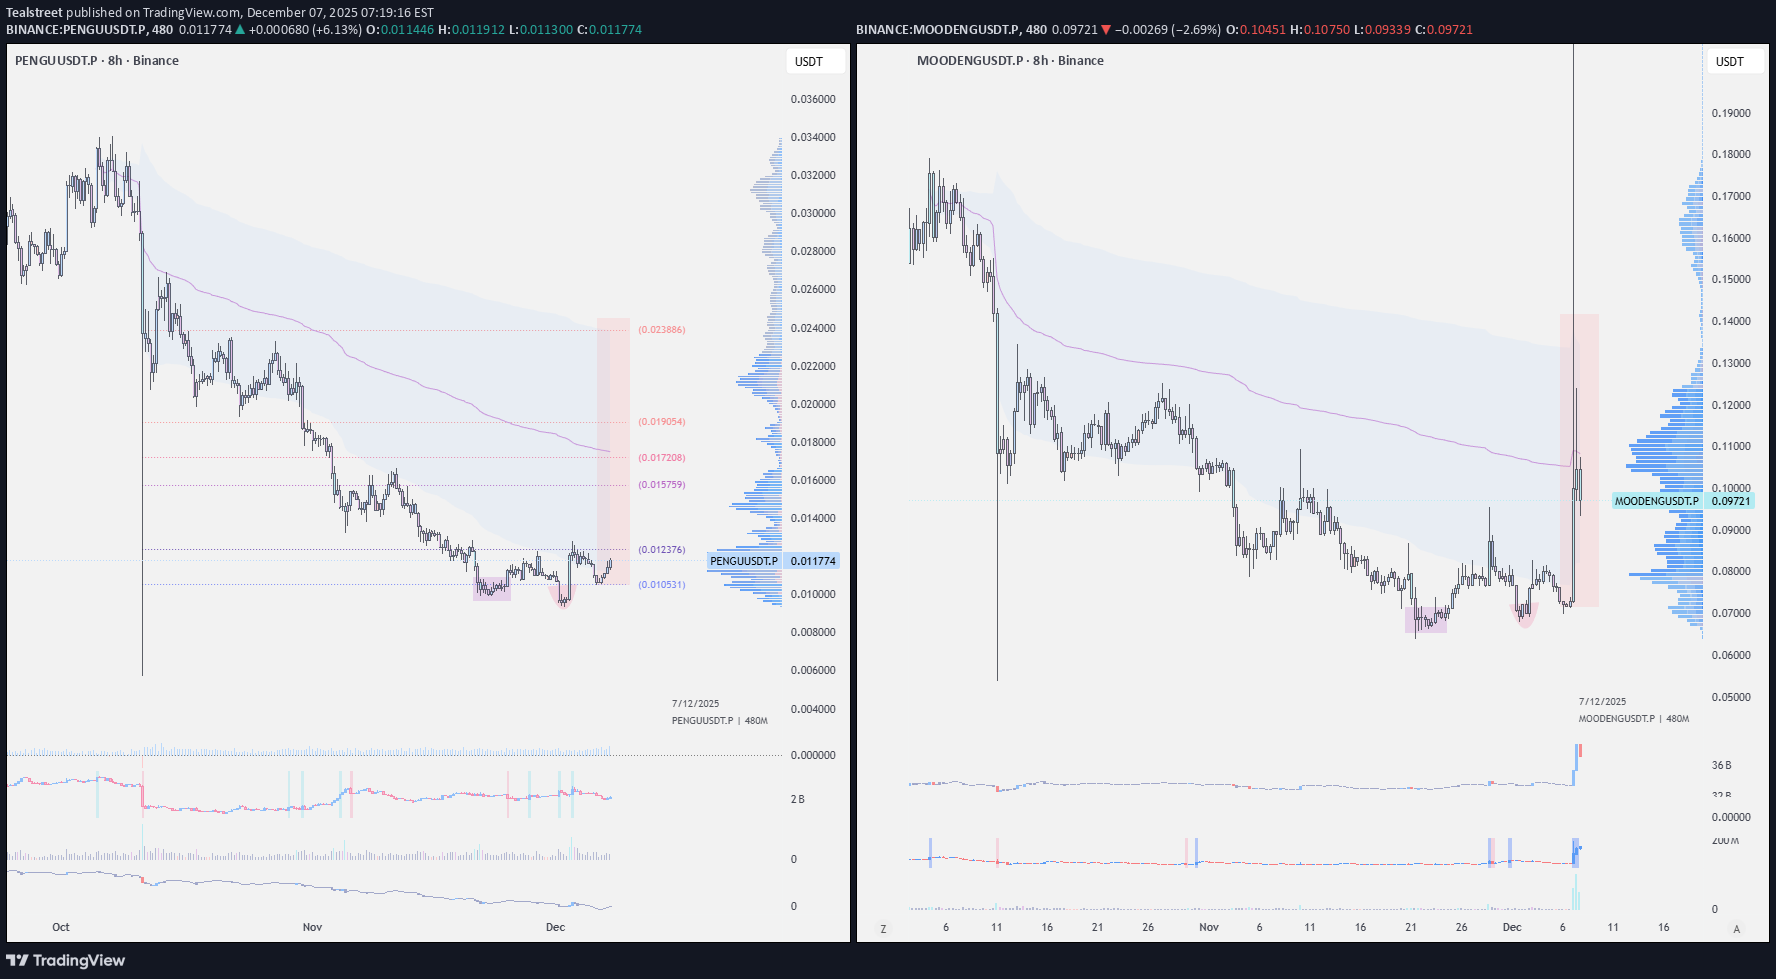
Memes are showing some relative strength. MOODENG climbed over 55% in the last 24 hours, lifted by renewed media buzz, a clean bullish breakout, and a heavy spike in volume. A sharp midday liquidity burst sent the price straight up. MOODENG carries strong speculative momentum, but as a pure memecoin, it remains highly volatile and driven by sustained hype. On the left chart is $PENGU , and the 8-hour fractals look almost identical to MOODENG’s price action. Will $PENGU follow the same playbook and shift into a parabolic micro-trend? If volume sustains, the next potential zone sits around $0.015–$0.020, with a possible wick toward $0.025-0.030.

Bithereum_io
سیگنال صعودی MOODENG: منتظر شکست مقاومتها برای جهش بزرگ باشید!
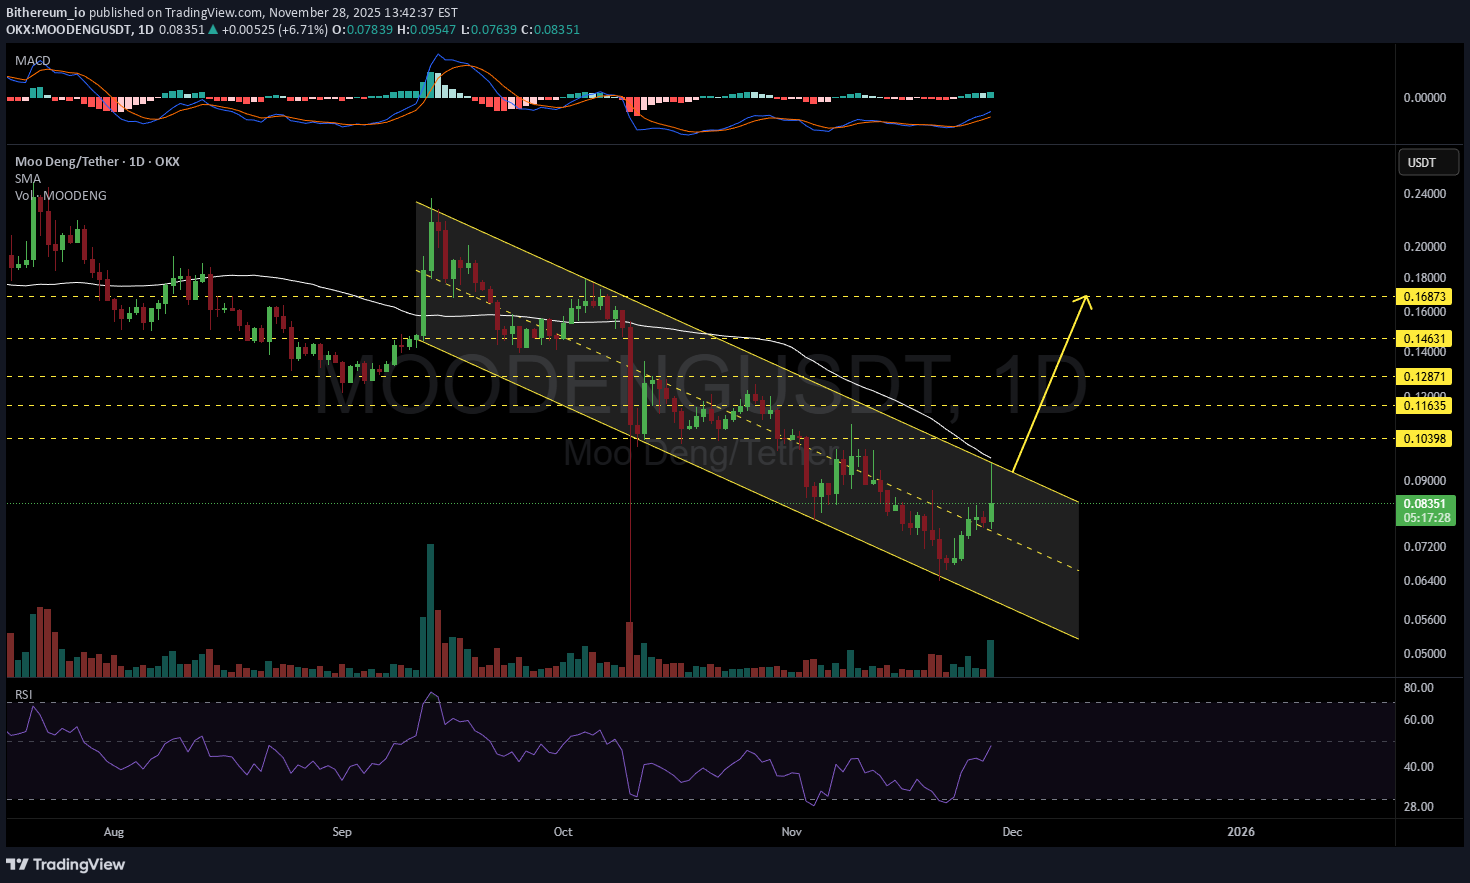
#MOODENG is moving inside a descending channel on the daily chart. Volume has increased, and on its first attempt it was rejected from the channel resistance and the daily SMA50. Keep an eye on it. If price breaks above both levels, the potential targets are: 🎯 $0.10398 🎯 $0.11635 🎯 $0.12871 🎯 $0.14631 🎯 $0.16873 ⚠️ Always remember to use a tight stop-loss and maintain proper risk management.

Tesfa-time
منطقه حمایت مودنگ: آیا روند صعودی در راه است؟ (الگوی مثلث)
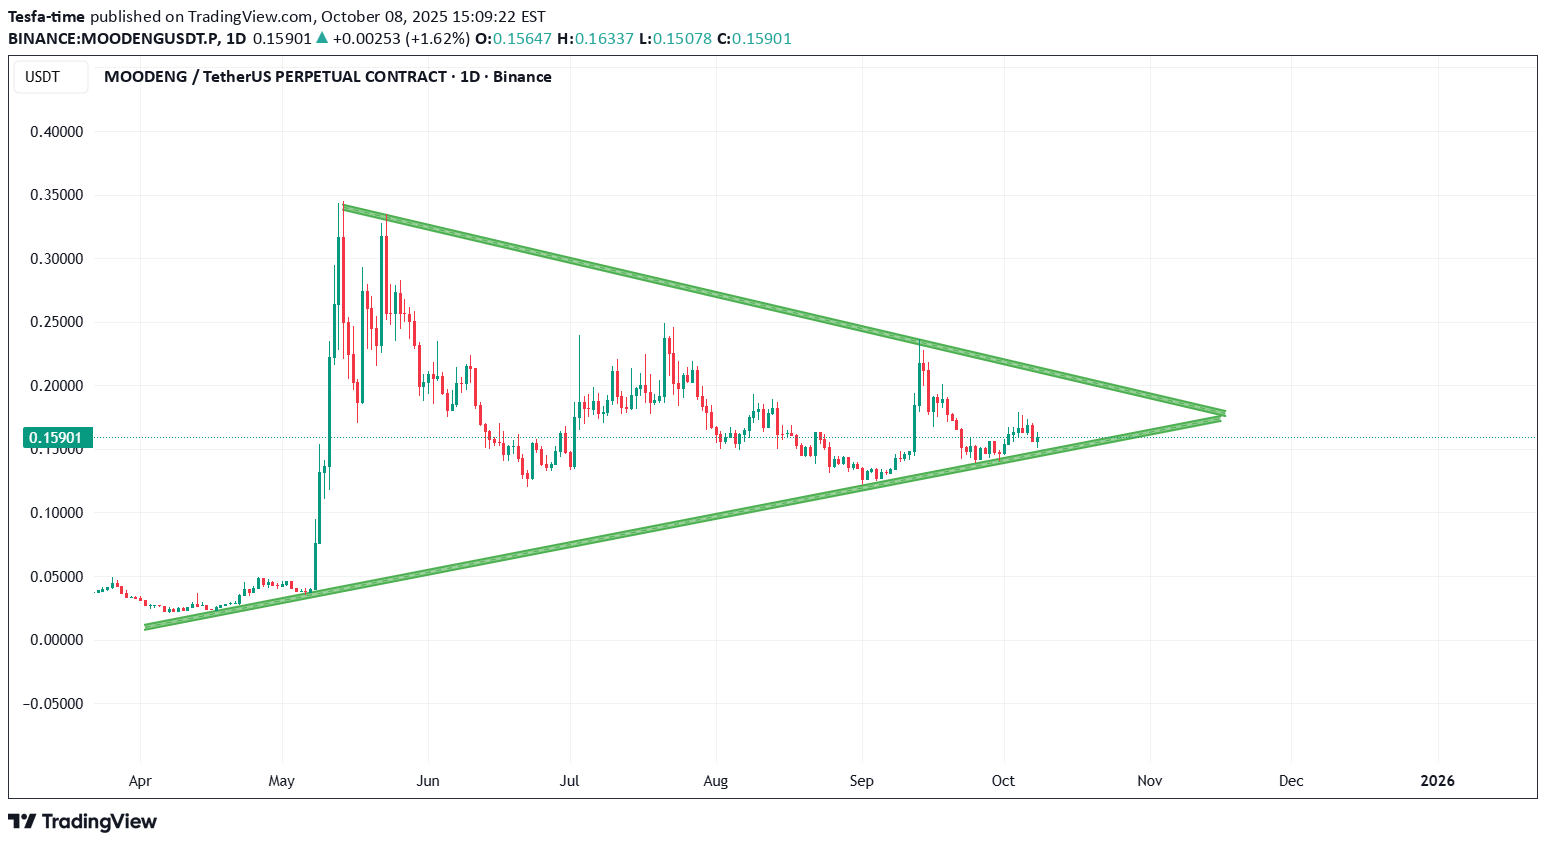
The chart Moodeng hits near the support zone, in this case it looks bullish pattern in the triangle area.

MMBTtrader
MOODENG is cooking next +200% only if support hold
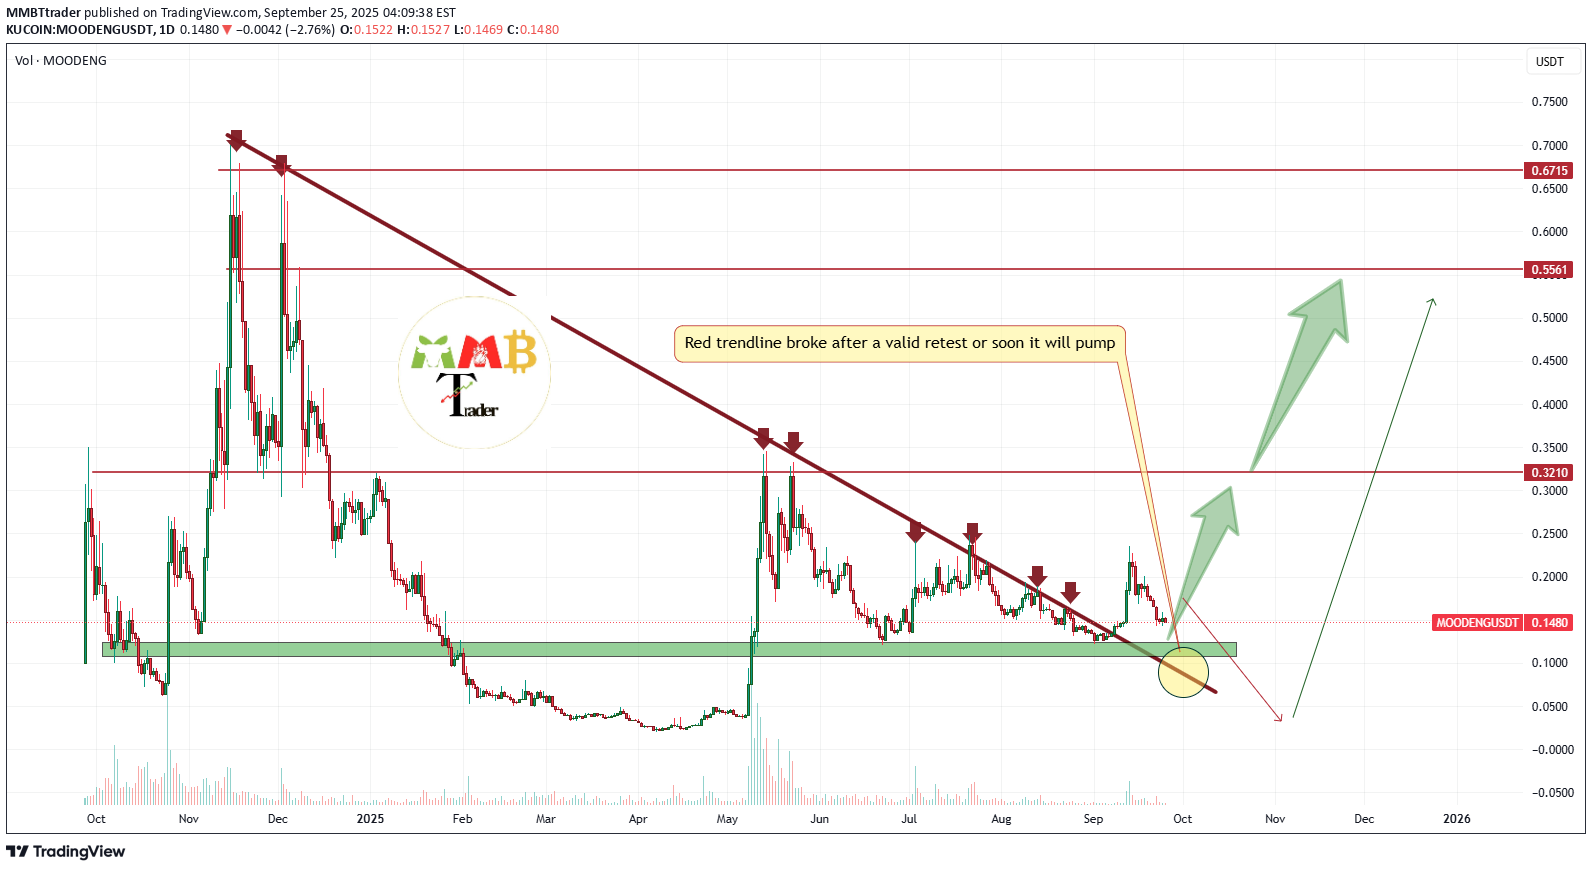
if price hold above 0.10$ for two months in this period we will see next 2x-3x easy and our target would hit else below 0.10$ more -50% will lead and that pump will start after hitting 0.05$ first.
DISCLAIMER: ((trade based on your own decision))
<

Crypto-by-PRIME
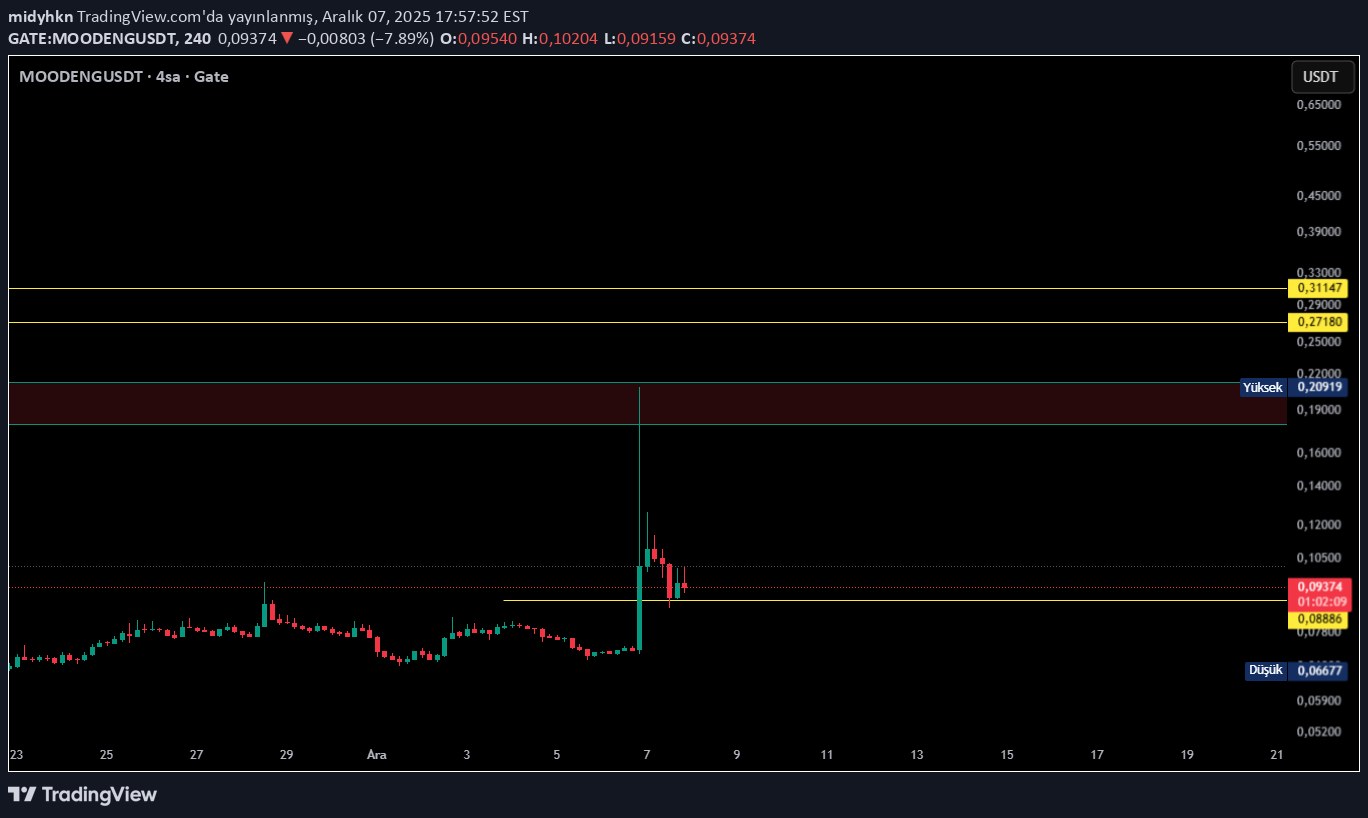
MOODENG / USDT : Showing strength after successful retest
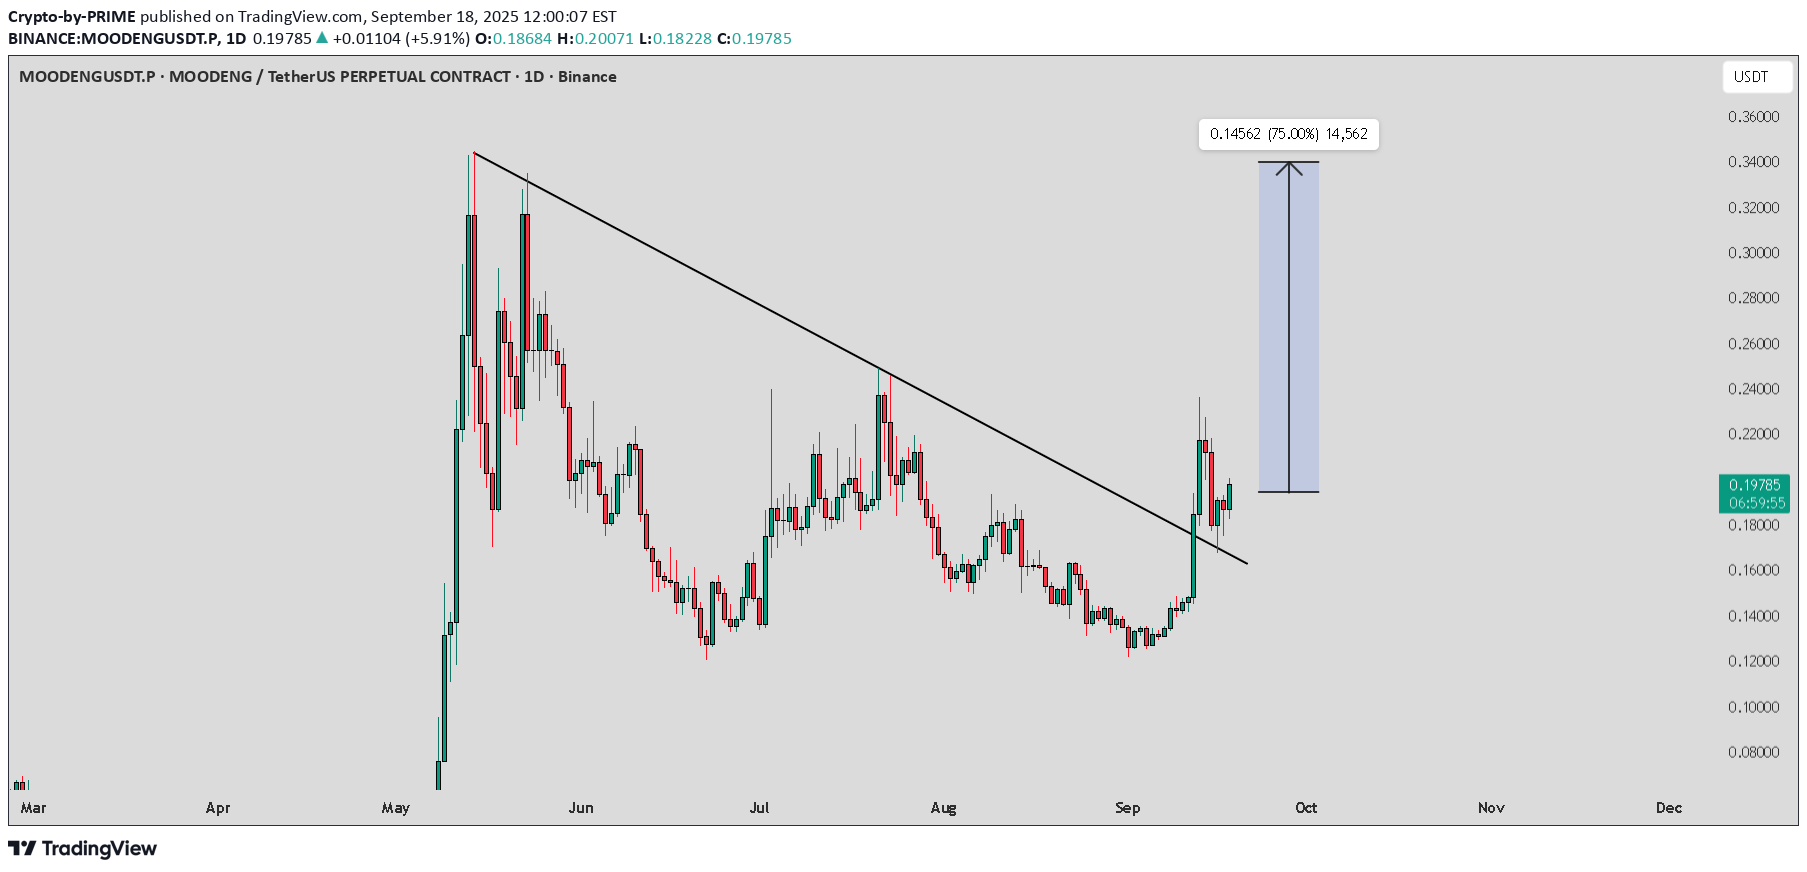
After a successful retest, MOODENG is showing strong momentum and moving forward. A rally towards $0.30 – $0.35 is now expected. Always manage risk and wait for confirmation on the next moves.

minno91
MOODENG - UP UP UP
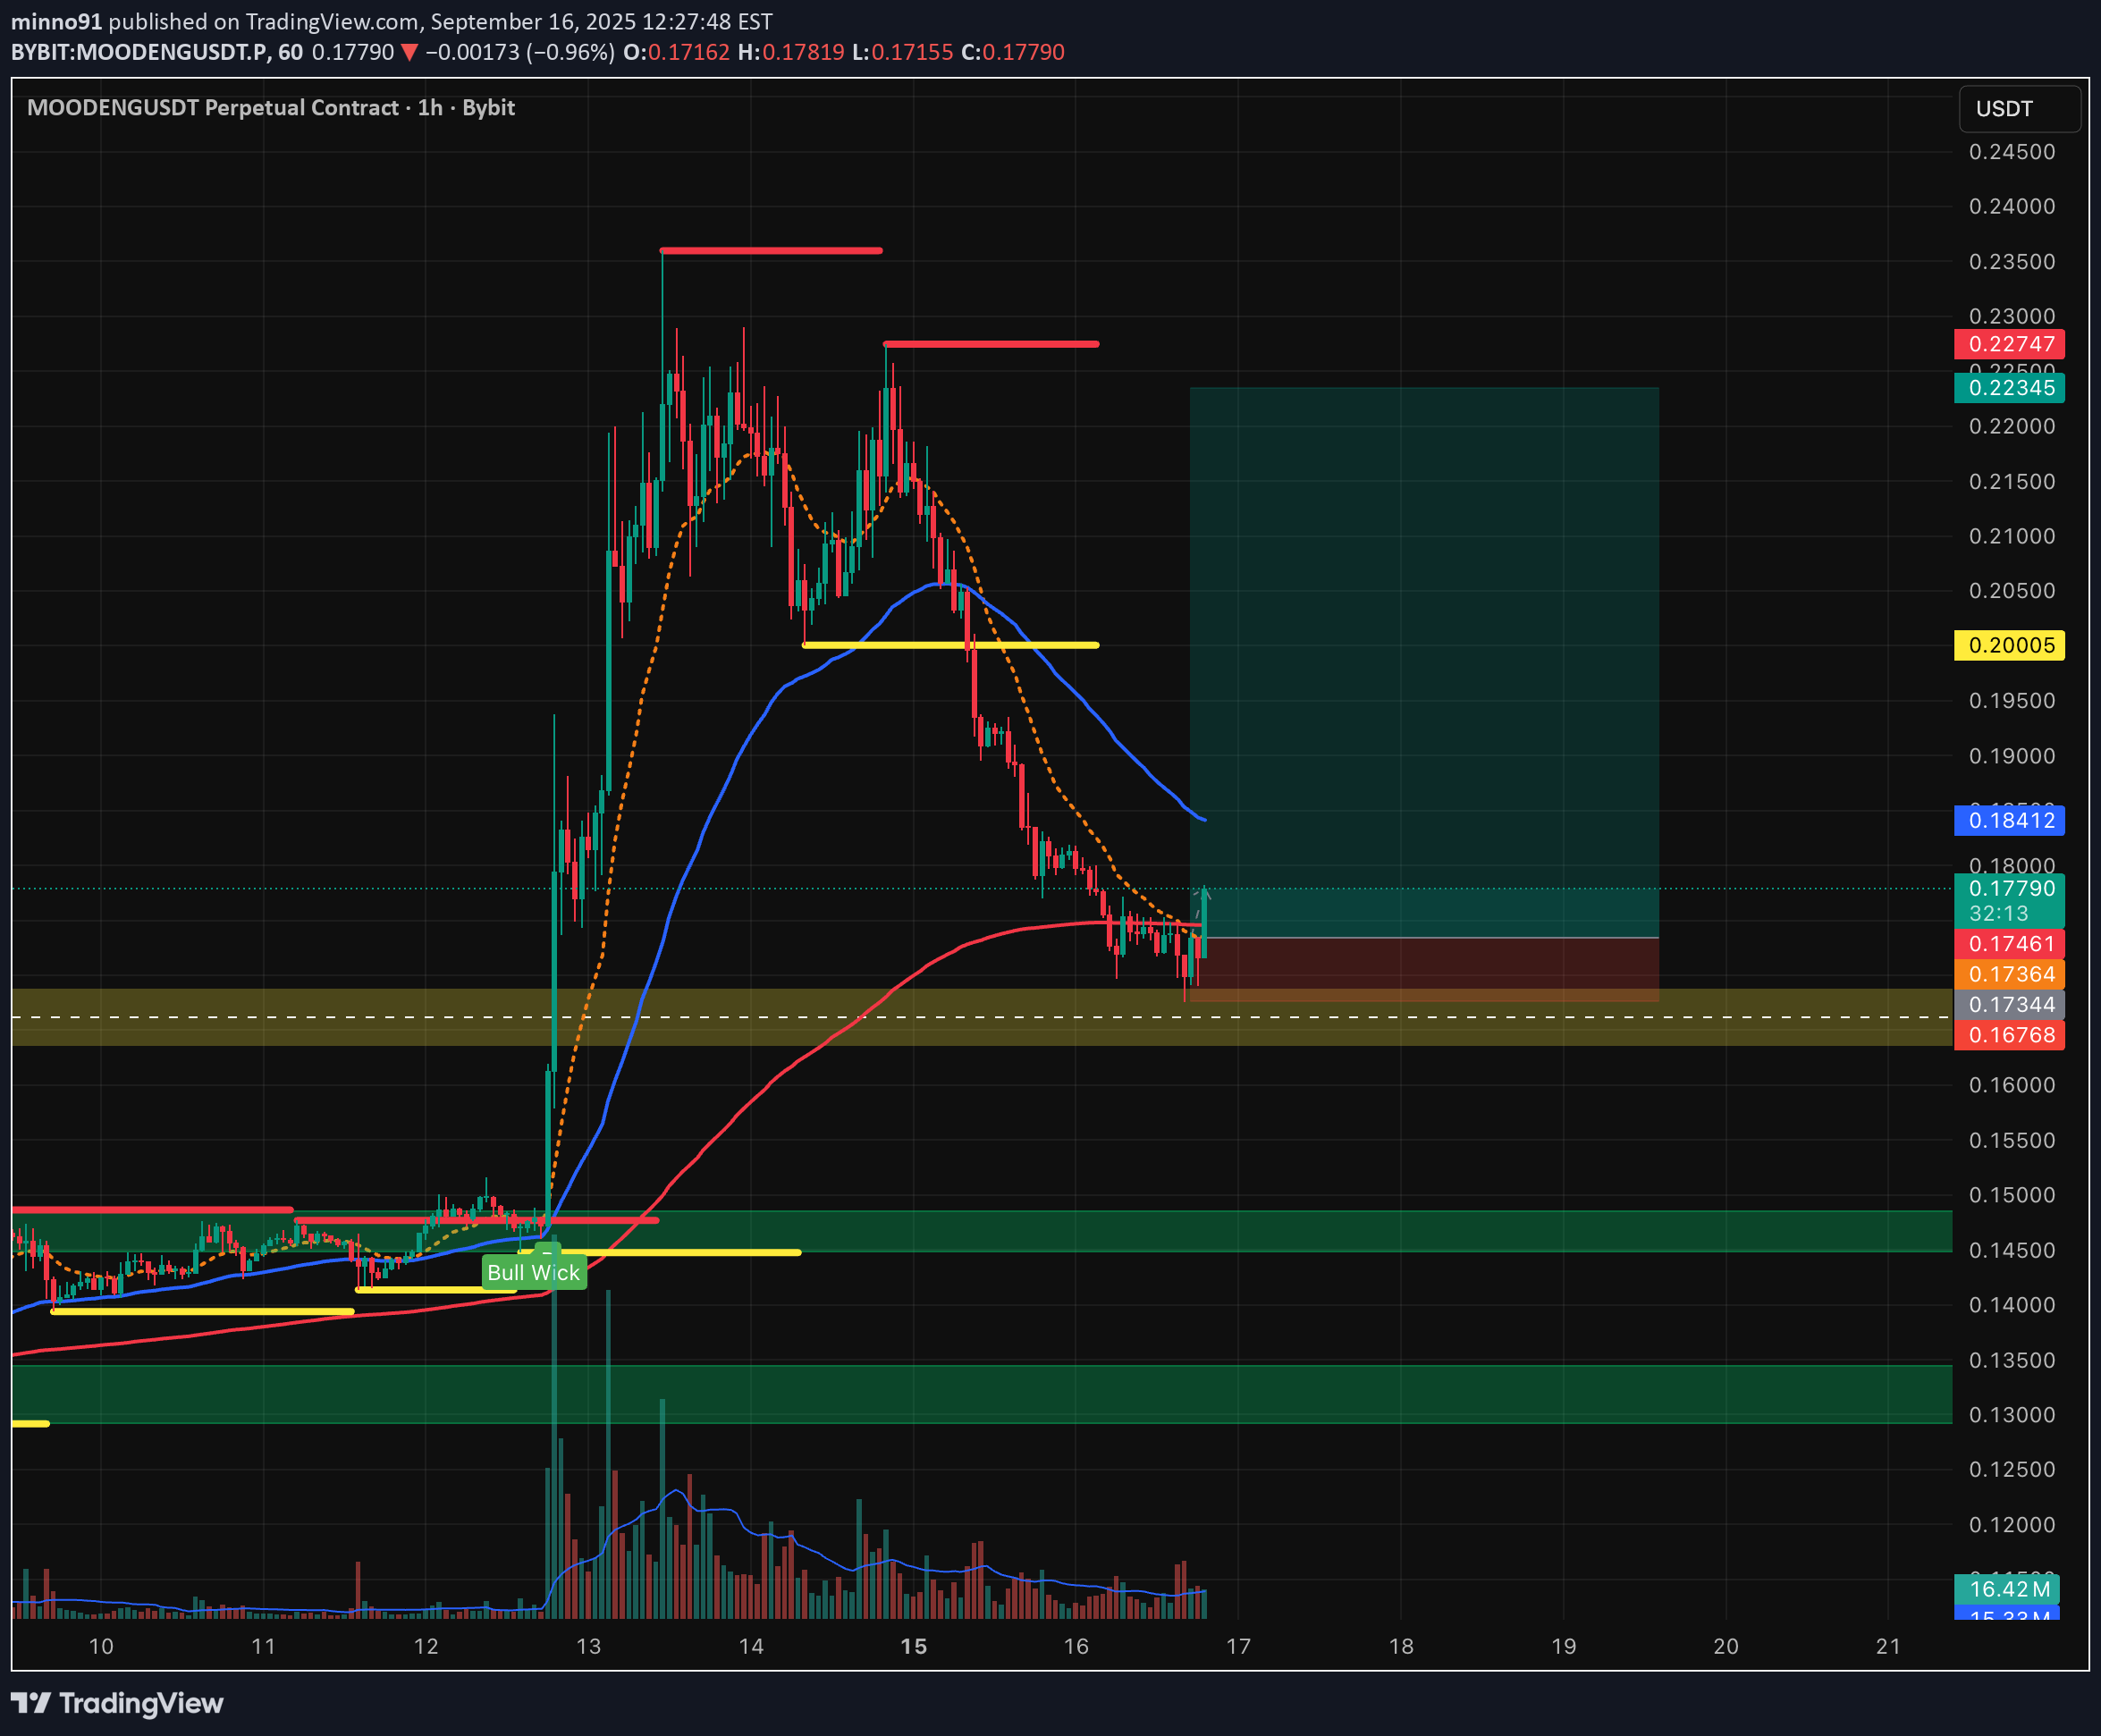
Tomorrow is an important day for crypto — the interest rate decision is coming. Let’s get into one great trade before that and see what happens!

bwfisher83
Continuation likely.
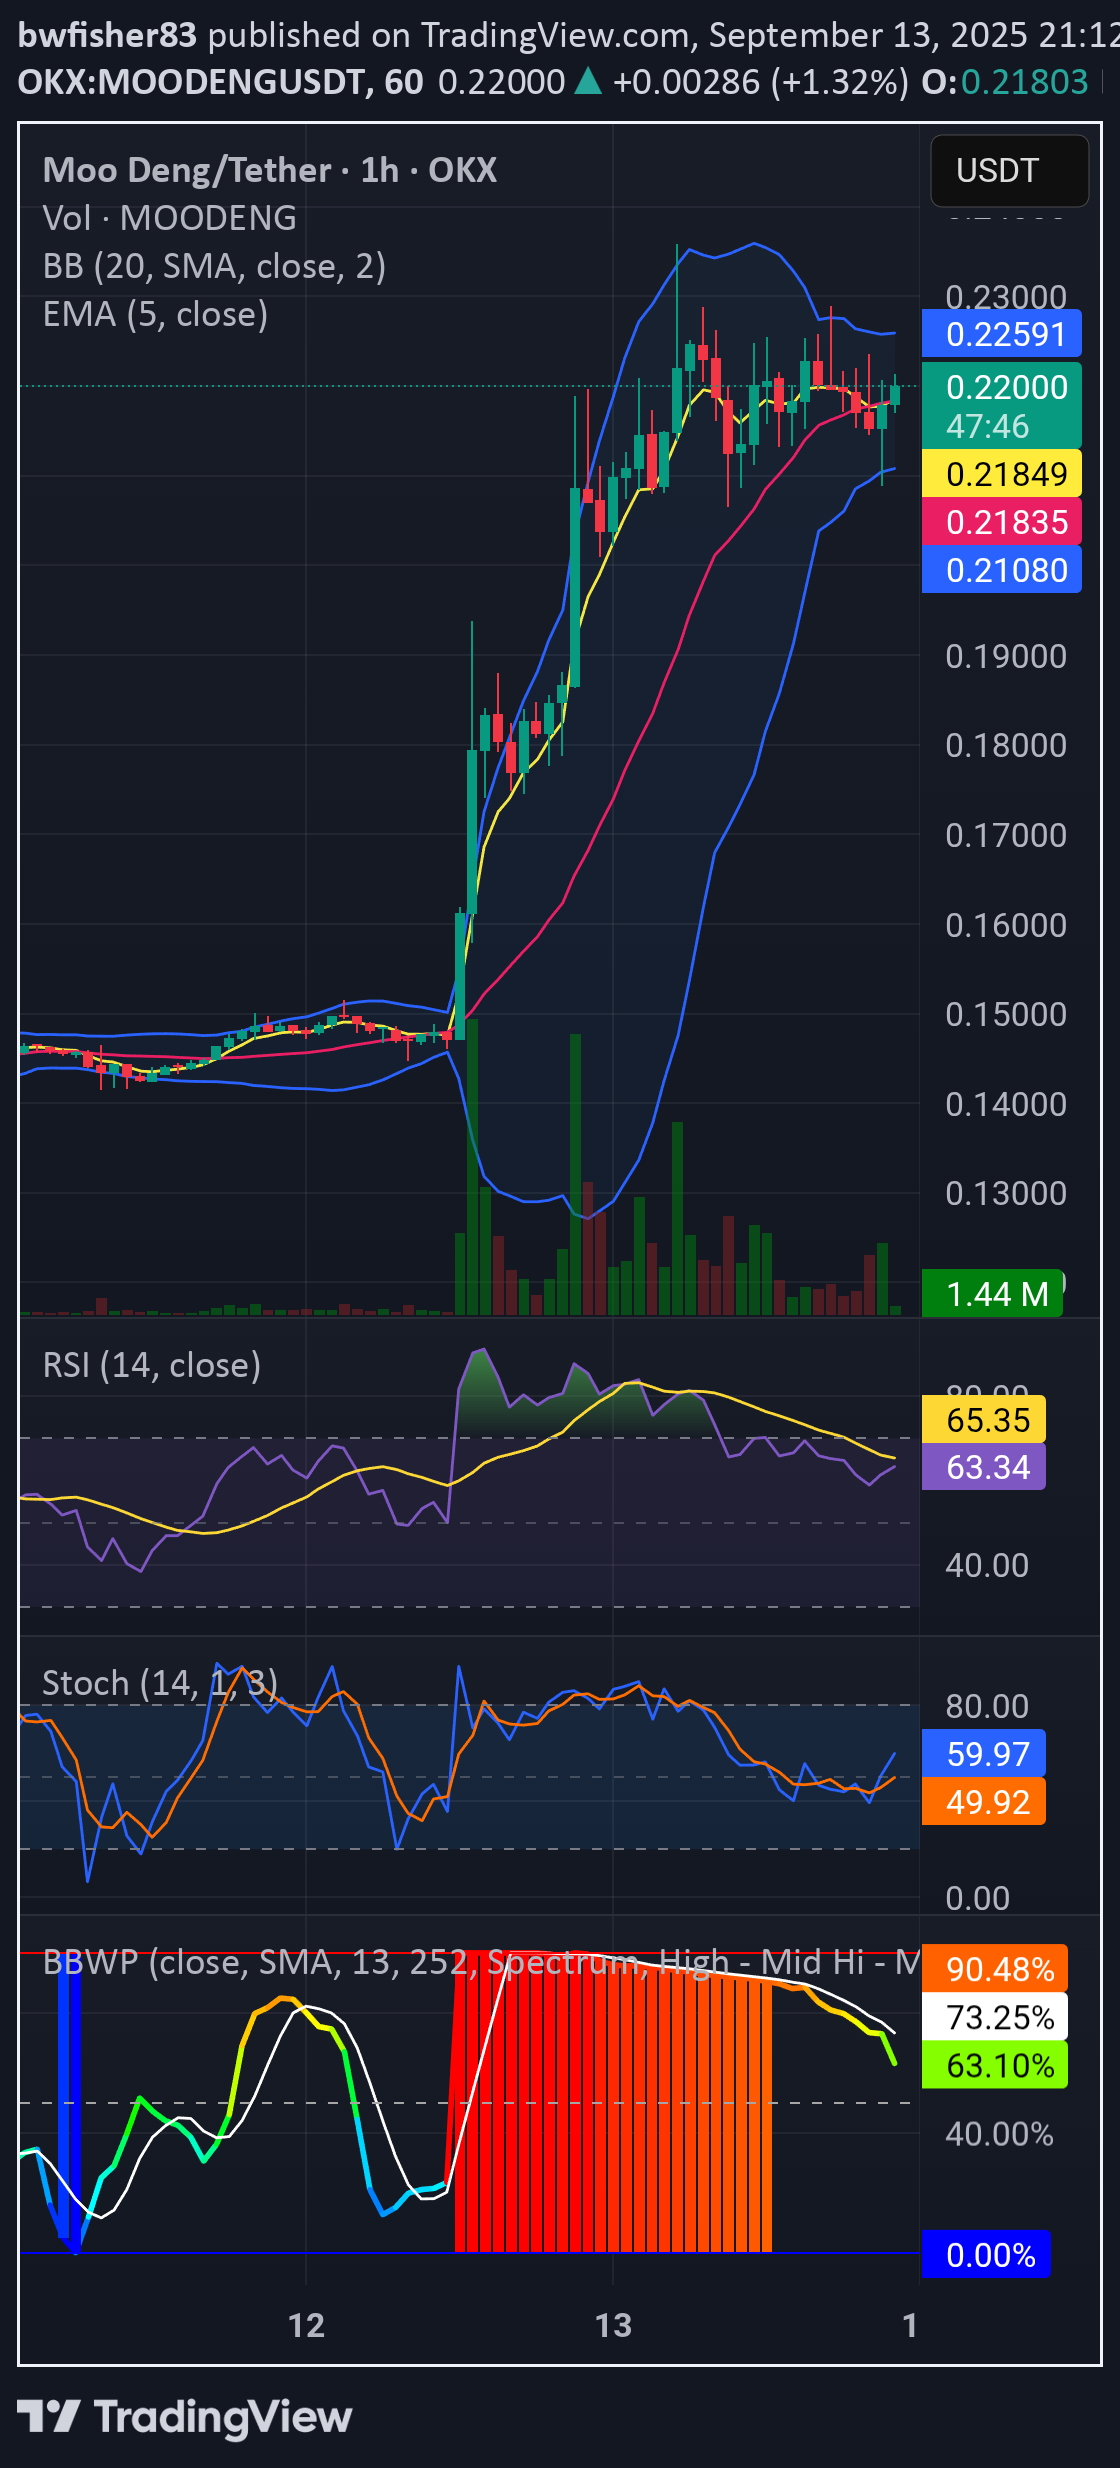
After a 60%+ move already this week from moodeng, the meme held the bottom side of the consolidation range. Since it didn't break down I look for it to break out to the upside. Upon break above .25 cents I look for a quick move up to .30 cents, minor resistance @.32 and more important resistance around .35. Let's not forget in May this shiiite coin ran from .04 cents to .35 in a weeks time. Not saying it'll do 800%+ again but it wouldn't suprised me at all to see. 50 or .60 cents. Who knows? If it just bulldozes past all resistance I'll sell most of my position @ $1 and subsequently quit my job. But first things first.....let's see this console range break to the upside.
Disclaimer
Any content and materials included in Sahmeto's website and official communication channels are a compilation of personal opinions and analyses and are not binding. They do not constitute any recommendation for buying, selling, entering or exiting the stock market and cryptocurrency market. Also, all news and analyses included in the website and channels are merely republished information from official and unofficial domestic and foreign sources, and it is obvious that users of the said content are responsible for following up and ensuring the authenticity and accuracy of the materials. Therefore, while disclaiming responsibility, it is declared that the responsibility for any decision-making, action, and potential profit and loss in the capital market and cryptocurrency market lies with the trader.