
MNT
Mantle
| تریدر | نوع سیگنال | حد سود/ضرر | زمان انتشار | مشاهده پیام |
|---|---|---|---|---|
 pullbacksignalRank: 14553 | فروش | حد سود: تعیین نشده حد ضرر: تعیین نشده | 11/20/2025 |
Price Chart of Mantle
سود 3 Months :
سیگنالهای Mantle
Filter
Sort messages by
Trader Type
Time Frame
pullbacksignal
سیگنال فروش فوری بیت کوین MNTUSDT: فرصت ترید بر اساس تحلیل تکنیکال کلاسیک!
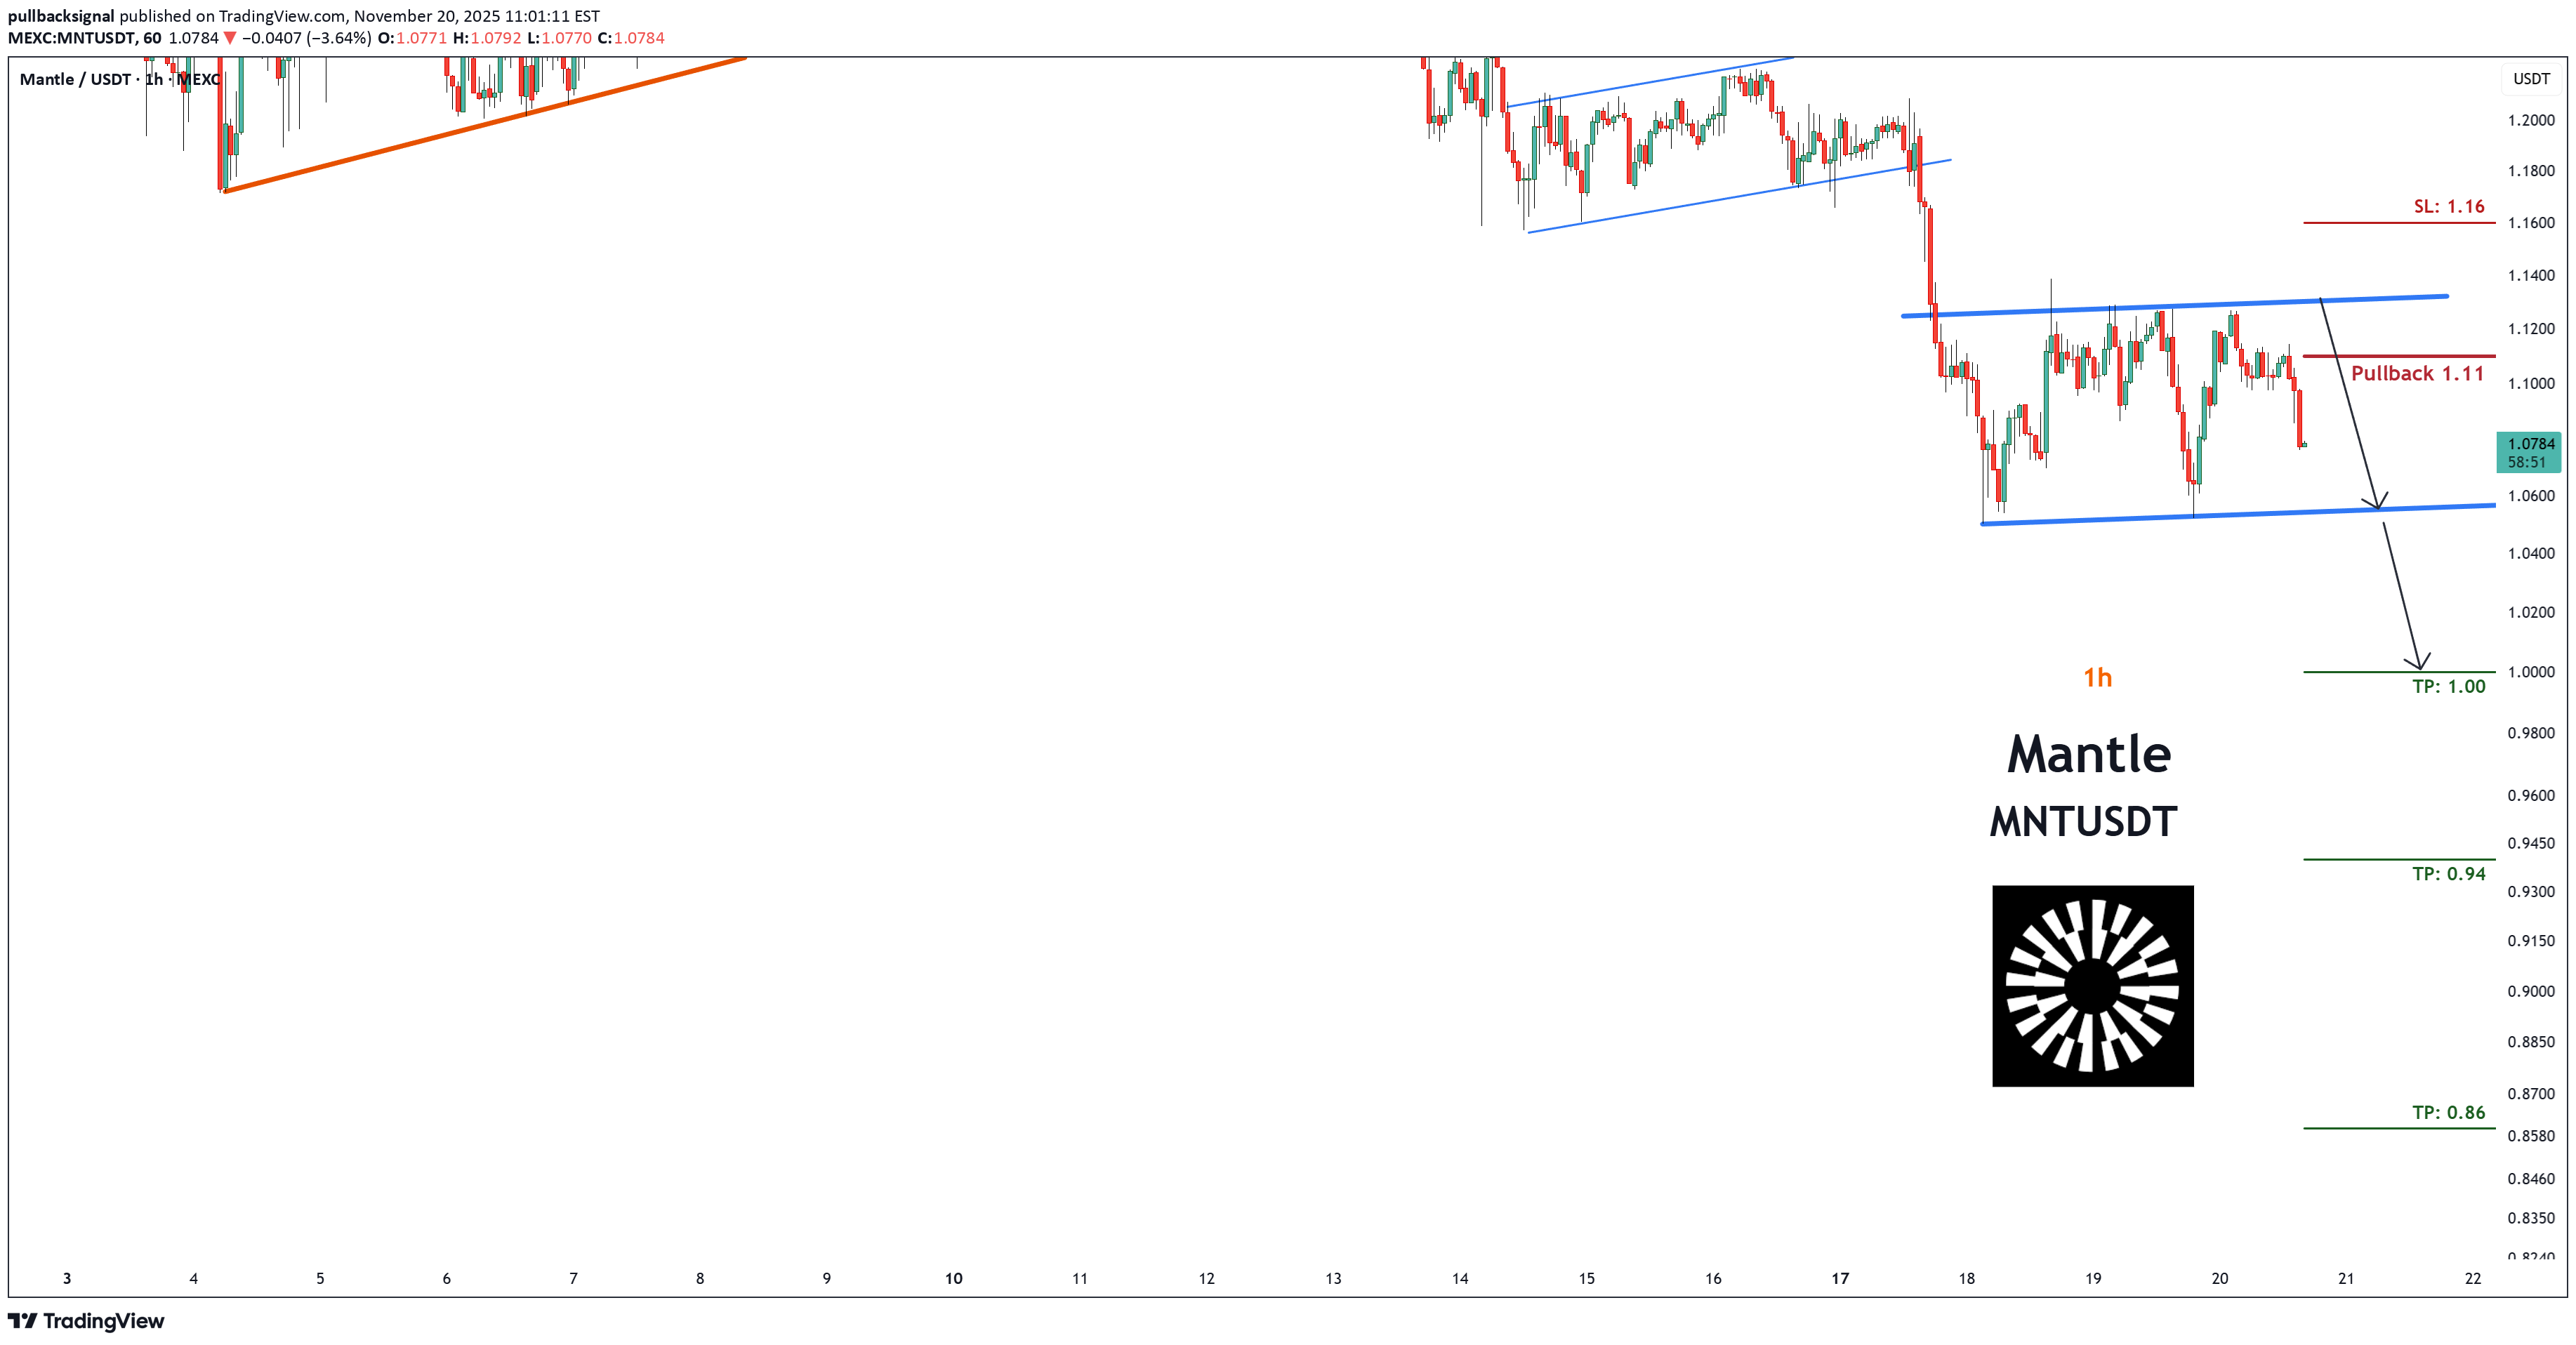
Trading Setup: There is a Trading Signal to Sell in MNTUSDT Mantle (Futures) (1h) Traders can open their Sell Trades NOW ⬇️ Sell now or sell on 1.11 ⭕️SL @ 1.16 🔵TP1 @ 1.00 🔵TP2 @ 0.94 🔵TP3 @ 0.86 What are these signals based on? Classical Technical Analysis Price Action Candlesticks Fibonacci RSI, Moving Average , Ichimoku , Bollinger Bands Risk Warning Trading Forex, CFDs, Crypto, Futures, and Stocks involve a risk of loss. Please consider carefully if such trading is appropriate for you. Past performance is not indicative of future results. If you liked our ideas, please support us with your likes 👍 and comments .✅✅ MNTUSDT Mantle (Futures) (1h) TP1 & TP2 hit TA & setup Update — The price has reached the target, traders can close part of the trade in profit. — SL Move to BE Point (Risk-Free)

artemfedorov
پیشبینی سقوط ارز دیجیتال MNT: منتظر کاهش بیشتر زیر سطح مقاومتی ۱.۵۱ باشید!
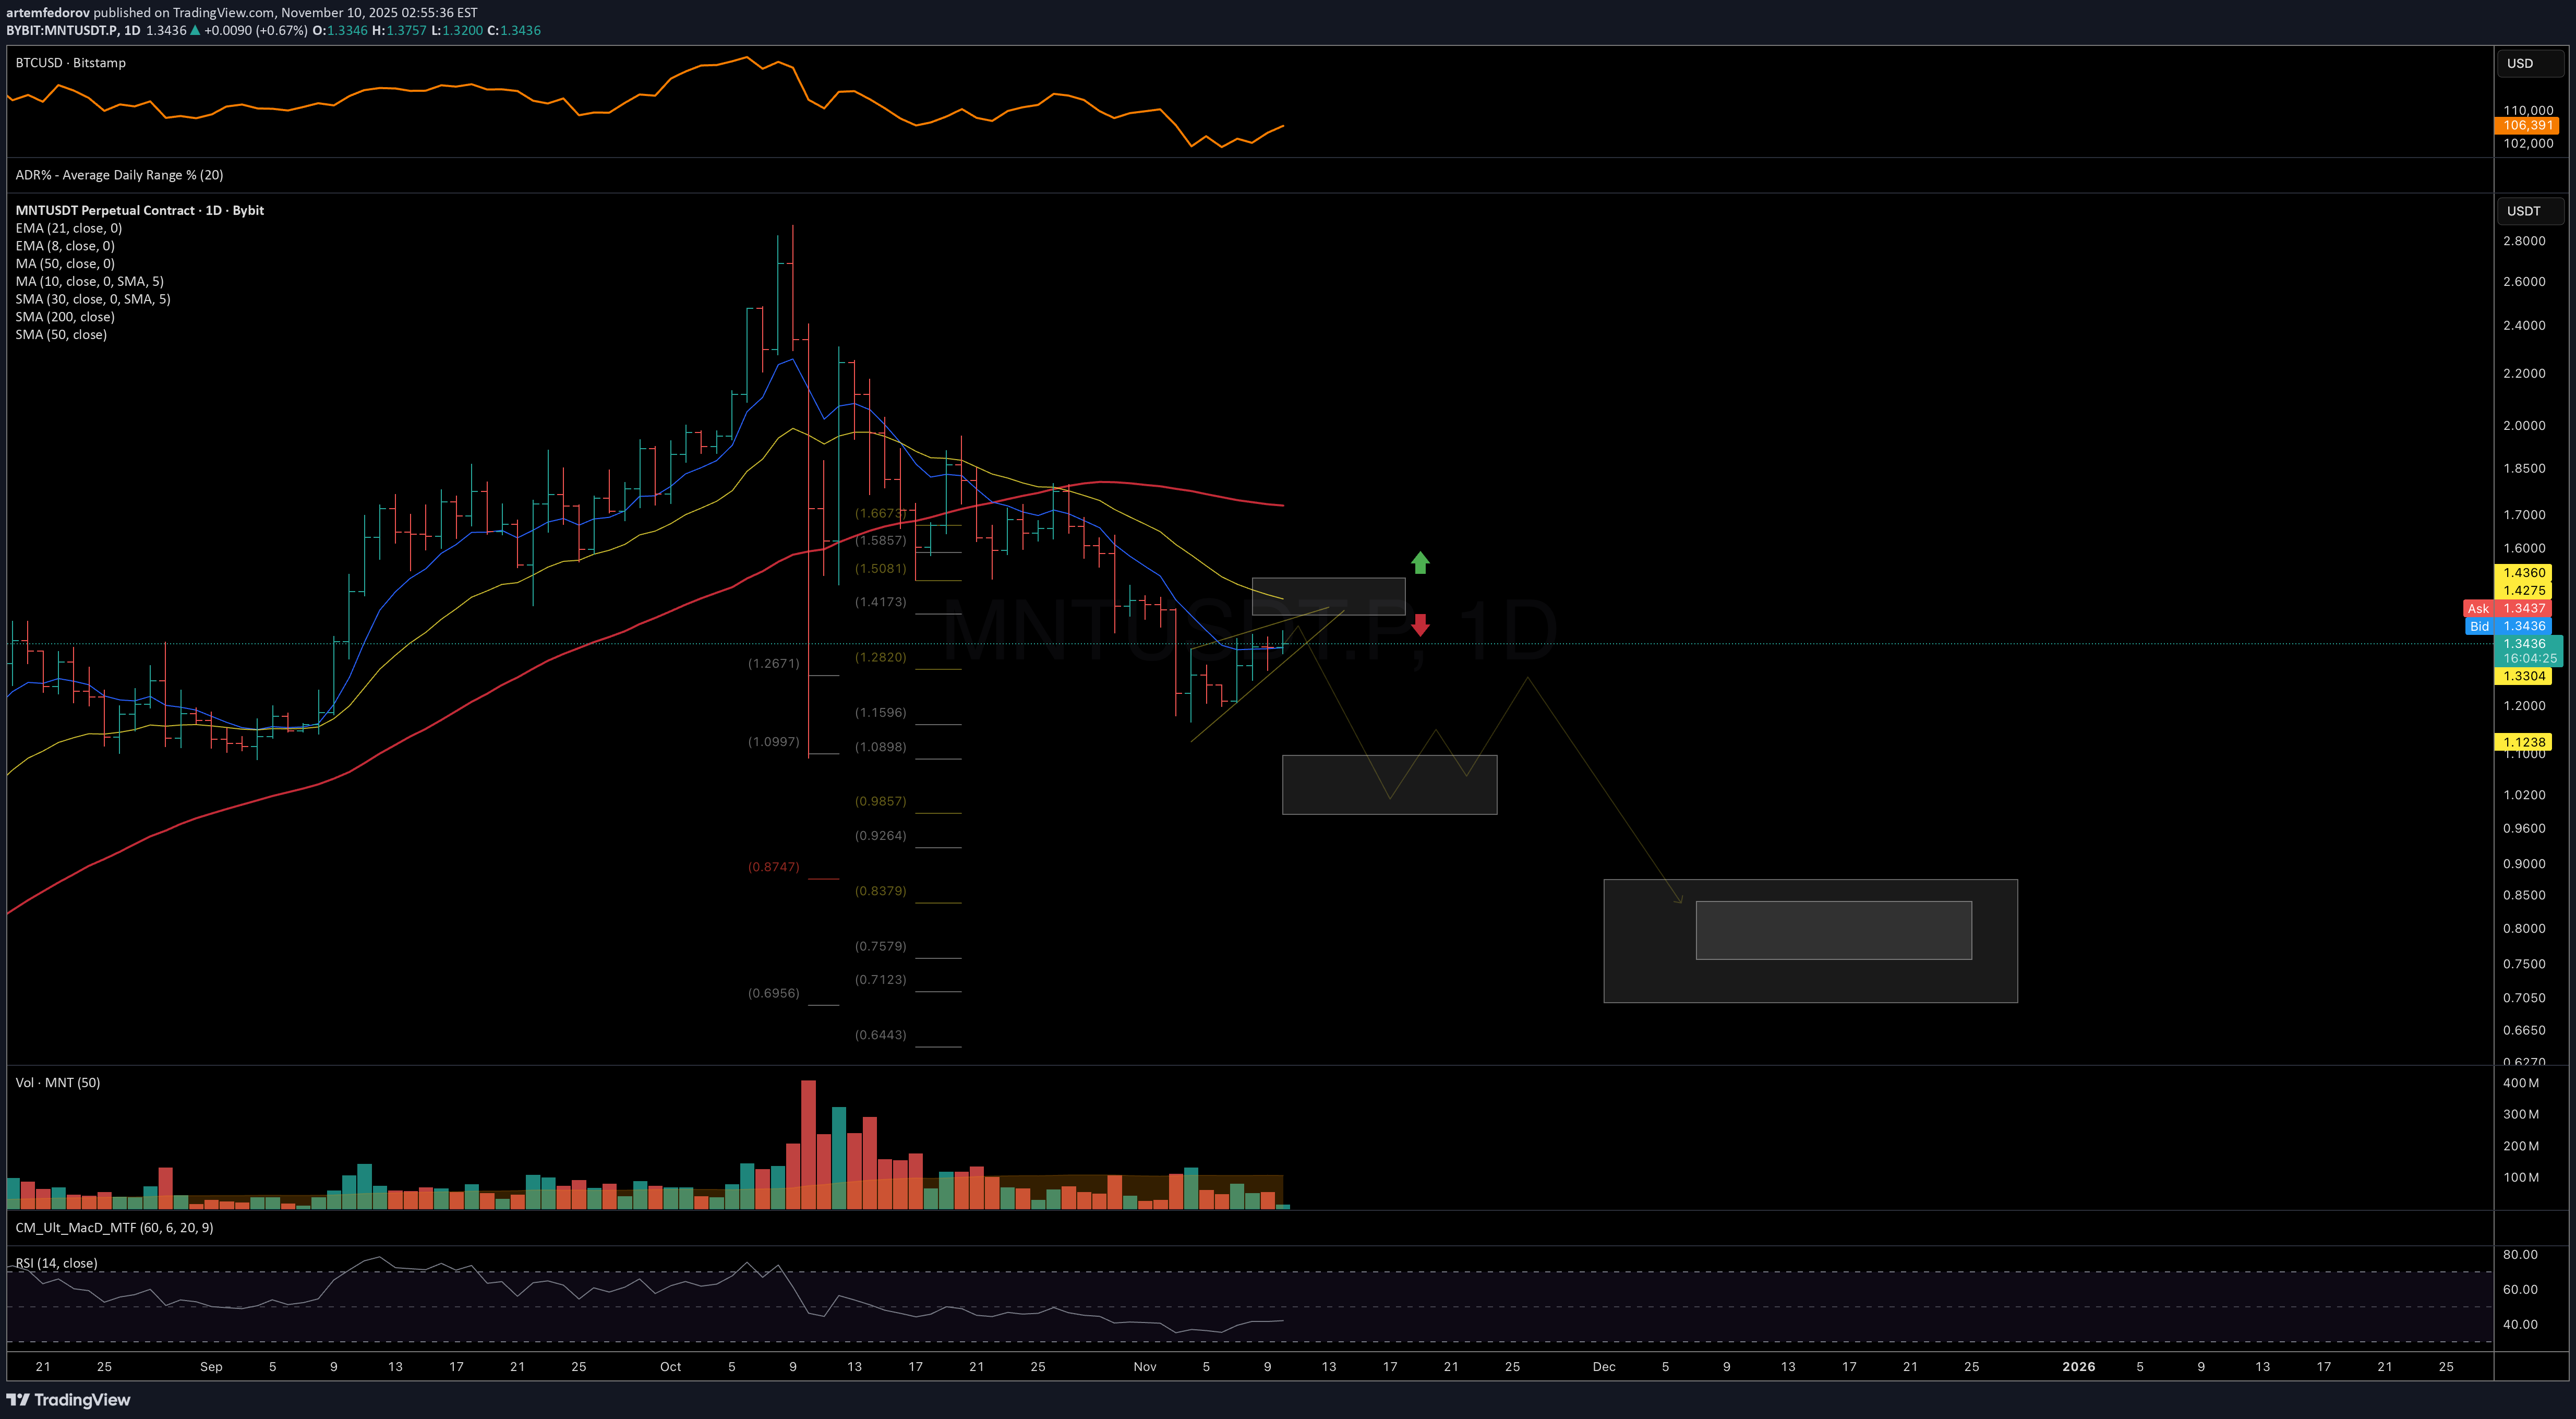
Watching for more downside continuation as long as price remains below the 1.51 resistance level. Chart: https://www.tradingview.com/x/1RDfUR9a/Good follow-through to the downside after the start of swing-down from Nov 10. The 1.09–0.985 zone might act as an initial support area where this leg down may complete. However, structurally I’m still looking for more downside - at least a measured move toward 0.875, with the possibility of a deeper capitulation lower. Chart:First target hit. The next (ideal) support zone for this leg down sits around 0.99. Chart: If a swing-short position was taken, the stop can now be moved to today’s highs — or you can trail it using the 8-dayUltimate target reached at 0.84 Chart:

MNT چیست و چرا انتظار رشد تا ۱.۸ دلار برای آن وجود دارد؟
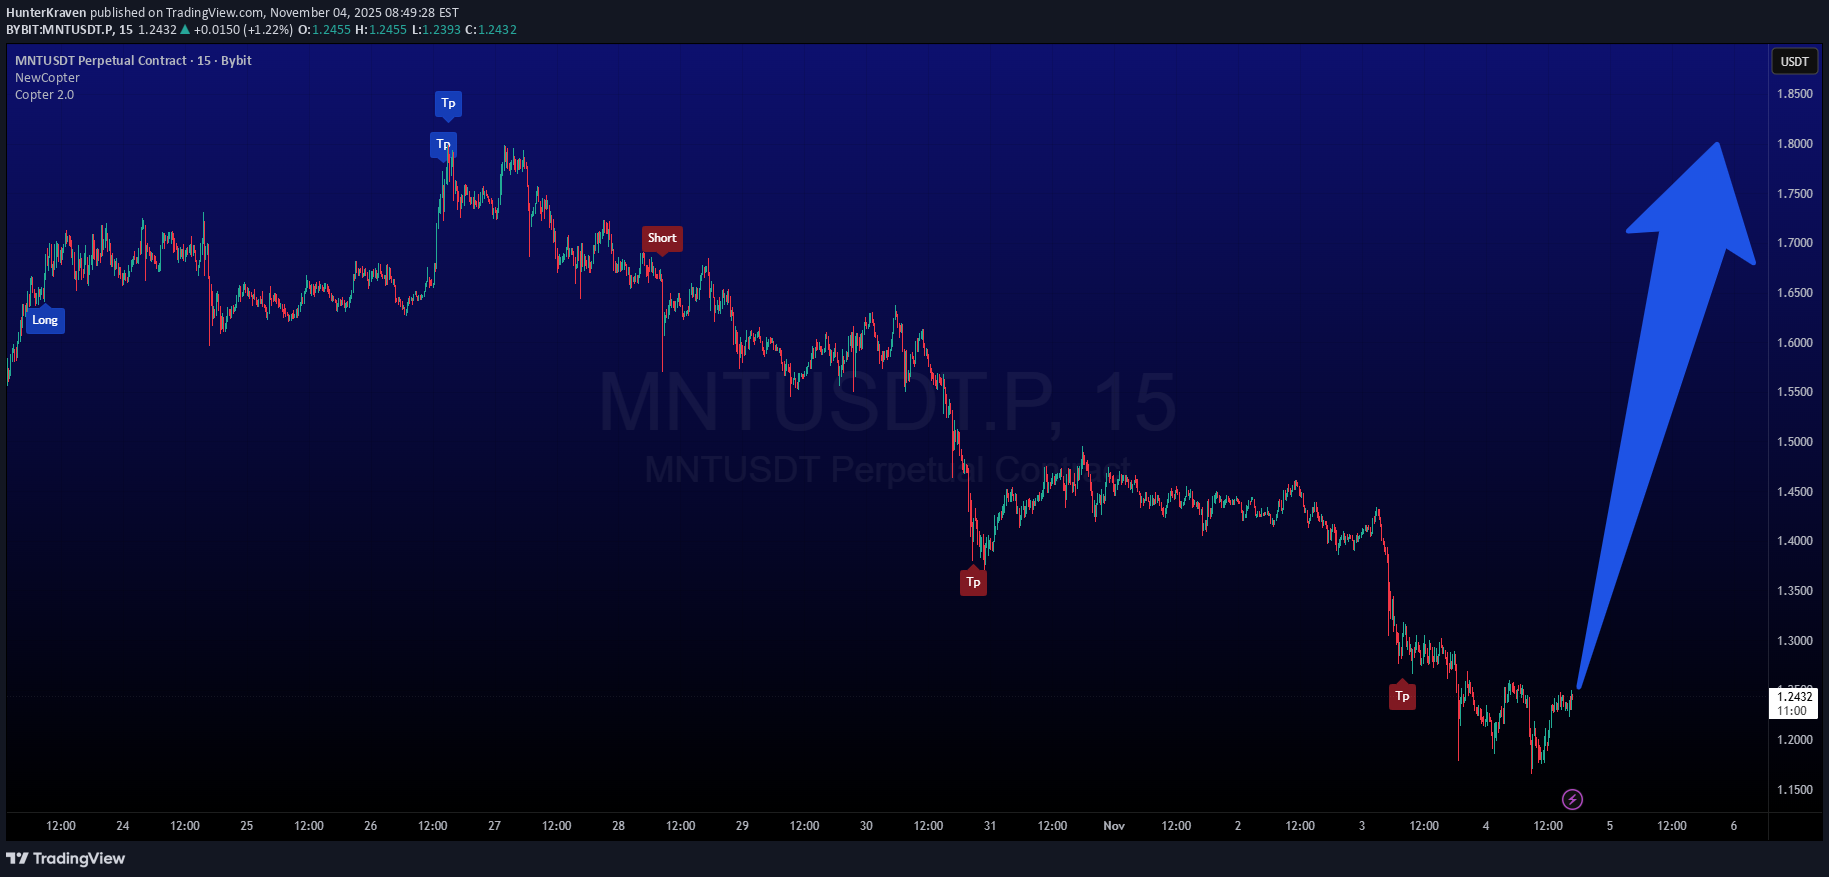
I like this token, and I've always gotten a scalp on it. I expect growth from the current ones and the first target is 1.8$

CryptoAnalystSignal
پیشبینی صعودی قوی MNT: نقطه ورود، اهداف و استراتژی سودگیری کامل!
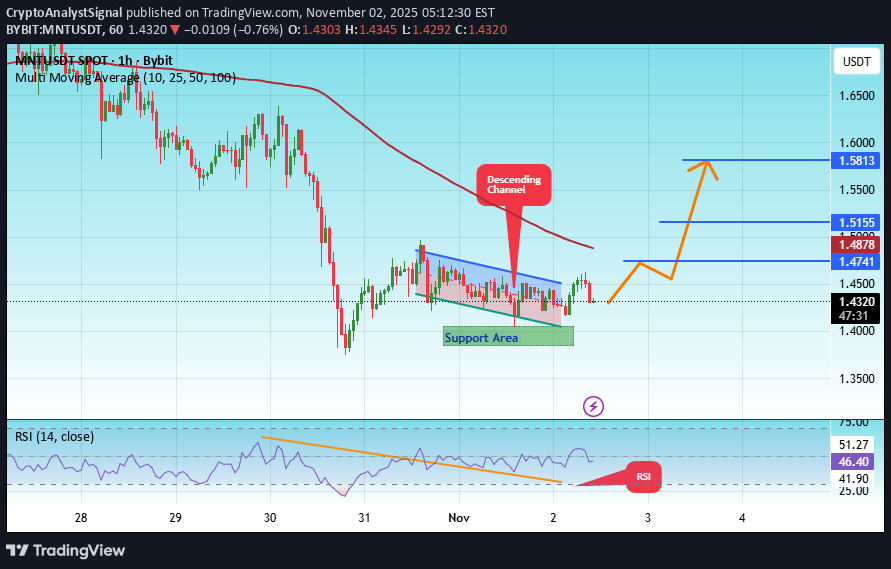
#MNT The price is moving within an ascending channel on the 1-hour timeframe and is adhering to it well. It is poised to break out strongly and retest the channel. We have a downtrend line on the RSI indicator that is about to break and retest, which supports the upward move. There is a key support zone in green at the price of 1.39, representing a strong support point. We have a trend to stabilize above the 100-period moving average. Entry price: 1.43 First target: 1.47 Second target: 1.51 Third target: 1.58 Don't forget a simple money management rule: Place your stop-loss order below the support zone in green. Once the first target is reached, save some money and then change your stop-loss order to an entry order. For any questions, please leave a comment. Thank you.

CryptoNuclear
تست سرنوشتساز MNT/USDT: حفظ حمایت یا سقوط آزاد؟
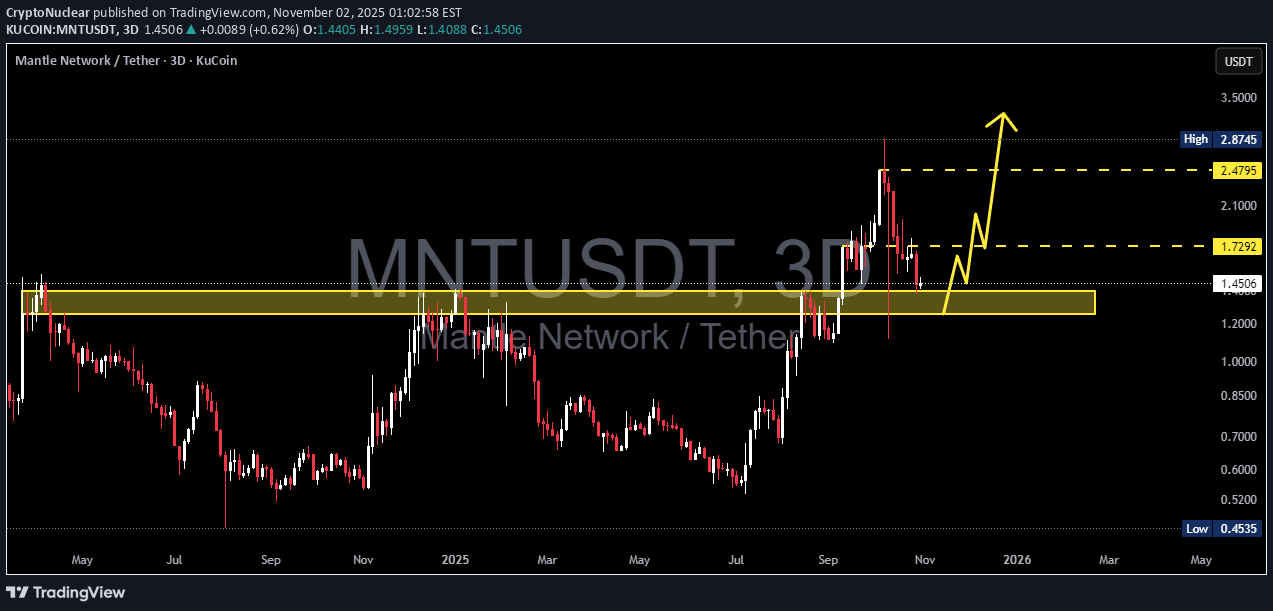
MNT has just completed a major breakout cycle from a long accumulation range below 1.40 USDT, marking the beginning of a strong expansion phase that pushed the price up to a peak of 2.87 USDT. After this sharp rally, however, the chart shows a strong rejection, pulling the price back toward the historical breakout zone at 1.25–1.40, which now acts as the primary support base. This area is more than just a technical level — it’s a decision zone that will determine whether MNT is ready to continue its mid-term bullish trend or confirm a distribution and potential trend reversal. --- Structure & Price Pattern The chart currently displays a breakout → retest → decision point structure, where price is testing a former supply area that has flipped into demand. The latest 3D candle shows indecision after a strong selloff, signaling a tug-of-war between buyers defending structure and sellers pushing for breakdown. As long as price holds above 1.25, the higher-low formation remains intact, keeping the mid-term uptrend technically valid. --- Key Technical Zones Main Support: 1.25–1.40 (key structural zone). Minor Resistance: 1.73 (pivot retest zone). Major Resistances: 2.48 and 2.87 (liquidity zones). Next Supports if breakdown occurs: 1.00 → 0.85 → 0.45. --- Bullish Scenario If MNT manages to close a solid 3D candle above 1.40, this move would confirm a successful retest of the major breakout. Such confirmation could trigger Expansion Wave 2, with potential upside targets at 1.73 → 2.48 → 2.87. This scenario highlights the strength of buyers maintaining control over demand and extending the mid-term continuation trend. --- Bearish Scenario If selling pressure continues and the price closes below 1.25, the prior breakout risks becoming a false breakout or bull trap. This scenario could trigger a liquidity sweep toward 1.00 – 0.85, and in more aggressive conditions, an extended retracement down to 0.45. Such movement would signal the end of the expansion phase and the start of a redistribution phase. --- Market Narrative & Conclusion MNT is now sitting in the most critical zone of its technical cycle. The 1.25–1.40 range will decide the next chapter: Holding above = foundation for a new expansion phase. Breaking below = confirmation of distribution and corrective structure. Technically, this is the “make-or-break retest” — a moment that often precedes the next major move in the altcoin market. --- #MNT #Mantle #Crypto #Breakout #Retest #AltcoinAnalysis #TechnicalAnalysis #KeySupport

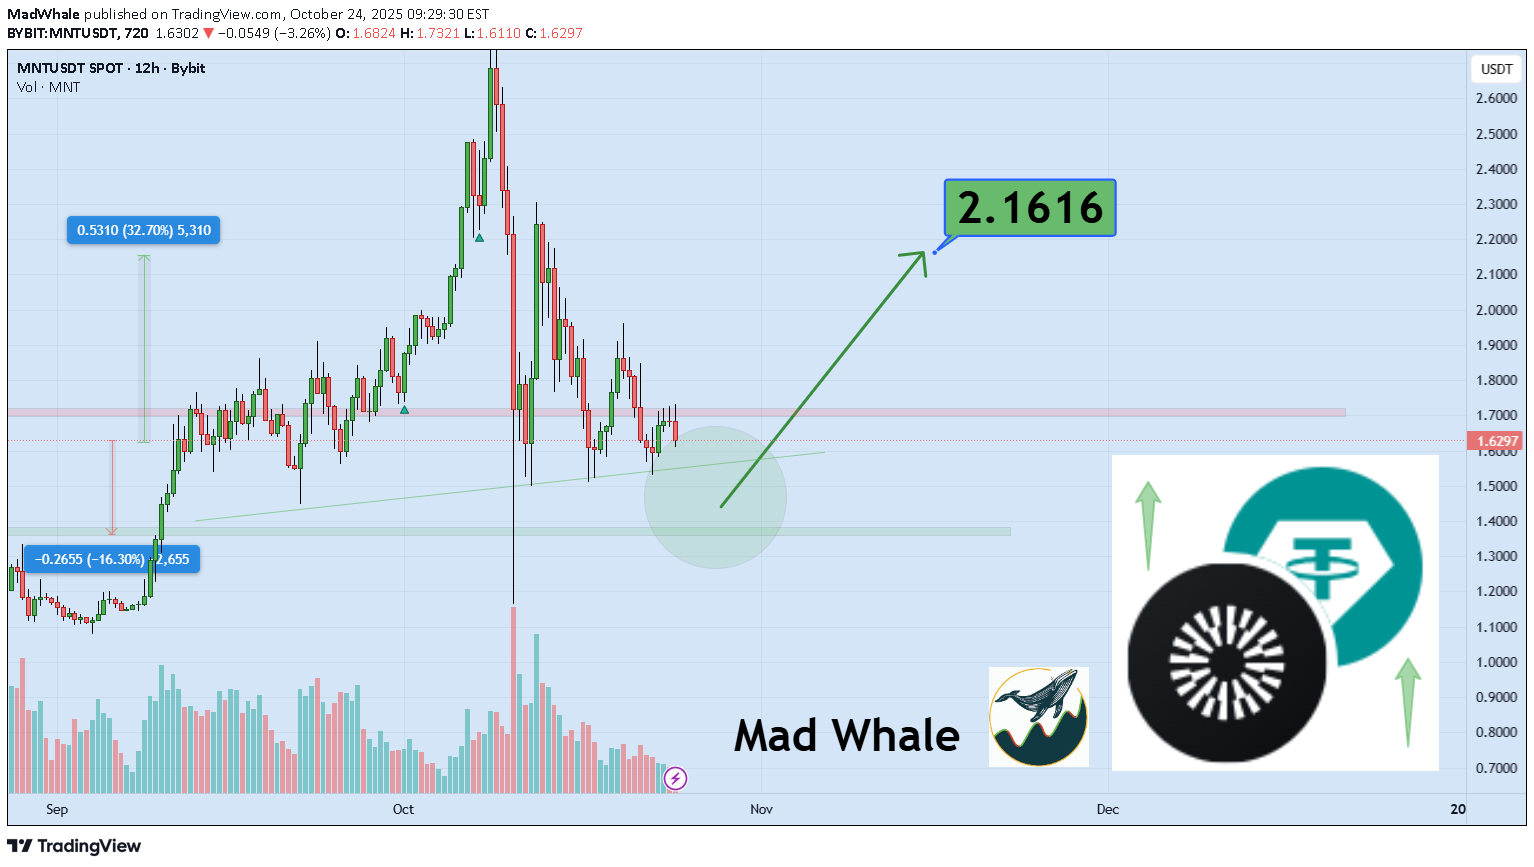
MadWhale
مقاومت بعدی مونت (MNT) کجاست؟ مسیر صعود 32 درصدی تا 2.16 دلار

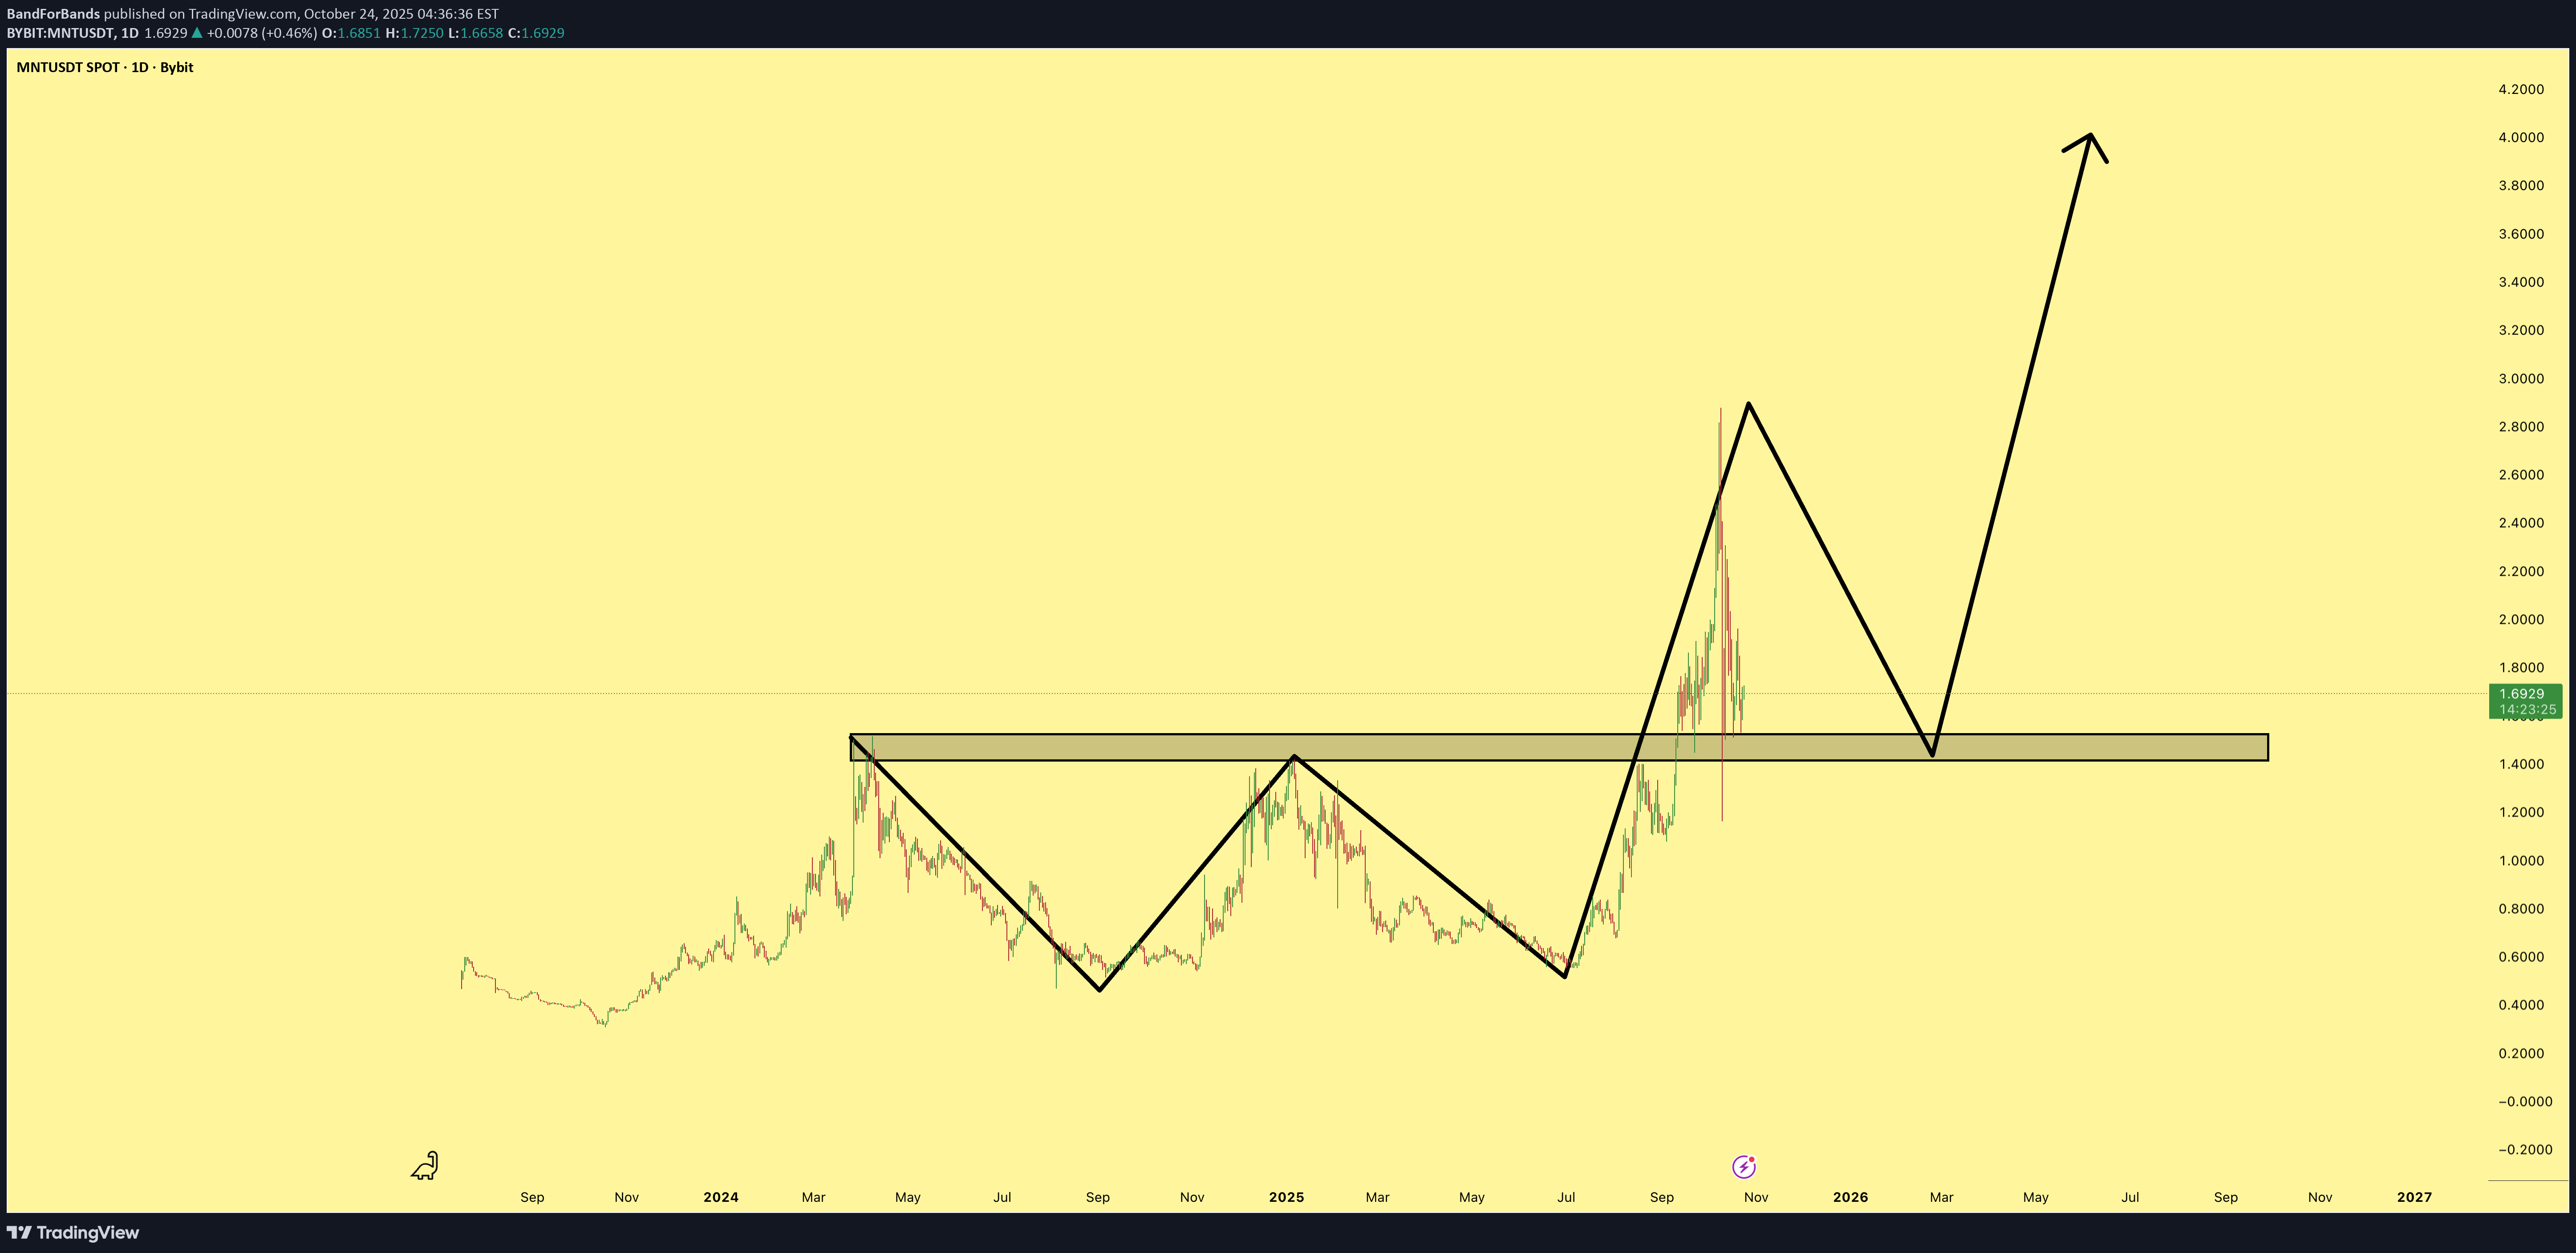
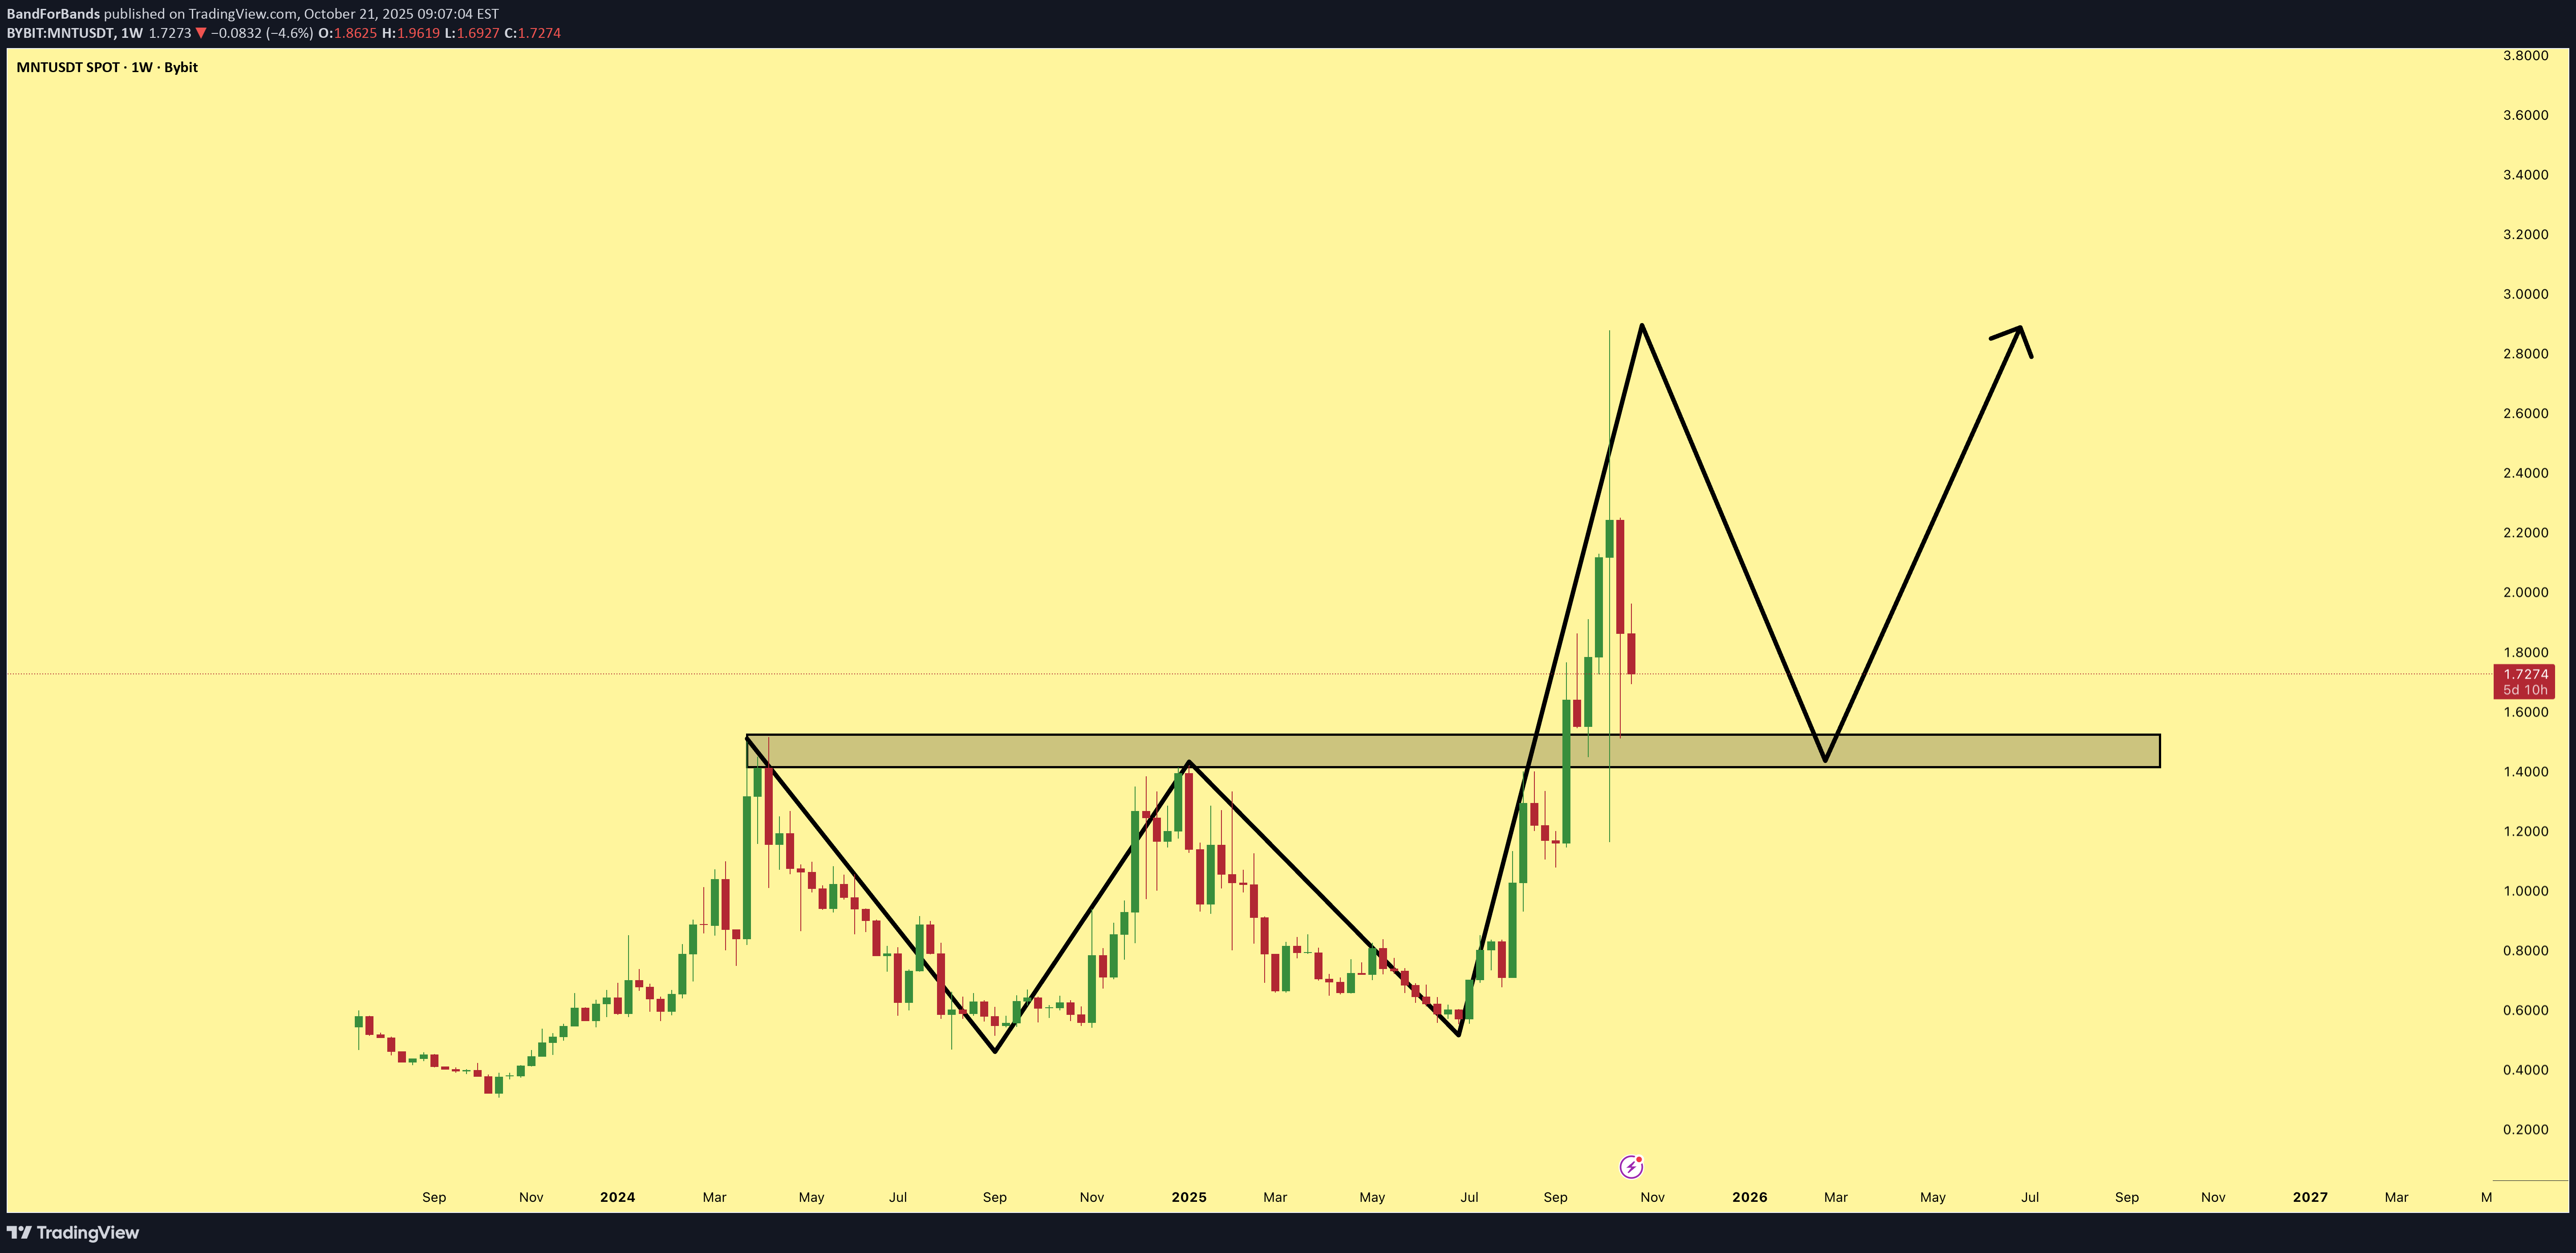
BandForBands
MNT به منطقه خرید رسید: تحلیل تکنیکال و هدفگذاری ۴ دلاری!
BandForBands

tomas_jntx
مانتل (MNT) زیر ۲ دلار گیر افتاده: سطوح کلیدی برای صعود یا سقوط!

📈 Bias: NEUTRAL-to-LONG Mantle trades at $1.95, rebounding from $1.88 support while hovering below SMA200 ($2.00). RSI at 52 reflects early stabilization — buyers showing interest but not yet in control. A break and hold above $2.03 would flip bias to bullish, while losing $1.88 reopens downside toward $1.85. 📊 Key Levels: Resistance: $2.00 / $2.03 Support: $1.88 / $1.85

MNT/USDT در آستانه انفجار: منتظر شکست کدام قیمت باشیم؟
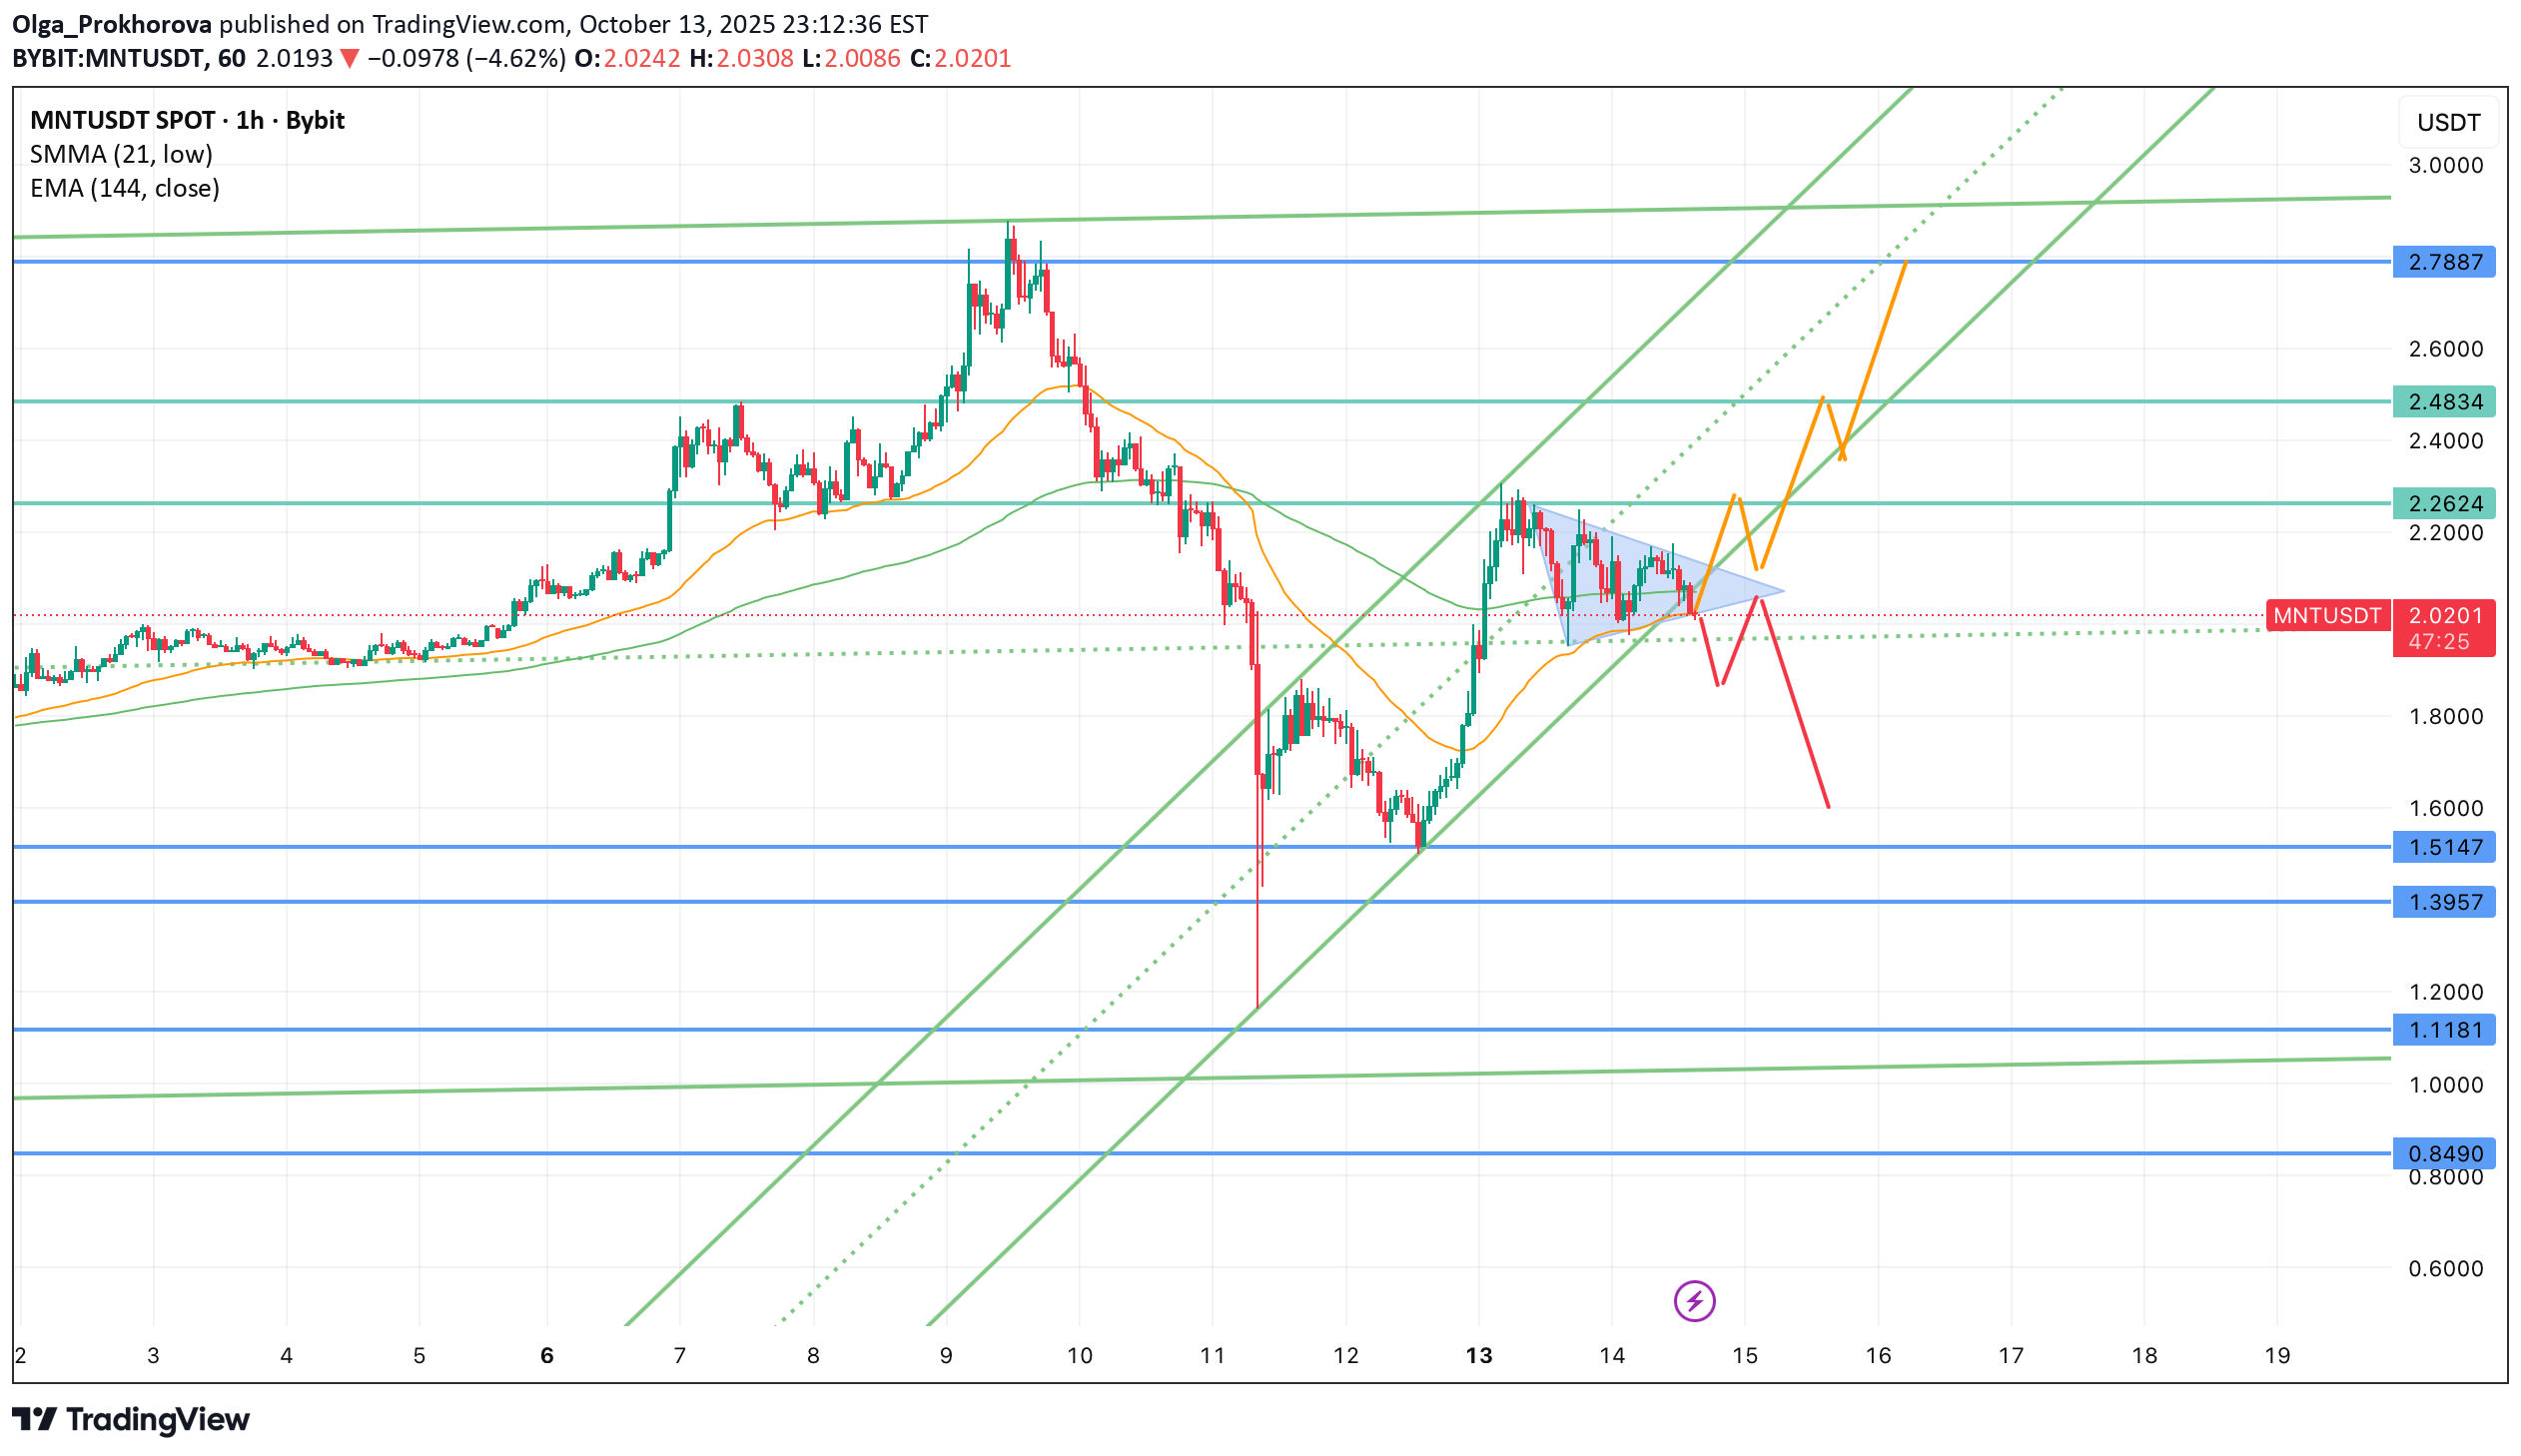
After a sharp recovery from the $1.39 support area, MNT is consolidating inside a symmetrical triangle just above the 21-hour SMMA and 144-EMA. This zone is shaping up as a classic continuation or reversal setup – the market is gathering energy for the next leg. Scenarios 🟢 Bullish breakout: If price breaks and holds above $2.06–$2.10, it opens the road toward the next resistance levels: $2.26 (local supply zone / previous structure high) $2.48 Extended target: $2.78 🔴 Bearish rejection: Failure to hold the current ascending channel may trigger a move down toward: $1.51 $1.39 (major liquidity area and 50% retracement zone) Technical outlook Structure: Symmetrical triangle within a broader uptrend channel Momentum: Neutral – consolidation after impulse Trade idea: Wait for breakout confirmation and retest. Entry (breakout long): > $2.10 Stop-loss: below $1.95 TP1: $2.26, TP2: $2.48, TP3: $2.78 ⚠️ Not financial advice. For educational and analytical purposes only.📈 Personally holding a long position from $1.60 — managing risk while targeting the upper channel zone.
Disclaimer
Any content and materials included in Sahmeto's website and official communication channels are a compilation of personal opinions and analyses and are not binding. They do not constitute any recommendation for buying, selling, entering or exiting the stock market and cryptocurrency market. Also, all news and analyses included in the website and channels are merely republished information from official and unofficial domestic and foreign sources, and it is obvious that users of the said content are responsible for following up and ensuring the authenticity and accuracy of the materials. Therefore, while disclaiming responsibility, it is declared that the responsibility for any decision-making, action, and potential profit and loss in the capital market and cryptocurrency market lies with the trader.