
Olga_Prokhorova
@t_Olga_Prokhorova

What symbols does the trader recommend buying?
Purchase History
پیام های تریدر
Filter
MNT/USDT در آستانه انفجار: منتظر شکست کدام قیمت باشیم؟
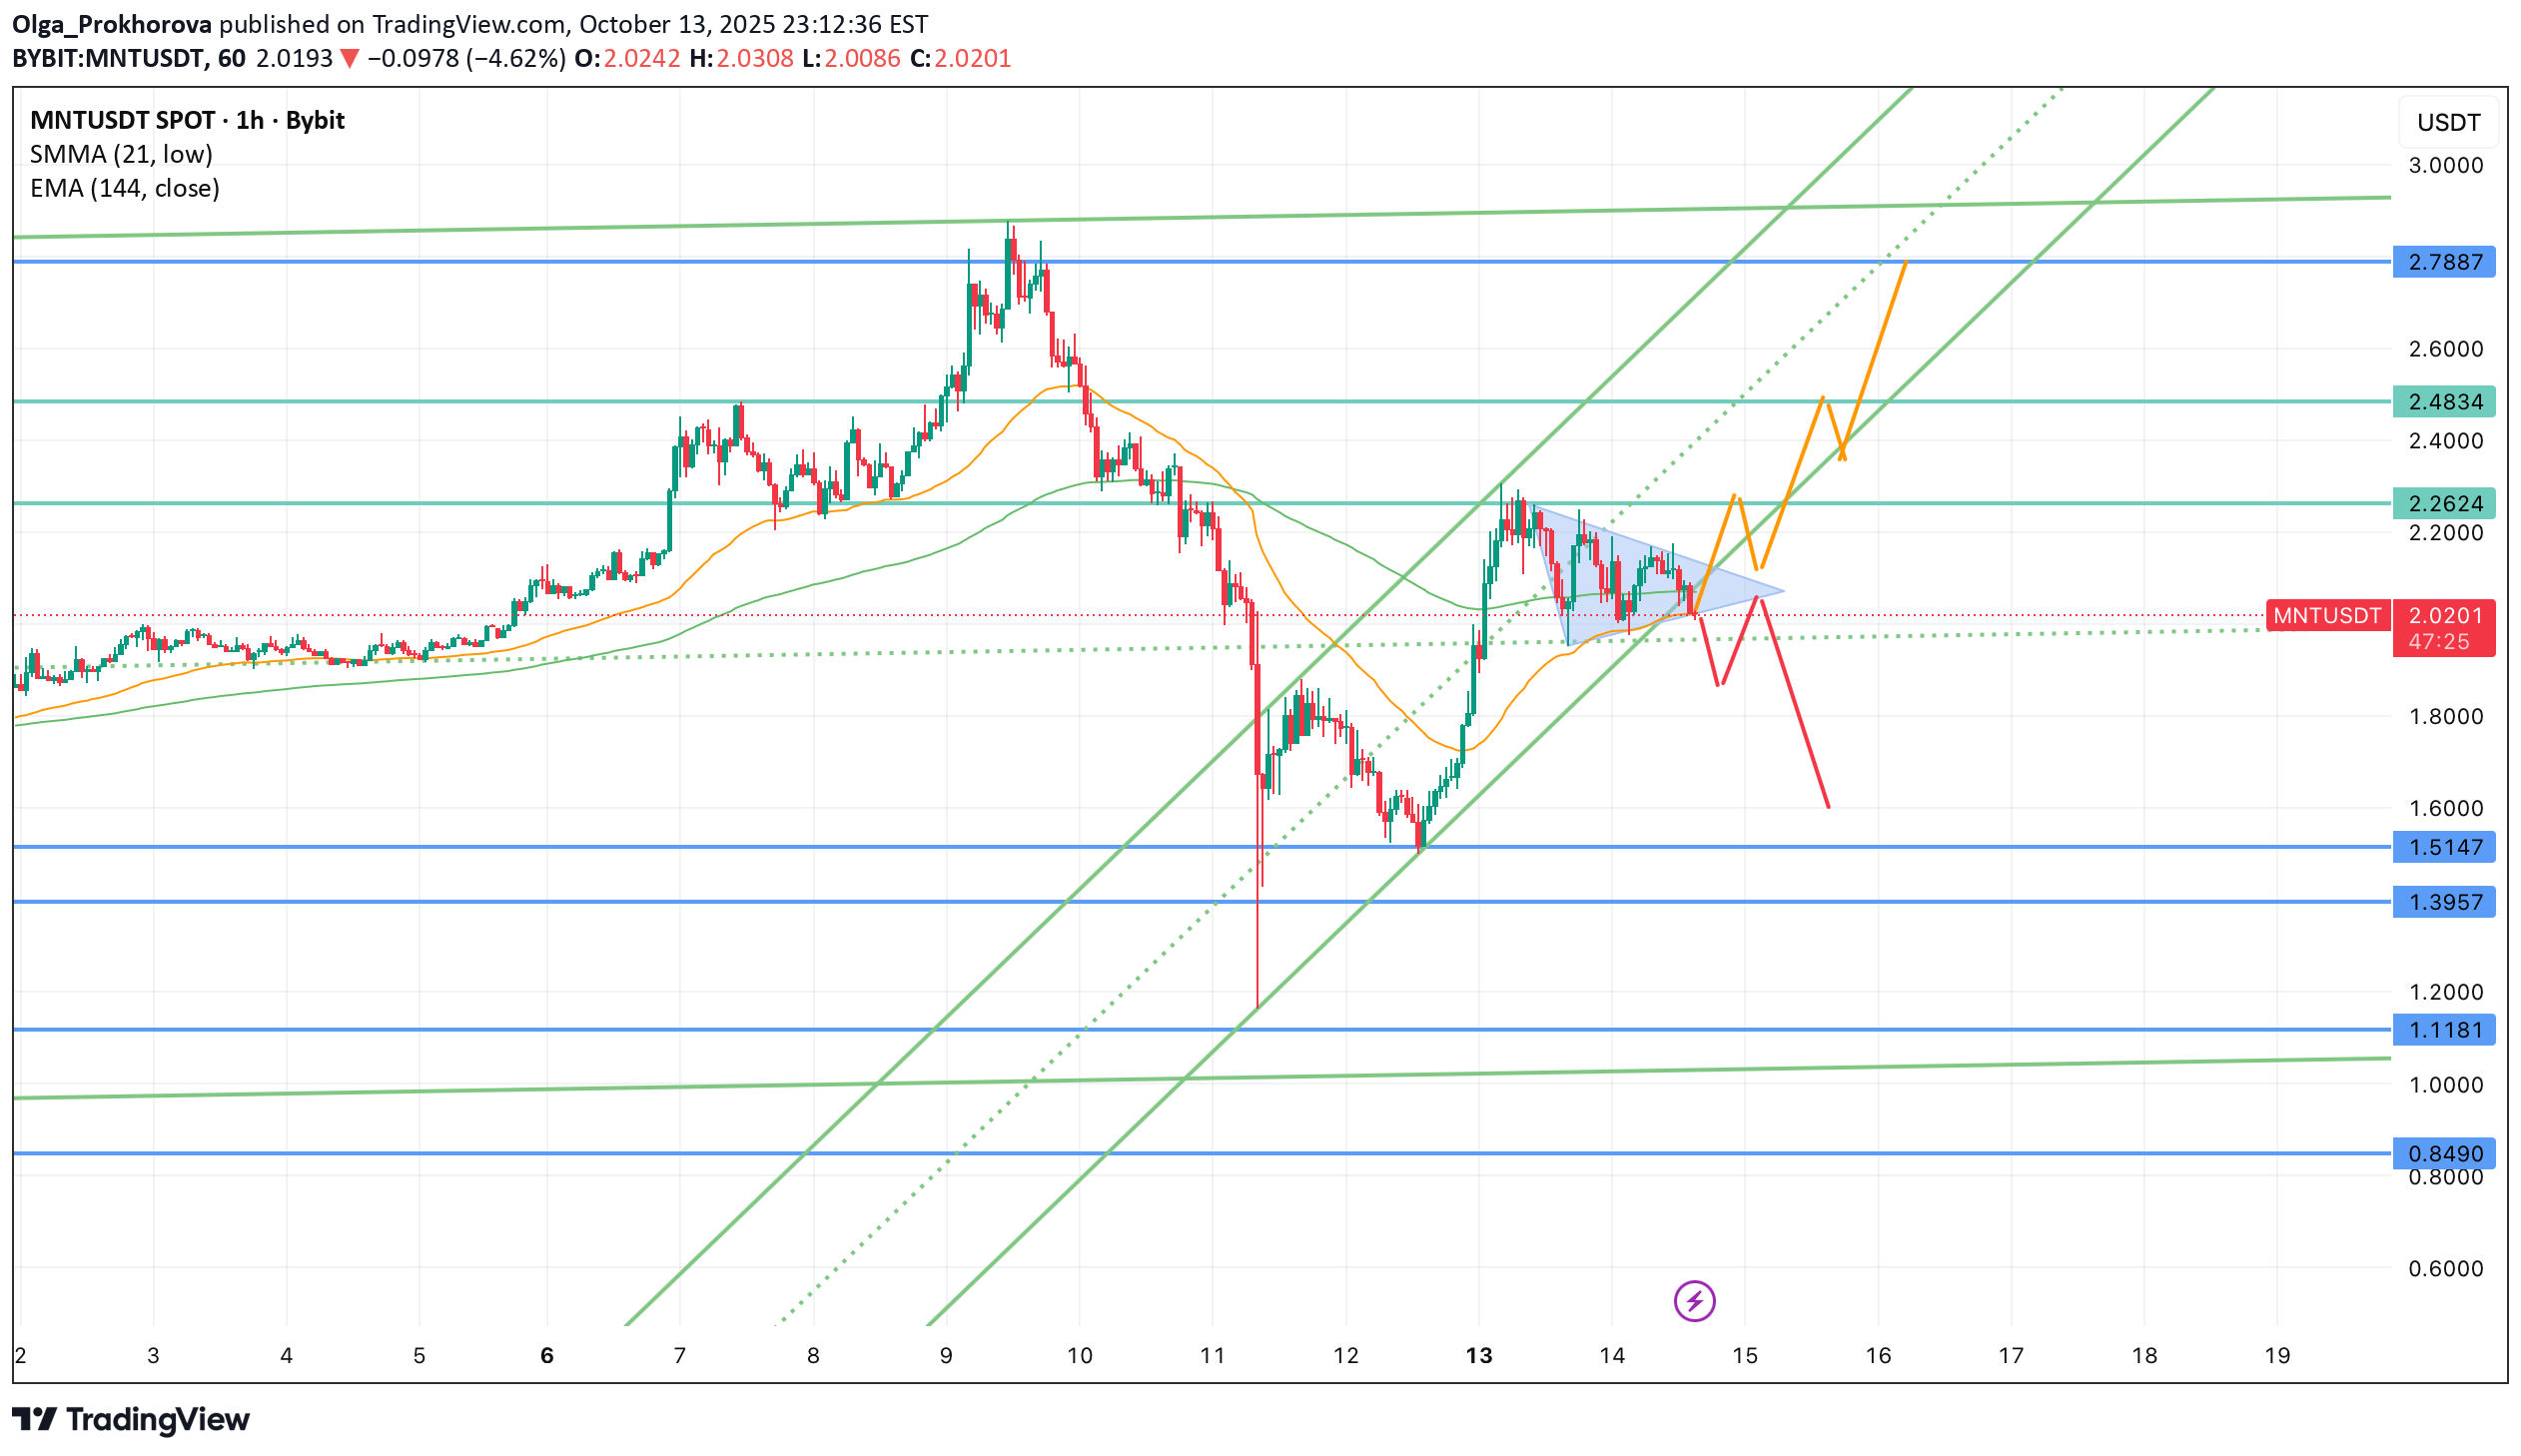
After a sharp recovery from the $1.39 support area, MNT is consolidating inside a symmetrical triangle just above the 21-hour SMMA and 144-EMA. This zone is shaping up as a classic continuation or reversal setup – the market is gathering energy for the next leg. Scenarios 🟢 Bullish breakout: If price breaks and holds above $2.06–$2.10, it opens the road toward the next resistance levels: $2.26 (local supply zone / previous structure high) $2.48 Extended target: $2.78 🔴 Bearish rejection: Failure to hold the current ascending channel may trigger a move down toward: $1.51 $1.39 (major liquidity area and 50% retracement zone) Technical outlook Structure: Symmetrical triangle within a broader uptrend channel Momentum: Neutral – consolidation after impulse Trade idea: Wait for breakout confirmation and retest. Entry (breakout long): > $2.10 Stop-loss: below $1.95 TP1: $2.26, TP2: $2.48, TP3: $2.78 ⚠️ Not financial advice. For educational and analytical purposes only.📈 Personally holding a long position from $1.60 — managing risk while targeting the upper channel zone.
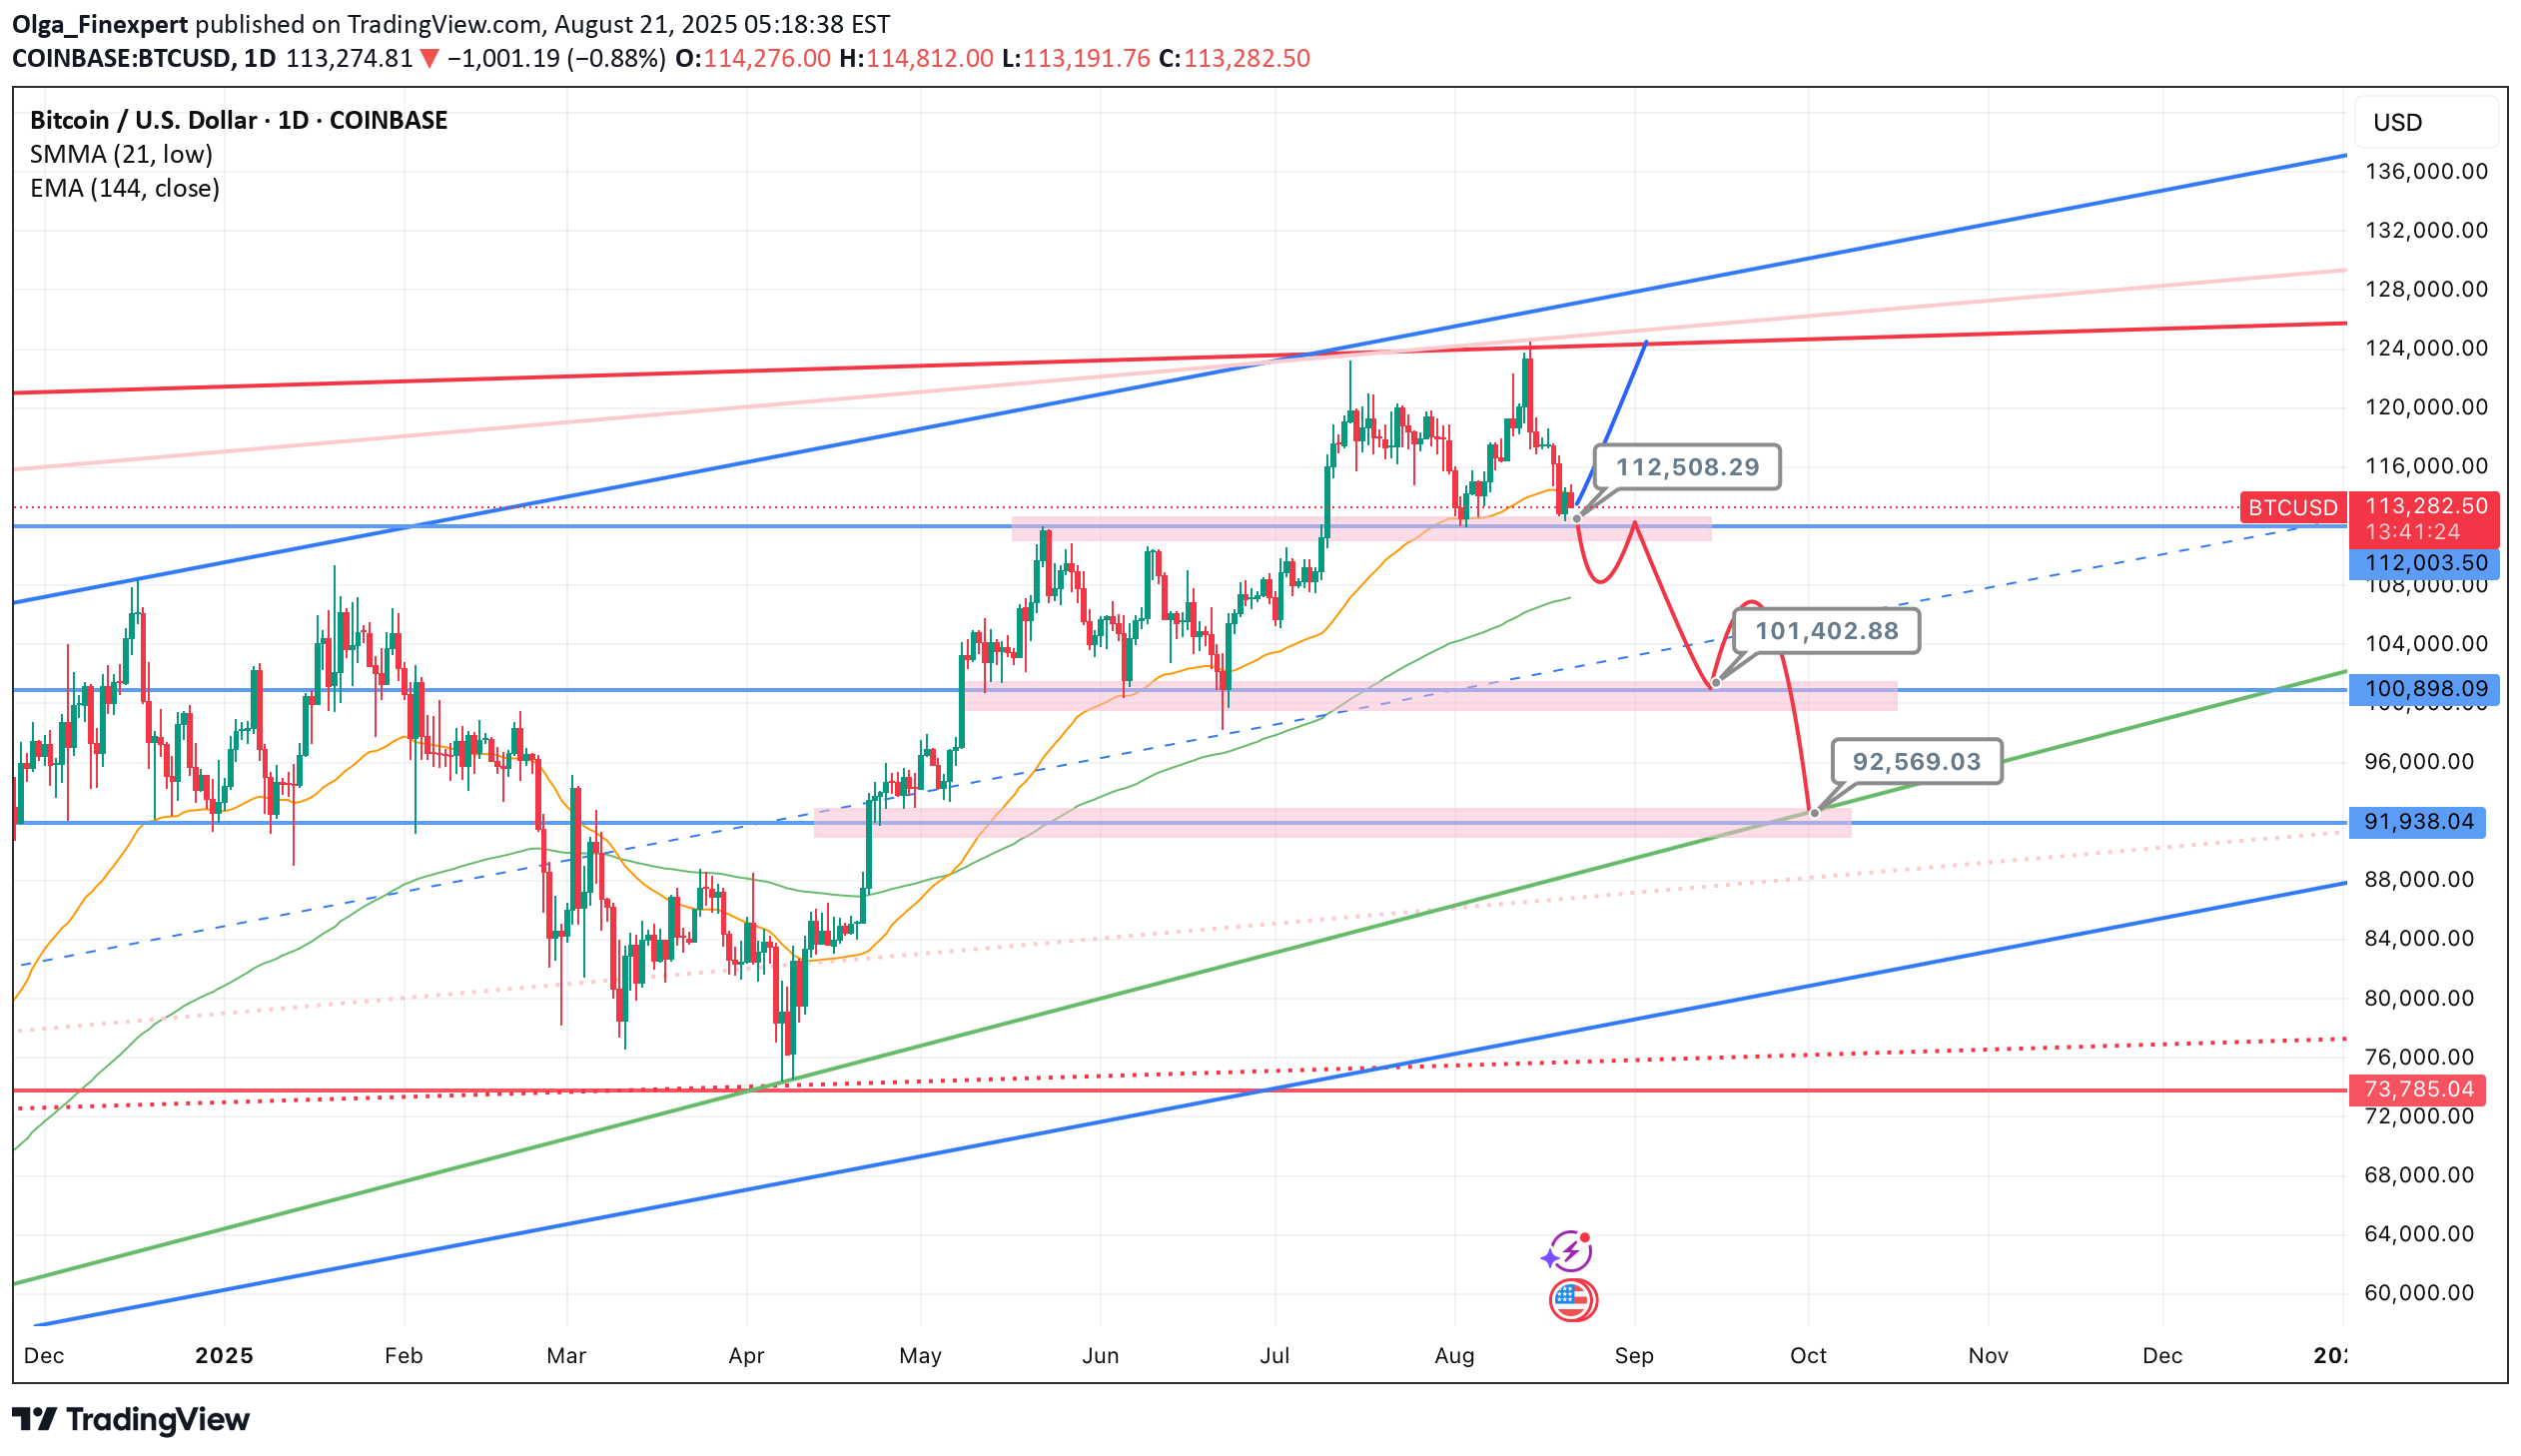
According to on-chain data, BTC’s move to $125K was driven by short liquidations, not new capital inflow, therefore a rejection of highs into further consolidation was expected, after confirming by technical analysis reversal pattern. When rallies aren’t backed by real inflows, the downside tends to be ruthless. After rally printed a new all-time high, then tactical traders triggered a chain of long liquidations. So the question now is—was this just a flush before a fresh leg up? Or is this market still unwinding? I remain bullish from current levels. The recent drop looks more like a healthy correction than a trend reversal. Key Risk: The bullish scenario breaks if $112,200 support fails and we see a confirmed reversal structure (not just one wick/ short-term candle, but several days of follow-through). Support Levels to Watch (Buy-the-Dip Zones): $112,500 $101,400 $92,600 Macro View: Liquidity signals continue to improve, profit-taking is largely complete, and we don’t see a cycle top yet. Long-term structure remains bullish, and this pullback should be seen as an accumulation opportunity. Disclaimer: Markets are subject to unpredictable events and the randomness of markets, please use appropriate risk management. DYOR
Disclaimer
Any content and materials included in Sahmeto's website and official communication channels are a compilation of personal opinions and analyses and are not binding. They do not constitute any recommendation for buying, selling, entering or exiting the stock market and cryptocurrency market. Also, all news and analyses included in the website and channels are merely republished information from official and unofficial domestic and foreign sources, and it is obvious that users of the said content are responsible for following up and ensuring the authenticity and accuracy of the materials. Therefore, while disclaiming responsibility, it is declared that the responsibility for any decision-making, action, and potential profit and loss in the capital market and cryptocurrency market lies with the trader.