
METAX
Meta tokenized stock (xStock)
| تریدر | نوع سیگنال | حد سود/ضرر | زمان انتشار | مشاهده پیام |
|---|---|---|---|---|
 wijithaRank: 1335 | خرید | حد سود: تعیین نشده حد ضرر: تعیین نشده | 21 hour ago | |
 JenRzRank: 1888 | خرید | حد سود: تعیین نشده حد ضرر: تعیین نشده | 12/11/2025 | |
 NYSE_TechFundRank: 3282 | خرید | حد سود: تعیین نشده حد ضرر: تعیین نشده | 12/23/2025 | |
 Krishm30Rank: 3977 | خرید | حد سود: تعیین نشده حد ضرر: تعیین نشده | 12/11/2025 | |
 TanukiTradeRank: 15108 | خرید | حد سود: تعیین نشده حد ضرر: تعیین نشده | 12/18/2025 |
Price Chart of Meta tokenized stock (xStock)
سود 3 Months :
سیگنالهای Meta tokenized stock (xStock)
Filter
Sort messages by
Trader Type
Time Frame
wijitha
BULLISH MOMENTUM

In the context of the current bullish trend, I prefer to hold off on making an entry until there is a clear indication that the trend will persist. It's important to note that this strategy reflects my individual viewpoint and should not be considered as investment advice. Good luck with your trading decision! Remember to stay informed and analyze market conditions thoroughly before making any moves. Understanding the broader macroeconomic factors and keeping an eye on key indicators can provide valuable insights. Stay disciplined, trust your strategy, and always be prepared to adapt as the market evolves. Happy trading!
NYSE_TechFund
META: AI Dominance & Institutional Support - The Path to $960

As we head into the final weeks of 2025, META remains a top conviction play within the NYSE_techfund framework. Following our strategic entry at $647.4 on Nov 28, the stock has shown resilient strength, establishing a new floor at $661.50. Fundamental Catalysts: The primary driver remains the "AI-Flywheel" effect. Institutional data indicates that Meta’s AI infrastructure is significantly lowering ad costs while increasing conversion—a "walled garden" that is becoming impenetrable for competitors. The 24-month investment cycle is now transitioning from a cost-burden to a high-margin revenue stream. Institutional Sentiment (Dec 2025 Updates): Current Wall Street consensus reinforces our bullish bias. Technical Outlook: The chart confirms a bullish breakout from the November consolidation. Immediate Support: $647.4 (Entry Zone). Primary Target: $813. Secondary Target: $960. The Bottom Line: The convergence of technical momentum and fundamental maturity suggests further upside. We are staying long as the risk/reward remains skewed to the upside.

Hello trader, META: 661.50

Below are the marked prices or lines; this is just to give you a better understanding of the price levels. The stock's opening price is around the closing price and its technical price (660.00) A quick bullish entry is at 660.00, targeting 672.00, but if it breaks above 672.00, look for a continuation of the uptrend. However, be careful, as there is a strong resistance zone at 676.00, potentially forming a double top. A bearish entry is below with a possible drop to the previous low of 660.00.

بازار فلزات: همه آنچه باید درباره سرمایهگذاری و معاملات فلزات بدانید

1. Types of Metals The metals market is broadly categorized into two segments: precious metals and industrial metals. Precious Metals: These include gold, silver, platinum, and palladium. They are considered valuable due to their rarity and historical use as a store of wealth. Precious metals are often used in jewelry, electronics, and as financial hedges against inflation and currency risks. Industrial Metals: These include copper, aluminum, zinc, nickel, and lead. They are widely used in construction, automotive, and manufacturing sectors. Their prices are influenced by global economic activity and industrial demand. 2. Market Participants The metals market is complex and involves multiple participants, each with different objectives: Producers: Mining companies extract metals from the earth and sell them to refiners or directly to industrial users. Examples include BHP, Rio Tinto, and Vale. Consumers: Industrial users, such as construction firms, electronics manufacturers, and automotive companies, purchase metals for production. Investors: Individuals and institutions invest in metals to diversify their portfolios, hedge risks, or speculate on price movements. Investment channels include physical metals, futures contracts, ETFs, and mutual funds. Speculators and Traders: Traders in commodities exchanges and over-the-counter (OTC) markets buy and sell metals to profit from price fluctuations. They provide liquidity to the market. Governments and Central Banks: Central banks often hold gold reserves, which can influence global prices, while governments regulate mining and trade policies. 3. How Metals Are Traded Metals can be traded in physical or financial markets: a. Physical Market In the physical market, metals are bought and sold in their actual form, such as bars, coins, or sheets. This market is essential for industrial use and jewelry manufacturing. Prices in the physical market are influenced by immediate supply and demand, logistics, and quality specifications. b. Futures Market Futures contracts are standardized agreements to buy or sell a metal at a predetermined price on a future date. Futures are traded on commodities exchanges such as the London Metal Exchange (LME) or COMEX in New York. They allow producers and consumers to hedge against price volatility, while traders can speculate on price movements. c. Spot Market The spot market involves the immediate buying and selling of metals for delivery “on the spot,” usually within two business days. Spot prices reflect real-time supply and demand conditions. d. Exchange-Traded Funds (ETFs) and Derivatives Investors can gain exposure to metals without physically owning them. ETFs track the price of metals, while options and swaps allow for complex financial strategies. These instruments increase liquidity and provide more ways to hedge or speculate. 4. Factors Influencing Metals Prices The prices of metals are influenced by a combination of fundamental, economic, and geopolitical factors. a. Supply Factors Mining Output: Production levels from major mining countries directly impact supply. Strikes, natural disasters, or political instability can reduce output. Inventory Levels: Stockpiles in warehouses and exchanges can buffer supply disruptions, affecting market prices. b. Demand Factors Industrial Demand: Construction, automotive, electronics, and renewable energy projects drive demand for industrial metals. Investment Demand: Economic uncertainty and inflation often push investors toward precious metals as a safe haven. Technological Trends: Advancements in technology, such as electric vehicles, increase demand for certain metals like lithium and nickel. c. Economic and Financial Factors Interest Rates: Higher interest rates tend to reduce investment demand for non-yielding assets like gold. Currency Movements: Metals are usually priced in U.S. dollars. A stronger dollar makes metals more expensive for other currencies, reducing demand. Global Growth: Economic expansion increases demand for industrial metals, while recessions reduce it. d. Geopolitical and Environmental Factors Trade Policies: Tariffs and export restrictions can limit supply or increase costs. Environmental Regulations: Mining regulations and sustainability concerns can affect production. Global Conflicts: Wars or sanctions in metal-producing regions can create supply shocks. 5. Key Metal Markets and Exchanges Several global exchanges facilitate metal trading: London Metal Exchange (LME): The world’s largest market for industrial metals, including copper, aluminum, and zinc. COMEX (New York): Focused mainly on precious metals like gold and silver. Shanghai Futures Exchange (SHFE): Important for the Chinese market, trading metals like copper, aluminum, and steel. Multi Commodity Exchange (MCX) in India: Trades metals such as gold, silver, copper, and aluminum for the Indian market. These exchanges provide standardized contracts, clearing mechanisms, and transparent pricing, which help stabilize the market. 6. Role of Speculation and Hedging Speculation and hedging are two primary motivations in metals trading: Hedging: Producers and consumers use futures and options to lock in prices and reduce exposure to market volatility. For example, a copper producer may sell futures contracts to secure a future price, protecting against a potential price drop. Speculation: Traders aim to profit from price fluctuations. Speculators provide liquidity and can sometimes amplify price movements, creating volatility in short-term markets. 7. Metals as an Investment Metals, especially precious metals, are considered safe-haven assets. They protect against currency depreciation, inflation, and market instability. Investors can choose to: Buy Physical Metals: Gold coins, silver bars, or bullion. Invest in ETFs: Track metal prices without owning physical metal. Trade Futures and Options: For more advanced strategies and leverage. Invest in Mining Stocks: Gain exposure to metal production and potential profits from rising prices. Diversifying into metals can help balance a portfolio and reduce risk, particularly during economic uncertainty. 8. Challenges in the Metals Market Despite its importance, the metals market faces challenges: Price Volatility: Metal prices can be highly volatile due to supply shocks, economic changes, or speculative trading. Environmental Concerns: Mining operations often face strict environmental regulations and societal pressure. Geopolitical Risks: Metals sourced from politically unstable regions can face supply disruptions. Technological Shifts: The rise of alternative materials can reduce demand for certain metals. 9. Future Trends in the Metals Market The metals market is evolving with global trends: Green Energy Transition: Increased demand for metals like lithium, cobalt, and nickel for batteries and renewable energy technologies. Digitalization: Improved trading platforms and real-time analytics are transforming metal trading. Sustainability: Responsible mining practices and recycling of metals are becoming crucial. Global Supply Chain Shifts: New mining projects in Africa, South America, and Asia are changing the global supply dynamics. Conclusion The metals market is a complex and dynamic system that reflects global economic trends, industrial demand, and investor sentiment. Understanding the types of metals, key market participants, trading mechanisms, and influencing factors is essential for anyone involved in investing, industry, or policy. While opportunities in this market are abundant, they come with risks, requiring careful analysis, monitoring of global trends, and strategic decision-making. As the world transitions toward sustainable energy and technology-driven growth, the metals market will continue to play a pivotal role in shaping the global economy.

WeTradeWAVES
META Regains Direction as Price Rebuilds Momentum
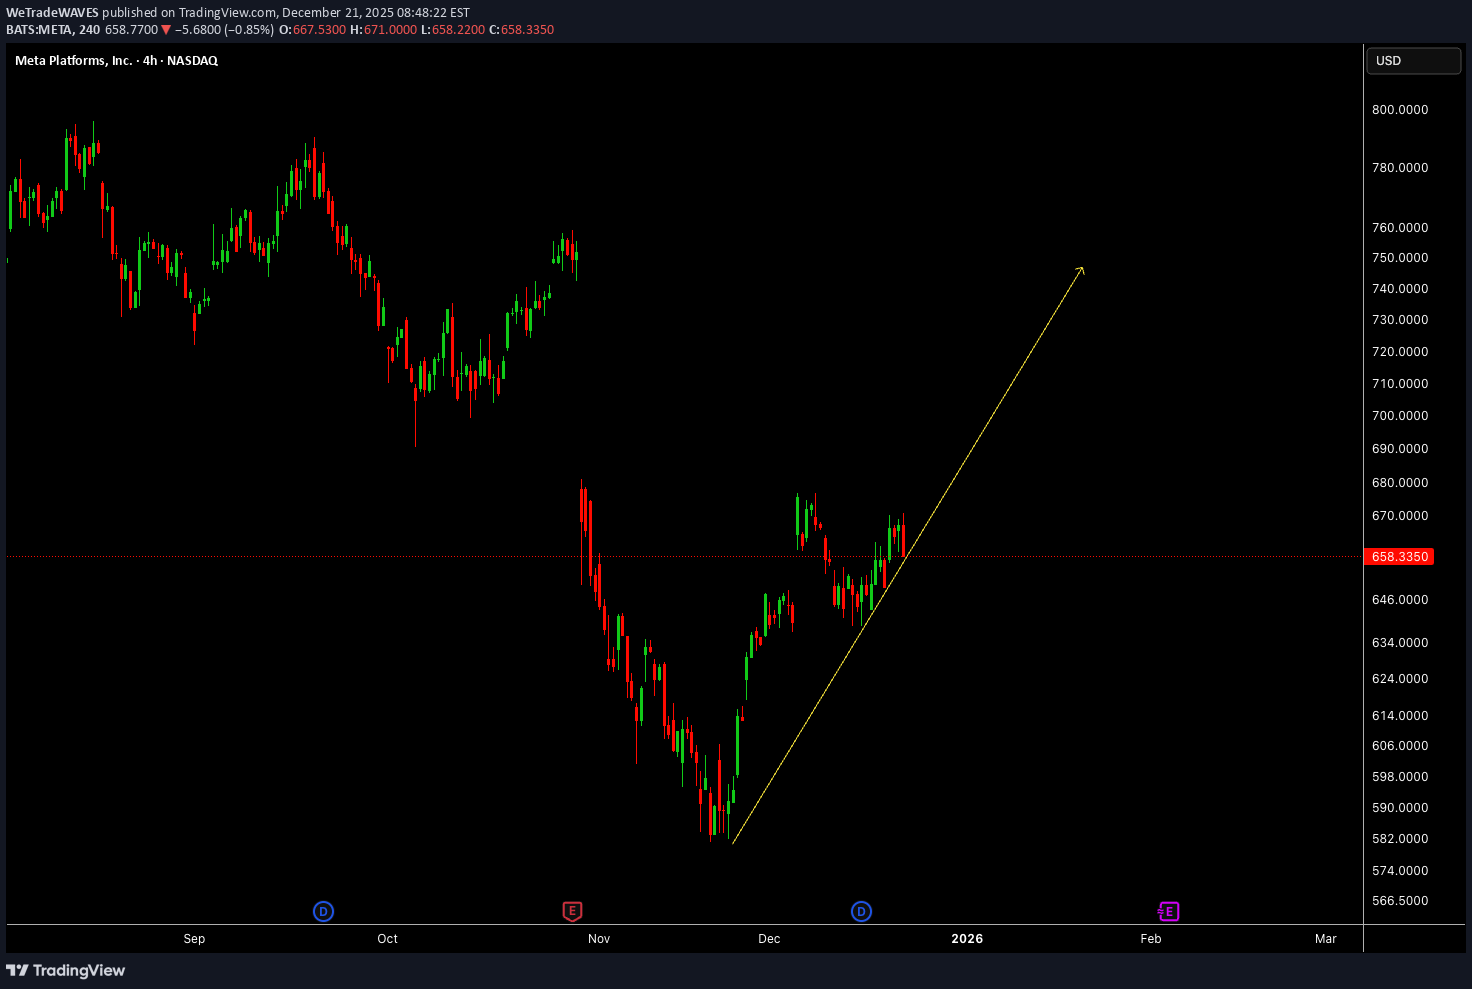
Meta Platforms is showing a constructive shift in price behaviour on the 4H timeframe after a corrective phase, with structure beginning to realign in favour of continuation. The recent recovery suggests buyers are gradually reasserting control as the market reassesses growth expectations and broader tech sentiment. Rather than impulsive movement, price is advancing in a more measured manner, often seen when confidence starts to rebuild. This phase remains important as META positions itself for the next leg of directional expansion. Disclosure: We are part of Trade Nation's Influencer program and receive a monthly fee for using their TradingView charts in our analysis.

Meta: Upward Pressure

Recently, Meta has experienced renewed upward pressure, pushing toward the resistance level at $690.55. Should this level be surpassed next, we might expect stronger (corrective) climbs up to a new high for green wave alt. [B] near the resistance at $906.60 (probability: 37%). Primarily, we consider the regular wave [B] as already completed and anticipate that the ongoing magenta downward impulse will gradually extend below the support at $580.29.

AlfonsoMoreno
Meta Platforms $META stock demand level is playing out
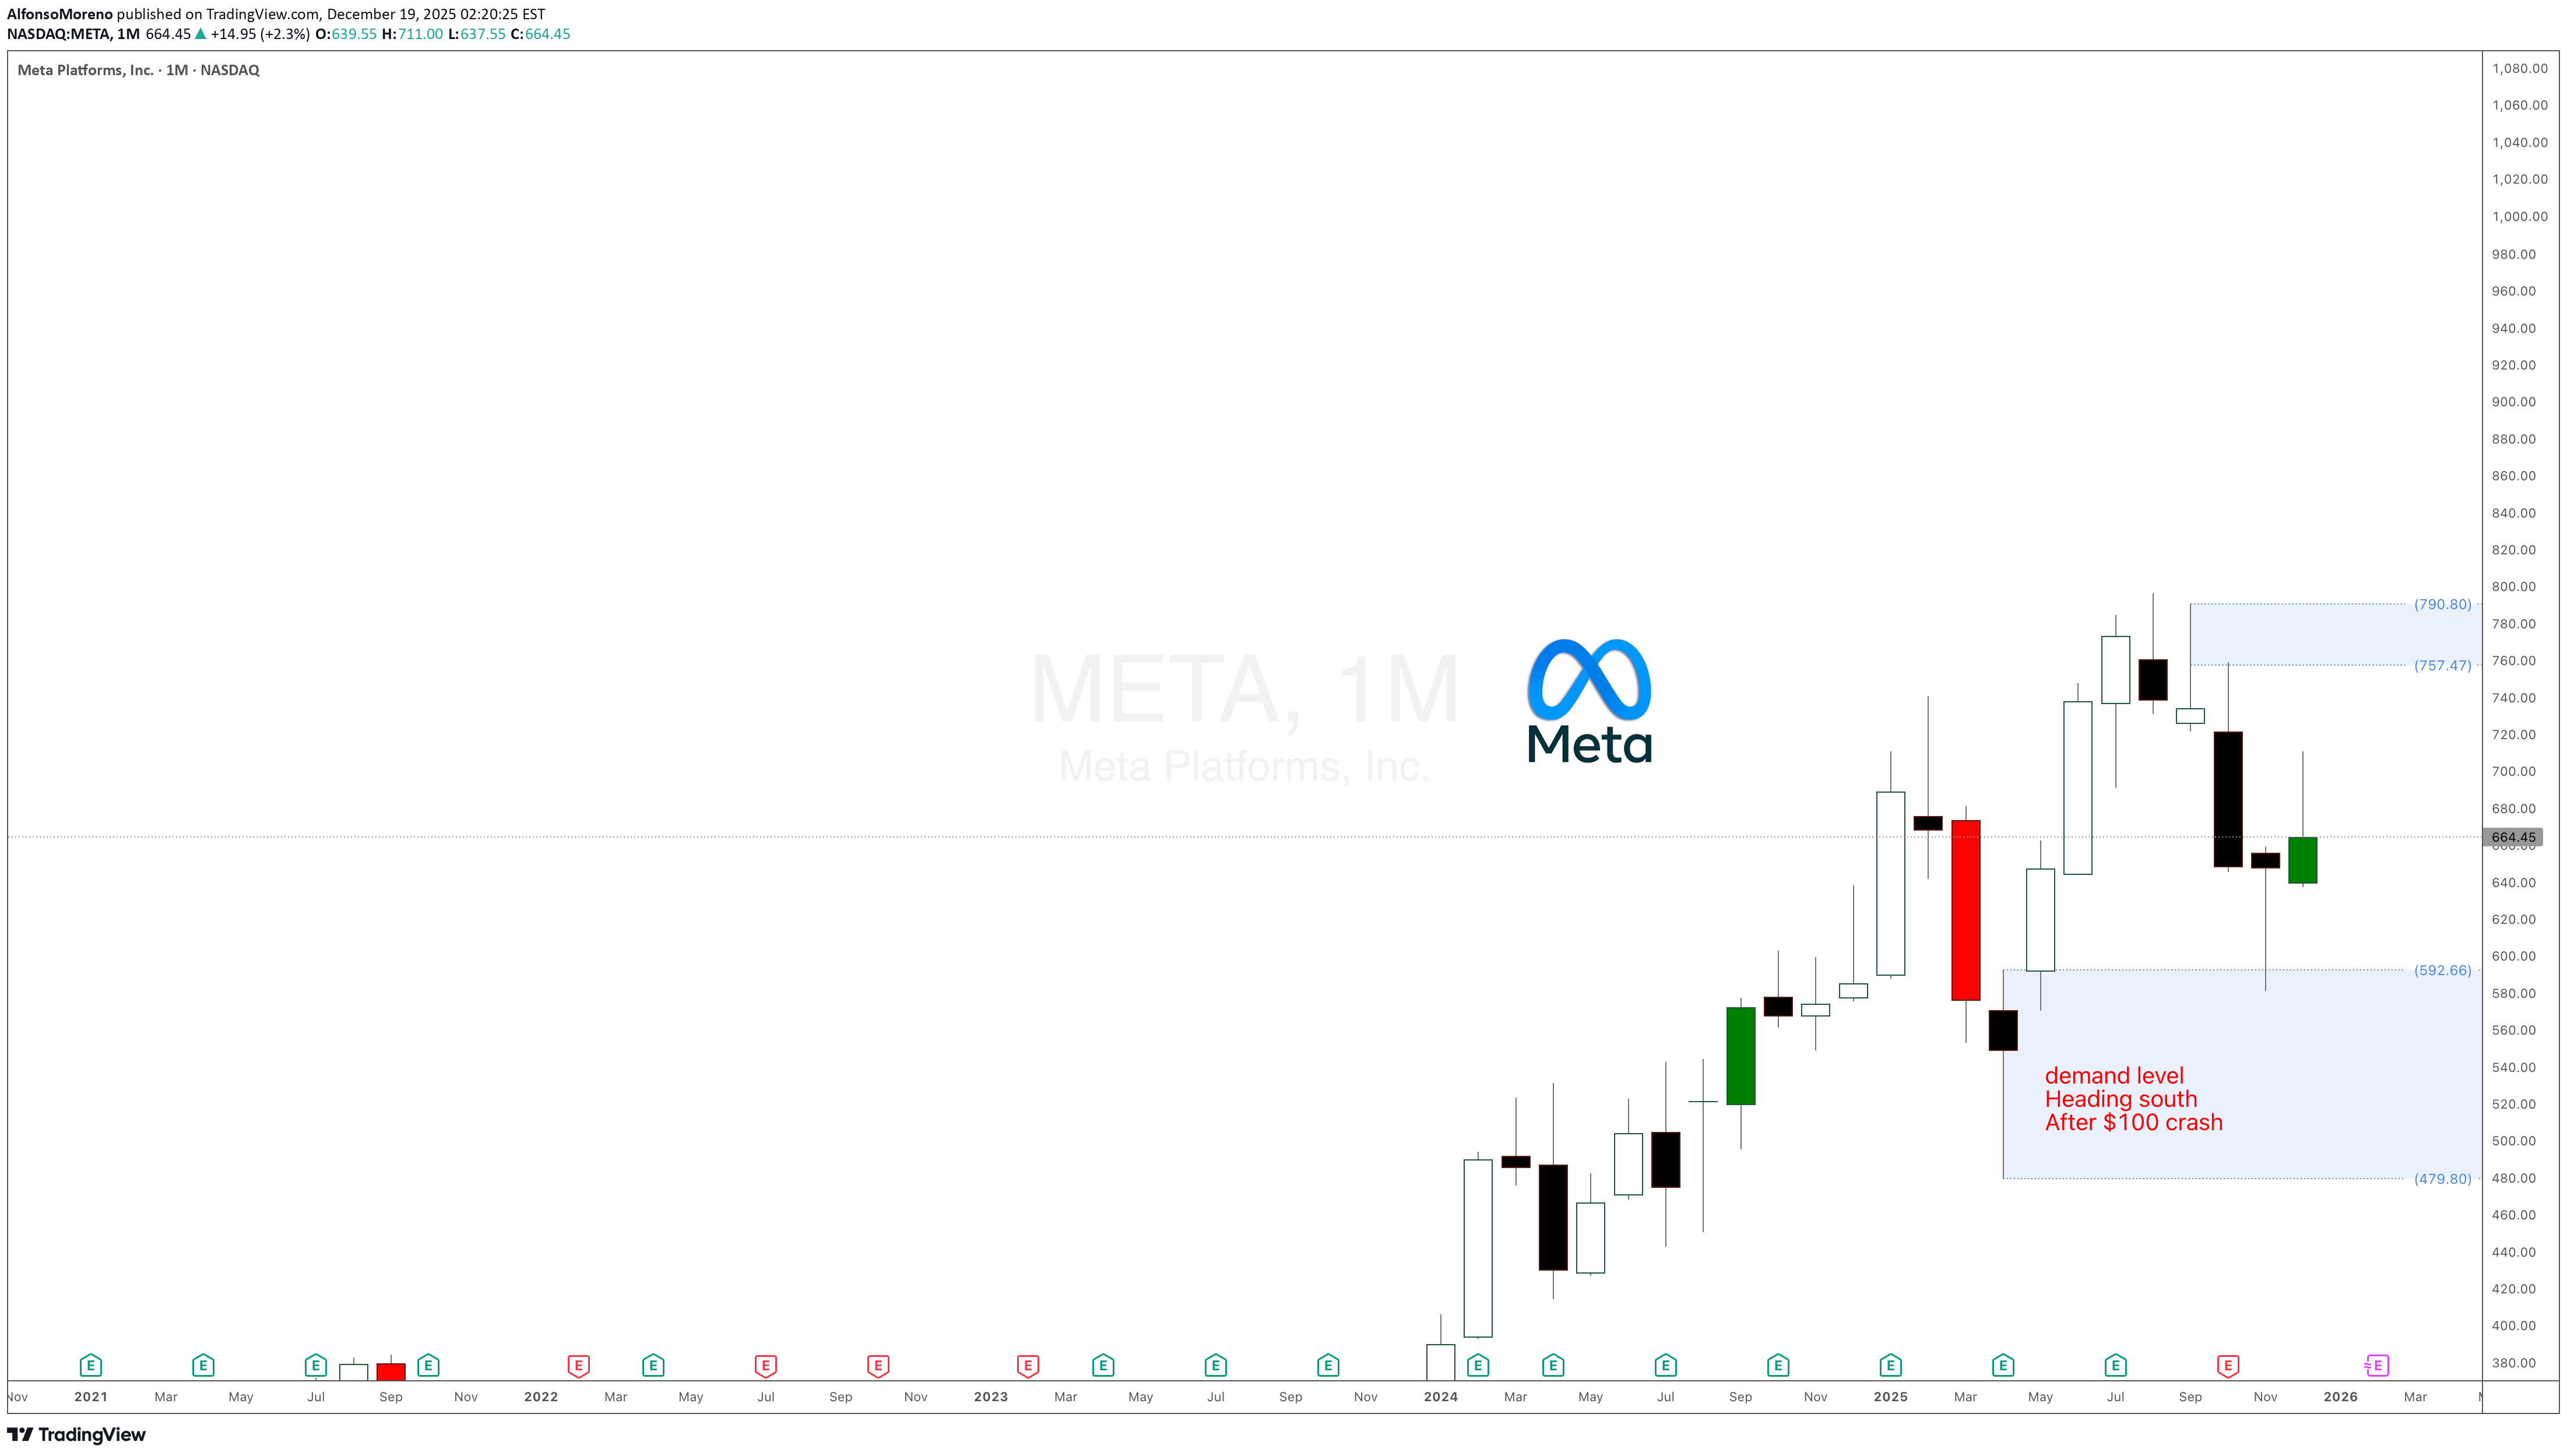
Meta Platforms META stock demand level is playing out after the demand level at $100 took control, as expected and mentioned in the previous update. Waiting for new bullish legs.
TanukiTrade
Positive GEX Profile Points Toward 700 Gap Fill

META – Holding Above HVL, 50 DMA Reclaim in Progress, Upside Call Resistance at 700 META is currently trading below the 200-day moving average , but recent price action suggests a potential structural improvement rather than continued weakness. From an options perspective, the broader structure remains Positive GEX , indicating that dealer positioning is still supportive on pullbacks. At the same time, IV remains low , which typically favors range expansion and directional follow-through once key technical levels are reclaimed. On the daily chart, price is now starting to reclaim the 50-day moving average , a level that previously acted as dynamic resistance. Importantly, META is also holding above the High Volatility Level (HVL) , which keeps the short-term regime constructive rather than defensive. Volatility conditions remain favorable: Call Pricing Skew is elevated (~31.6%), showing persistent call demand IV remains controlled, allowing price to move without immediate volatility compression pressure Looking forward, the most important upside call resistance is the 700 level, which represents: Highest core call resistance on the Feb 20 (Optimal Monthly) expiration A major gap fill from the prior breakdown A clear technical resistance zone visible on the daily chart This confluence makes 700 a logical upside target if price can hold above HVL and fully reclaim the 50 DMA. Key structure to watch: 200 DMA – higher timeframe resistance overhead 50 DMA – short-term trend reclaim in progress HVL – holding above keeps structure constructive 700 – primary upside target (gap fill + core call resistance) As long as price holds above HVL with supportive GEX structure, rotational upside toward 700 remains the higher-probability path .
Meta is a fundamentally strong stock, supported by robust cash f
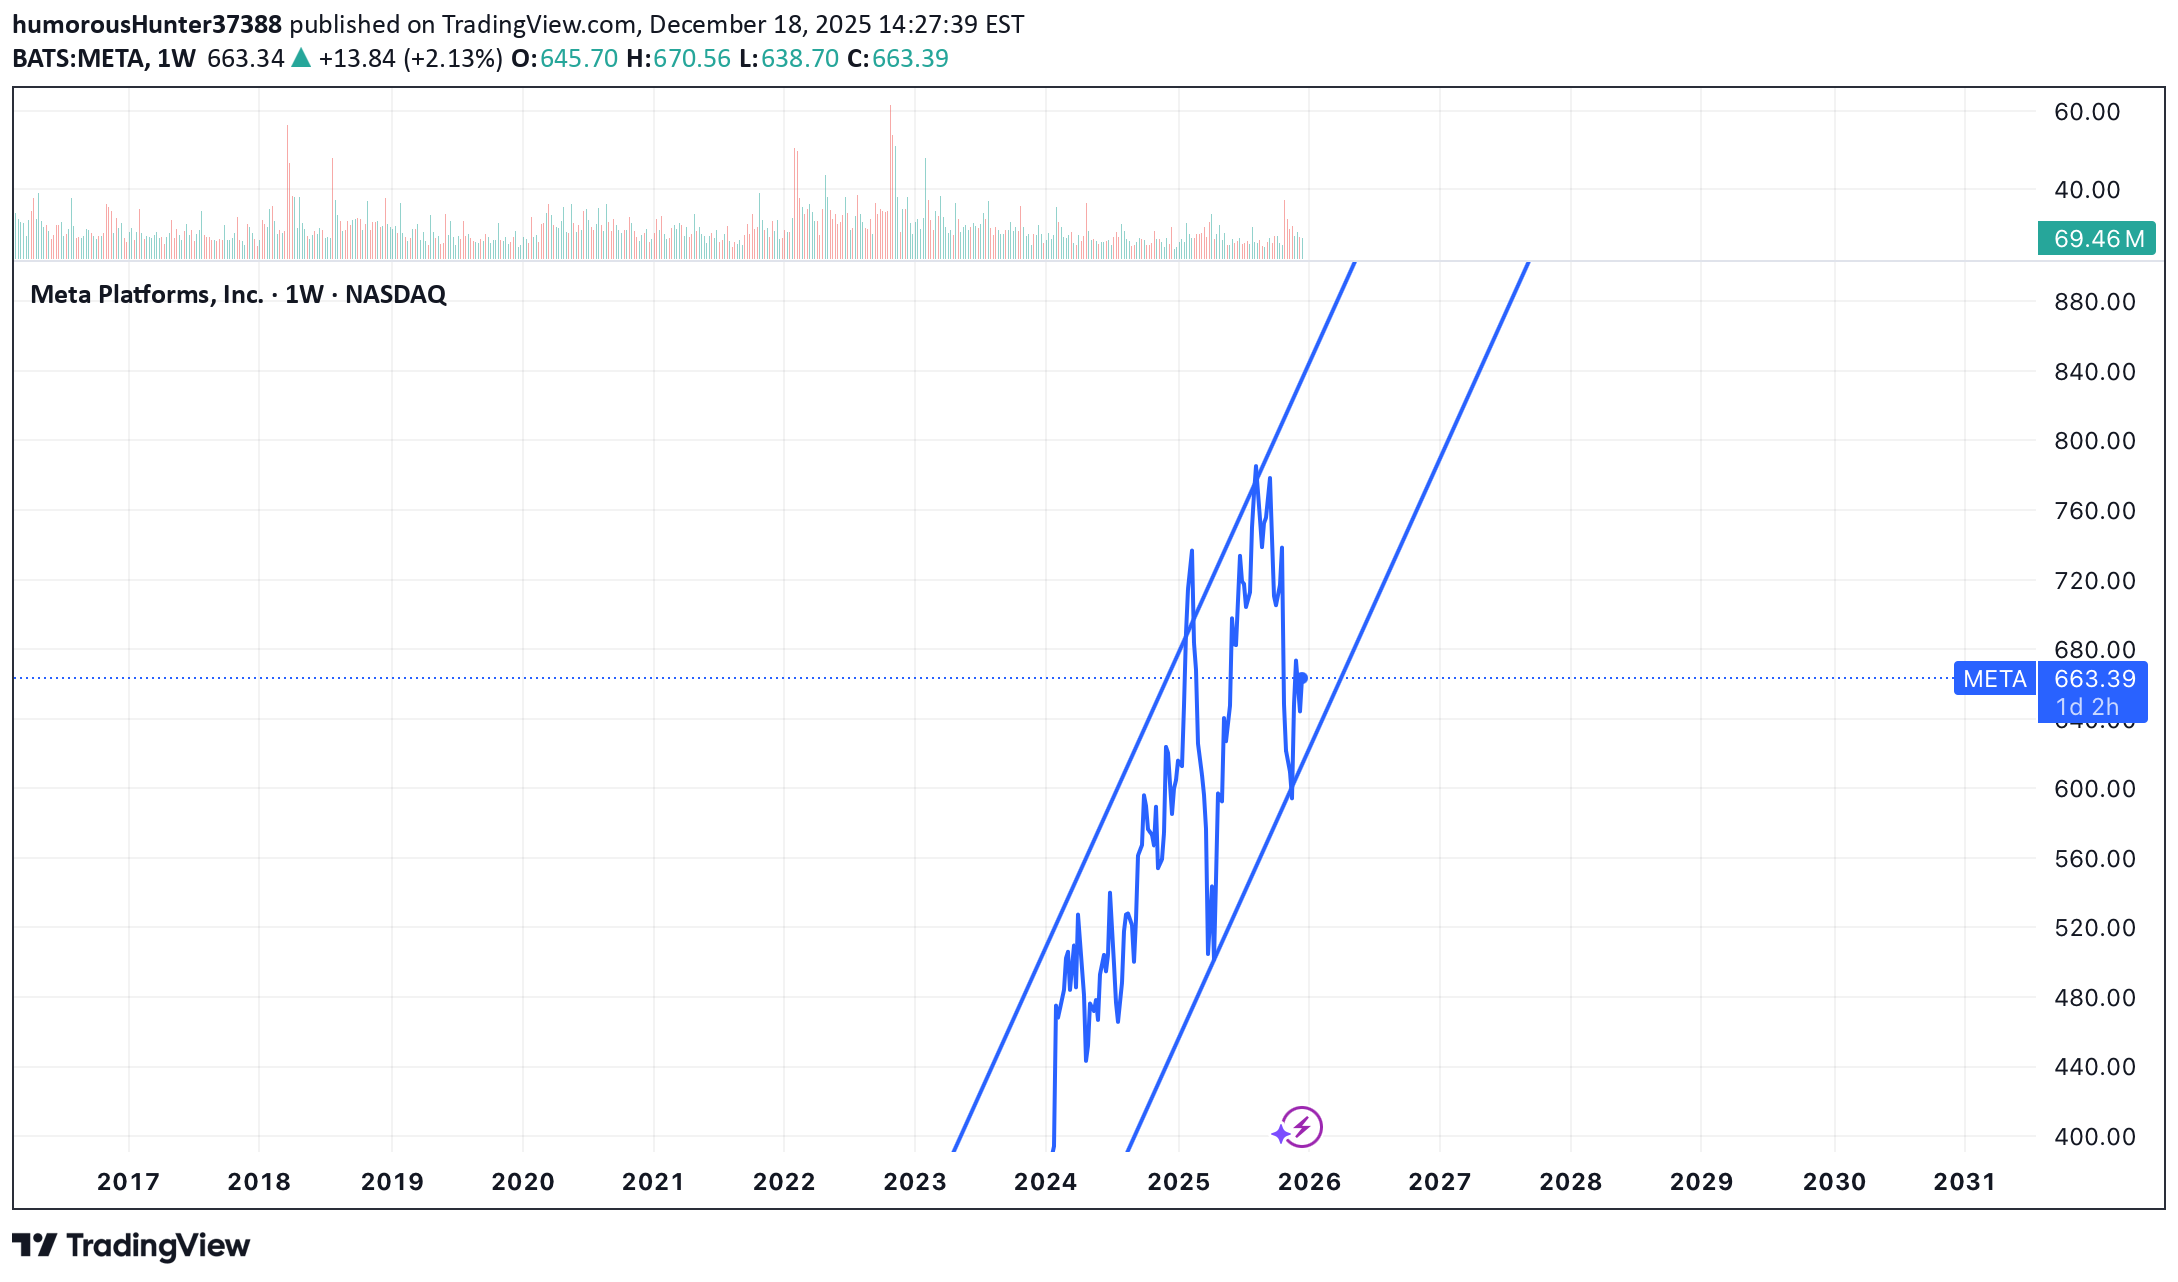
Meta is a fundamentally strong stock, supported by robust cash flows and long-term growth drivers. Mid-to-long-term bullish trend remains intact. Price is consolidating within an ascending channel, holding the lower diagonal support. Accumulation phase in progress around current levels.

The-Thief
META Momentum Builds! Bullish Swing Trade Roadmap
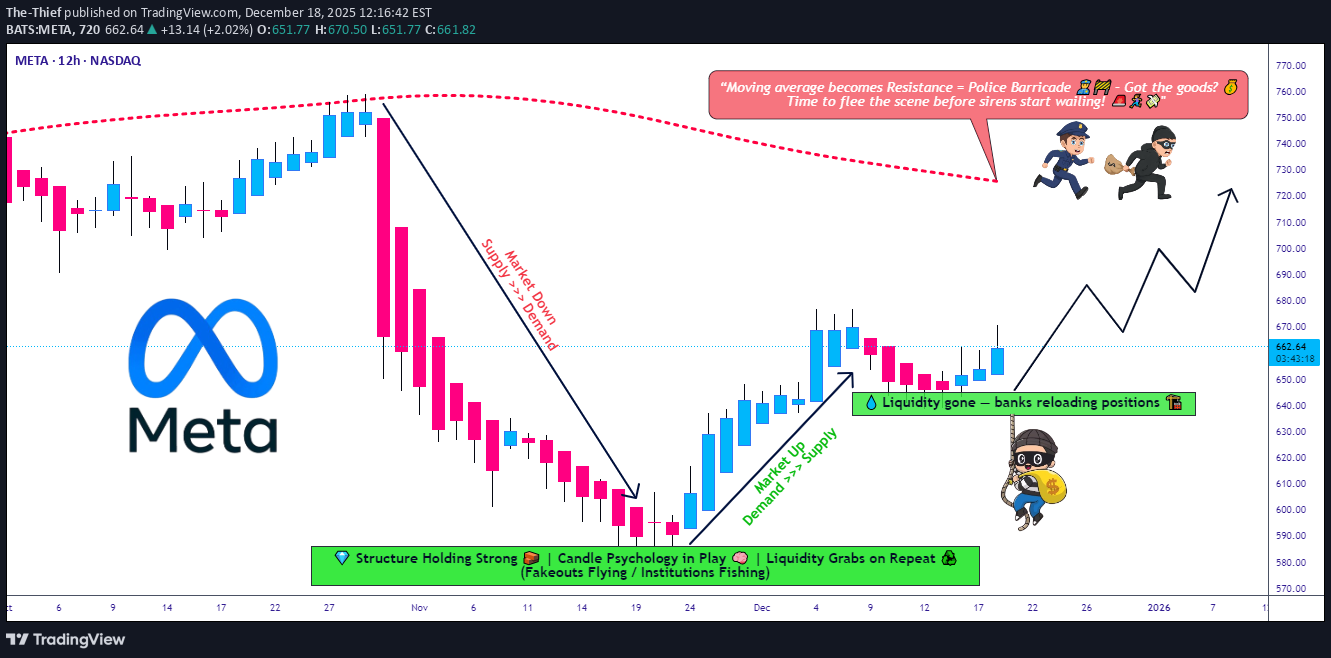
🚀 META: The Layered Entry Swing Play - AI Momentum Revival 📈 Executive Summary 💼 META Platforms sits at a pivotal technical juncture where institutional AI capex demand collides with short-term profit-taking. This swing trade targets the $720 resistance breach using a disciplined layered entry methodology — perfect for risk-managed traders seeking 3-5% upside with controlled downside. 📊 Trade Setup | Master Plan Asset: 🔵 META (NASDAQ) | Meta Platforms, Inc. Timeframe: Swing Trade (4-6 weeks) Bias: 🟢 BULLISH (Support Zone Recovery) Risk Appetite: Moderate to Aggressive 🎯 Entry Strategy | The Intelligent Layering System Rather than chasing a single entry price, we employ a pyramiding buy-in method across key support zones. This reduces emotional trading and improves risk-reward at scale. Multi-Layer Entry Points (Buy in Tranches): Layer 1 (Initial Position): $638.50 — 2% account risk Layer 2 (Dip Catch): $630.00 — 2% account risk Layer 3 (Strength Reload): $650.00 — 2% account risk Layer 4 (Breakout Confirmation): $660.00 — 1.5% account risk Total Allocation: ~7.5% per full setup (adjust per your risk tolerance) Rationale: Layering avoids the emotional cost of "missing" an entry and distributes your execution cost—professional traders call this dollar-cost averaging on entries. 🛑 Stop Loss | Discipline Wins Wars Hard Stop: $610.00 Reasoning: Below this level, the daily chart's support at the 200-EMA fails. Loss = ~4-5% from average entry ($645), which is reasonable swing risk. ⚠️ DISCLAIMER: This stop-loss level is MY analysis only. You remain fully responsible for your risk. Consider your account size, leverage, and emotional tolerance before committing capital. Never risk more than 2% per trade. 🎪 Target Strategy | Know When to Take Profits Primary Target (Resistance Police Force): 📍 $720.00 Why $720 Matters: 328-Period SMA (4-hour chart) typically acts as resistance during consolidated ranges Overbought Territory Signal: RSI creeping above 70 = profit-taking zone Technical Trap Warning: Large sellers often cluster here after gaps up Psychological Level: Round numbers ($720) trigger algorithmic selling Escape Plan: When price approaches $720, take 50% off the table to lock profits. Let remaining 50% run with a trailing stop at +3% below entry. ⚠️ DISCLAIMER: This target is NOT guaranteed. META could face: regulatory headwinds, macro rate shock, or competitor moves. You decide your exit—never marry a target. Protect your capital first. 📡 Related Pairs to Monitor (Correlation Watch) 🔗 1️⃣ GOOG (Google / Alphabet Inc.) — POSITIVE CORRELATION (+0.82) Key Insight: Both compete in AI advertising and data-center infrastructure. If GOOG rallies, META usually follows. Watch: GOOG breaks above $200 = risk-on sentiment for META. 2️⃣ TSLA (Tesla, Inc.) — MODERATE POSITIVE CORRELATION (+0.71) Key Insight: Both are "mega-cap AI/Tech bets." TSLA weakness can drag META down (flight to safety). Watch: TSLA support breaks = potential META correction into your layers. 3️⃣ AMZN (Amazon.com) — POSITIVE CORRELATION (+0.76) Key Insight: AWS AI infrastructure play; if AMZN capex concerns flare, META suffers (shared narrative). Watch: AMZN guidance = signal for META's data-center spend outlook. 4️⃣ SPY (S&P 500 ETF) — MODERATE CORRELATION (+0.68) Key Insight: Macro beta. Fed rate decisions move SPY; SPY moves all mega-caps. Watch: CPI data Dec 18, 2025 at 8:30 AM ET = critical catalyst. 5️⃣ VIX (Volatility Index) — NEGATIVE CORRELATION (-0.55) Key Insight: Rising VIX = fear. META can gap down on broad market panic. Watch: VIX above 20 = consider tightening your stop or waiting for another layer signal. 💡 Key Technical Confluences ✅ Why This Setup Works: Layered entries = you're never "too early" or paying too much 52-week range sits between $480–$796 (META has room to $720) 📈 Analyst consensus = "Strong Buy" with targets ~$832 median AI capex narrative = earnings growth driver into Q1 2026 Dividend pay date Dec 23 = pre-holiday consolidation likely ❌ Risks to Abort: Breaking below $610 = trade is invalid; exit immediately Regulatory shock (FTC enforcement) = gap down risk Macro CPI shock Dec 18 = volatility surge, potential liquidation Competitive loss to GOOG/AMZN AI = narrative reversal 📈 Risk Management Checklist Before you trade this setup: Do you understand layering reduces timing risk? ✅ Is your stop at $610 within your risk tolerance? ✅ Have you calculated max loss? (e.g., 7.5% × 2% per layer = ~$150 per $1000 risked) ✅ Is $720 target realistic in 4-6 weeks? (YES—analyst upside + technical confluence) ✅ Will you stick to your exit plan, or will greed override? ⚠️ (This is the real test!) 🎬 Action Plan | Execution Timeline Week 1 (Dec 18–22): Place Layer 1 & 2 buy orders. Watch CPI data (Dec 18, 8:30 AM ET). Week 2–3: Scale into Layers 3 & 4 on any dips. Monitor GOOG/AMZN correlation. Week 4–6: Approach $720; take 50% profit at resistance. Manage trailing stop on remainder. Exit Plan: TP hit = reduce risk. SL hit = accept loss, move on. No "hope trading." 📝 Disclaimer & Fun Caveat 🎭 This is a "playful but serious" swing-trade idea. It's designed for entertainment AND education—think of it as how a mischievous but disciplined trader (our "thief trader OG") approaches META with style, humor, and risk management. ✨ Closing Thought If you find value in this analysis, a 👍 and 🚀 boost is much appreciated — it helps me share more setups with the community! #META #SwingTrade #TechStocks #AITheme #LayeredEntry #TradingView #StockMarket #NASDAQ #Bullish #MoneyManagement #RiskManagement #ProfitTaking #TechnicalAnalysis #StockAnalysis #TradeSetup #LongBias #2025Trading
Disclaimer
Any content and materials included in Sahmeto's website and official communication channels are a compilation of personal opinions and analyses and are not binding. They do not constitute any recommendation for buying, selling, entering or exiting the stock market and cryptocurrency market. Also, all news and analyses included in the website and channels are merely republished information from official and unofficial domestic and foreign sources, and it is obvious that users of the said content are responsible for following up and ensuring the authenticity and accuracy of the materials. Therefore, while disclaiming responsibility, it is declared that the responsibility for any decision-making, action, and potential profit and loss in the capital market and cryptocurrency market lies with the trader.