
LUNC
Terra Classic
| تریدر | نوع سیگنال | حد سود/ضرر | زمان انتشار | مشاهده پیام |
|---|---|---|---|---|
No results found. | ||||
Price Chart of Terra Classic
سود 3 Months :
سیگنالهای Terra Classic
Filter
Sort messages by
Trader Type
Time Frame

الگوی پرچم گاو: حرکت بزرگ قیمت تا سهشنبه شب؟
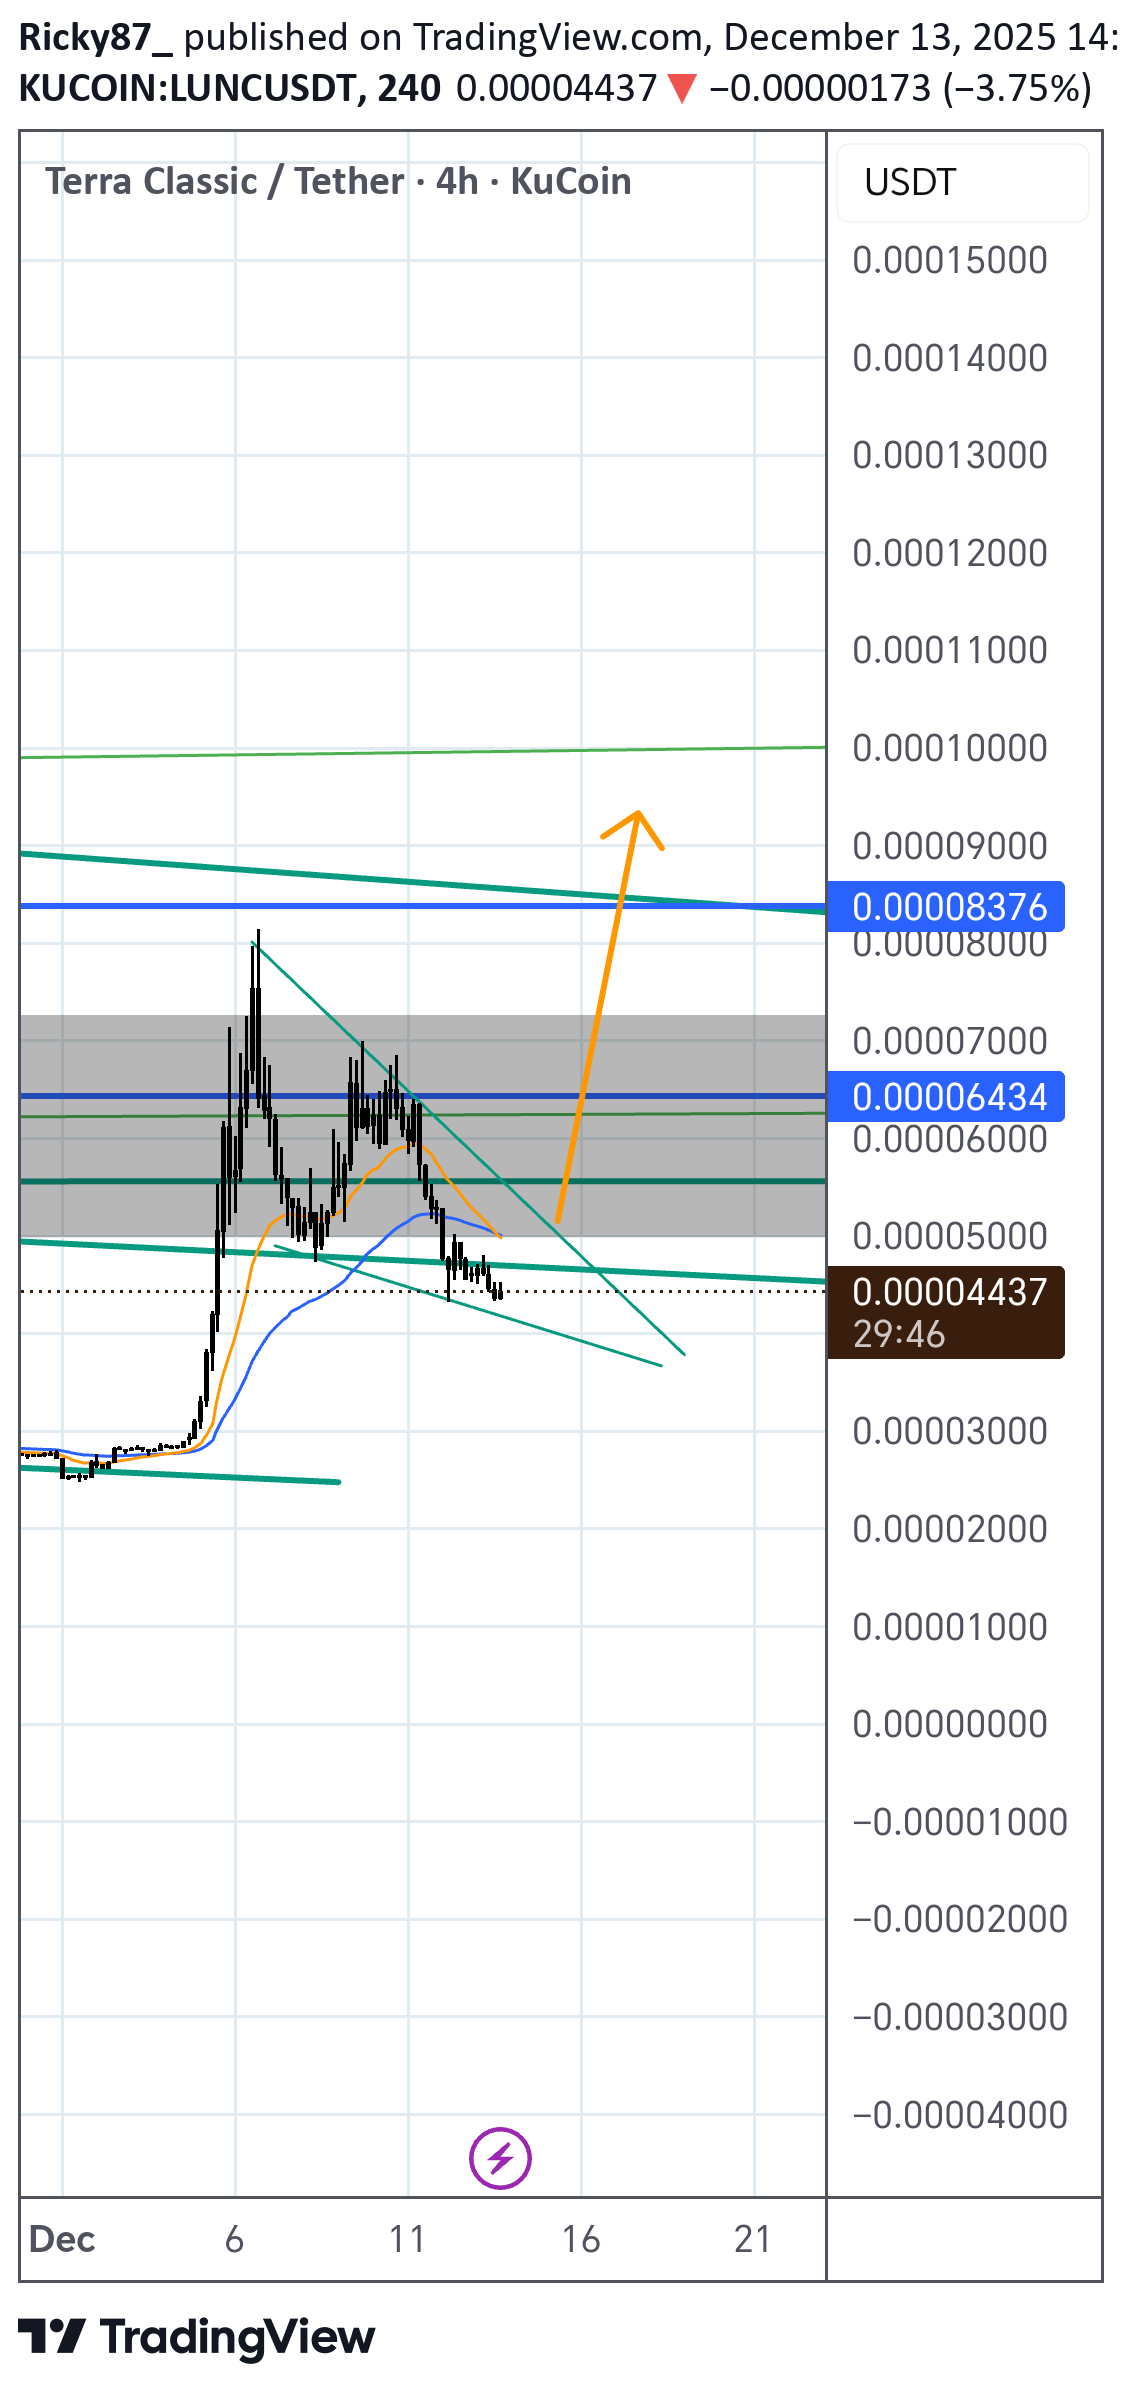
I'm not sure on the bull flag term, could be called something else but there should be movement by Wednesday at the latest

asilturk
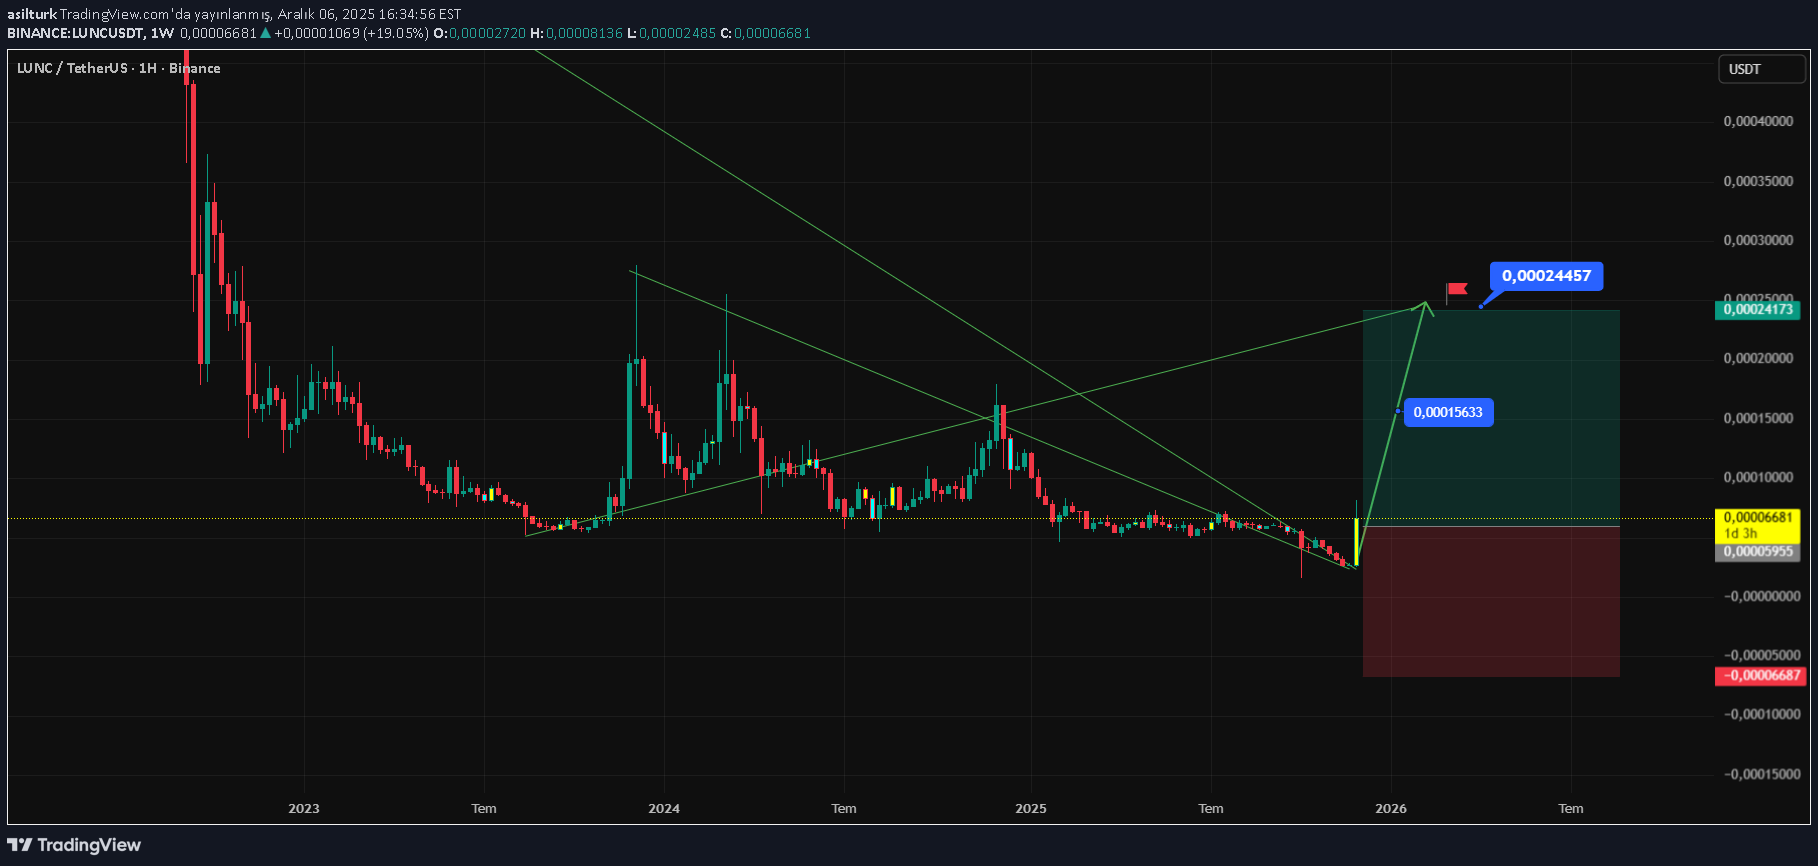
LUNC Kesinlikle Çok Dikkat Edilmeli
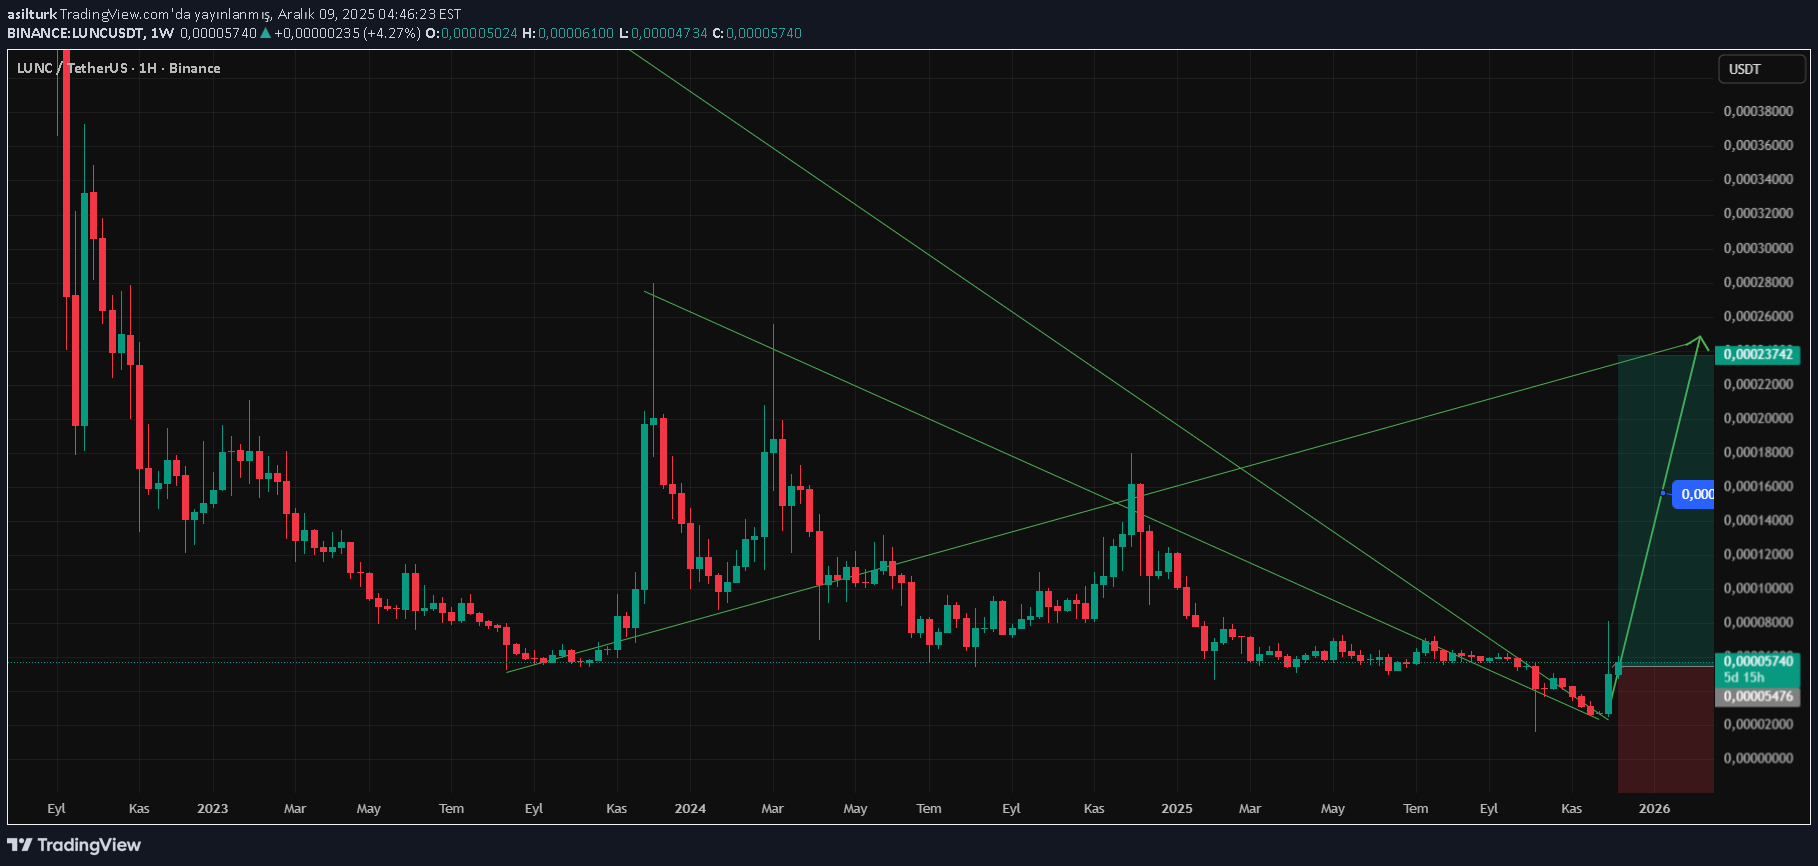
I predict that $500 million transaction volume has been realized for LUNC (Old LUNA) and that the volume and price movements will be harsh and sharp. When we examine it technically, we see that extremely high and low price movements may occur along with the platform concentration value due to high volume, RSI points to the monthly buying zone above 50, a strong mom appears on the weekly, I believe that the weekly trend direction is still upwards.
asilturk
احیای افسانه LUNC: آیا این توکن سقوط کرده باز خواهد گشت؟
LUNC is the original Terra token that the community is trying to keep alive after the big crash in 2022. Its main focus is to increase its value by implementing burn mechanisms that will reduce the huge supply of tokens. It is an extremely speculative asset. LUNC What makes it special is the split of LUNA, the main actor of the FTX crisis, in other words, the original Luna of the community... It is better to be careful and cautious... I wish you lots of profit.

Cryptojobs
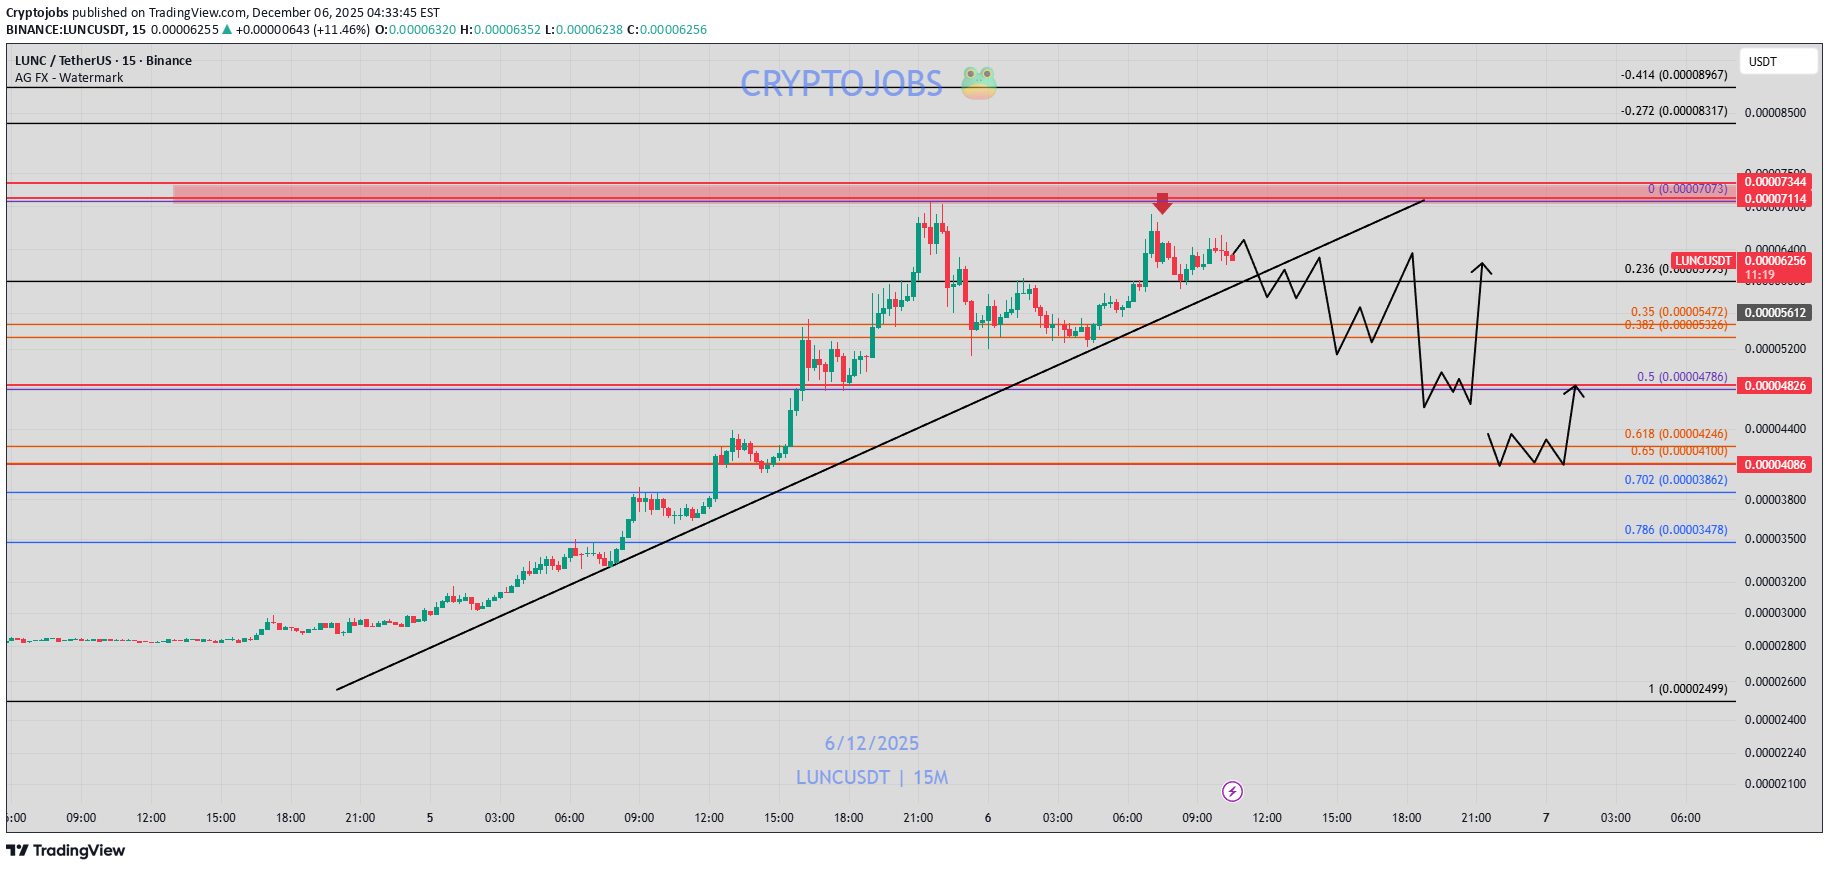
آیا لونا کلاسیک (LUNC) در آستانه رهایی بزرگ است؟ ریسکها و اهداف صعودی جدید!
I was wrong about short term views on $LUNC. For now breakout does not looks fake. Hype & bull momentum looks really strong at the moment above the M15 uptrend 📈 Bulls could push toward 0.001100 $+ on the weekly basis, but it can still be a price manipulation. I think that's better to not FOMO, because a trend break could lead to a 30%+ correction (quick) 🔴 Anyone know what's cooking? 👀 Not financial advice, volatility is huge.

melikatrader94
ساختار سه موجی لونا کلاسیک: آیا پامپ بزرگ بعدی در راه است؟
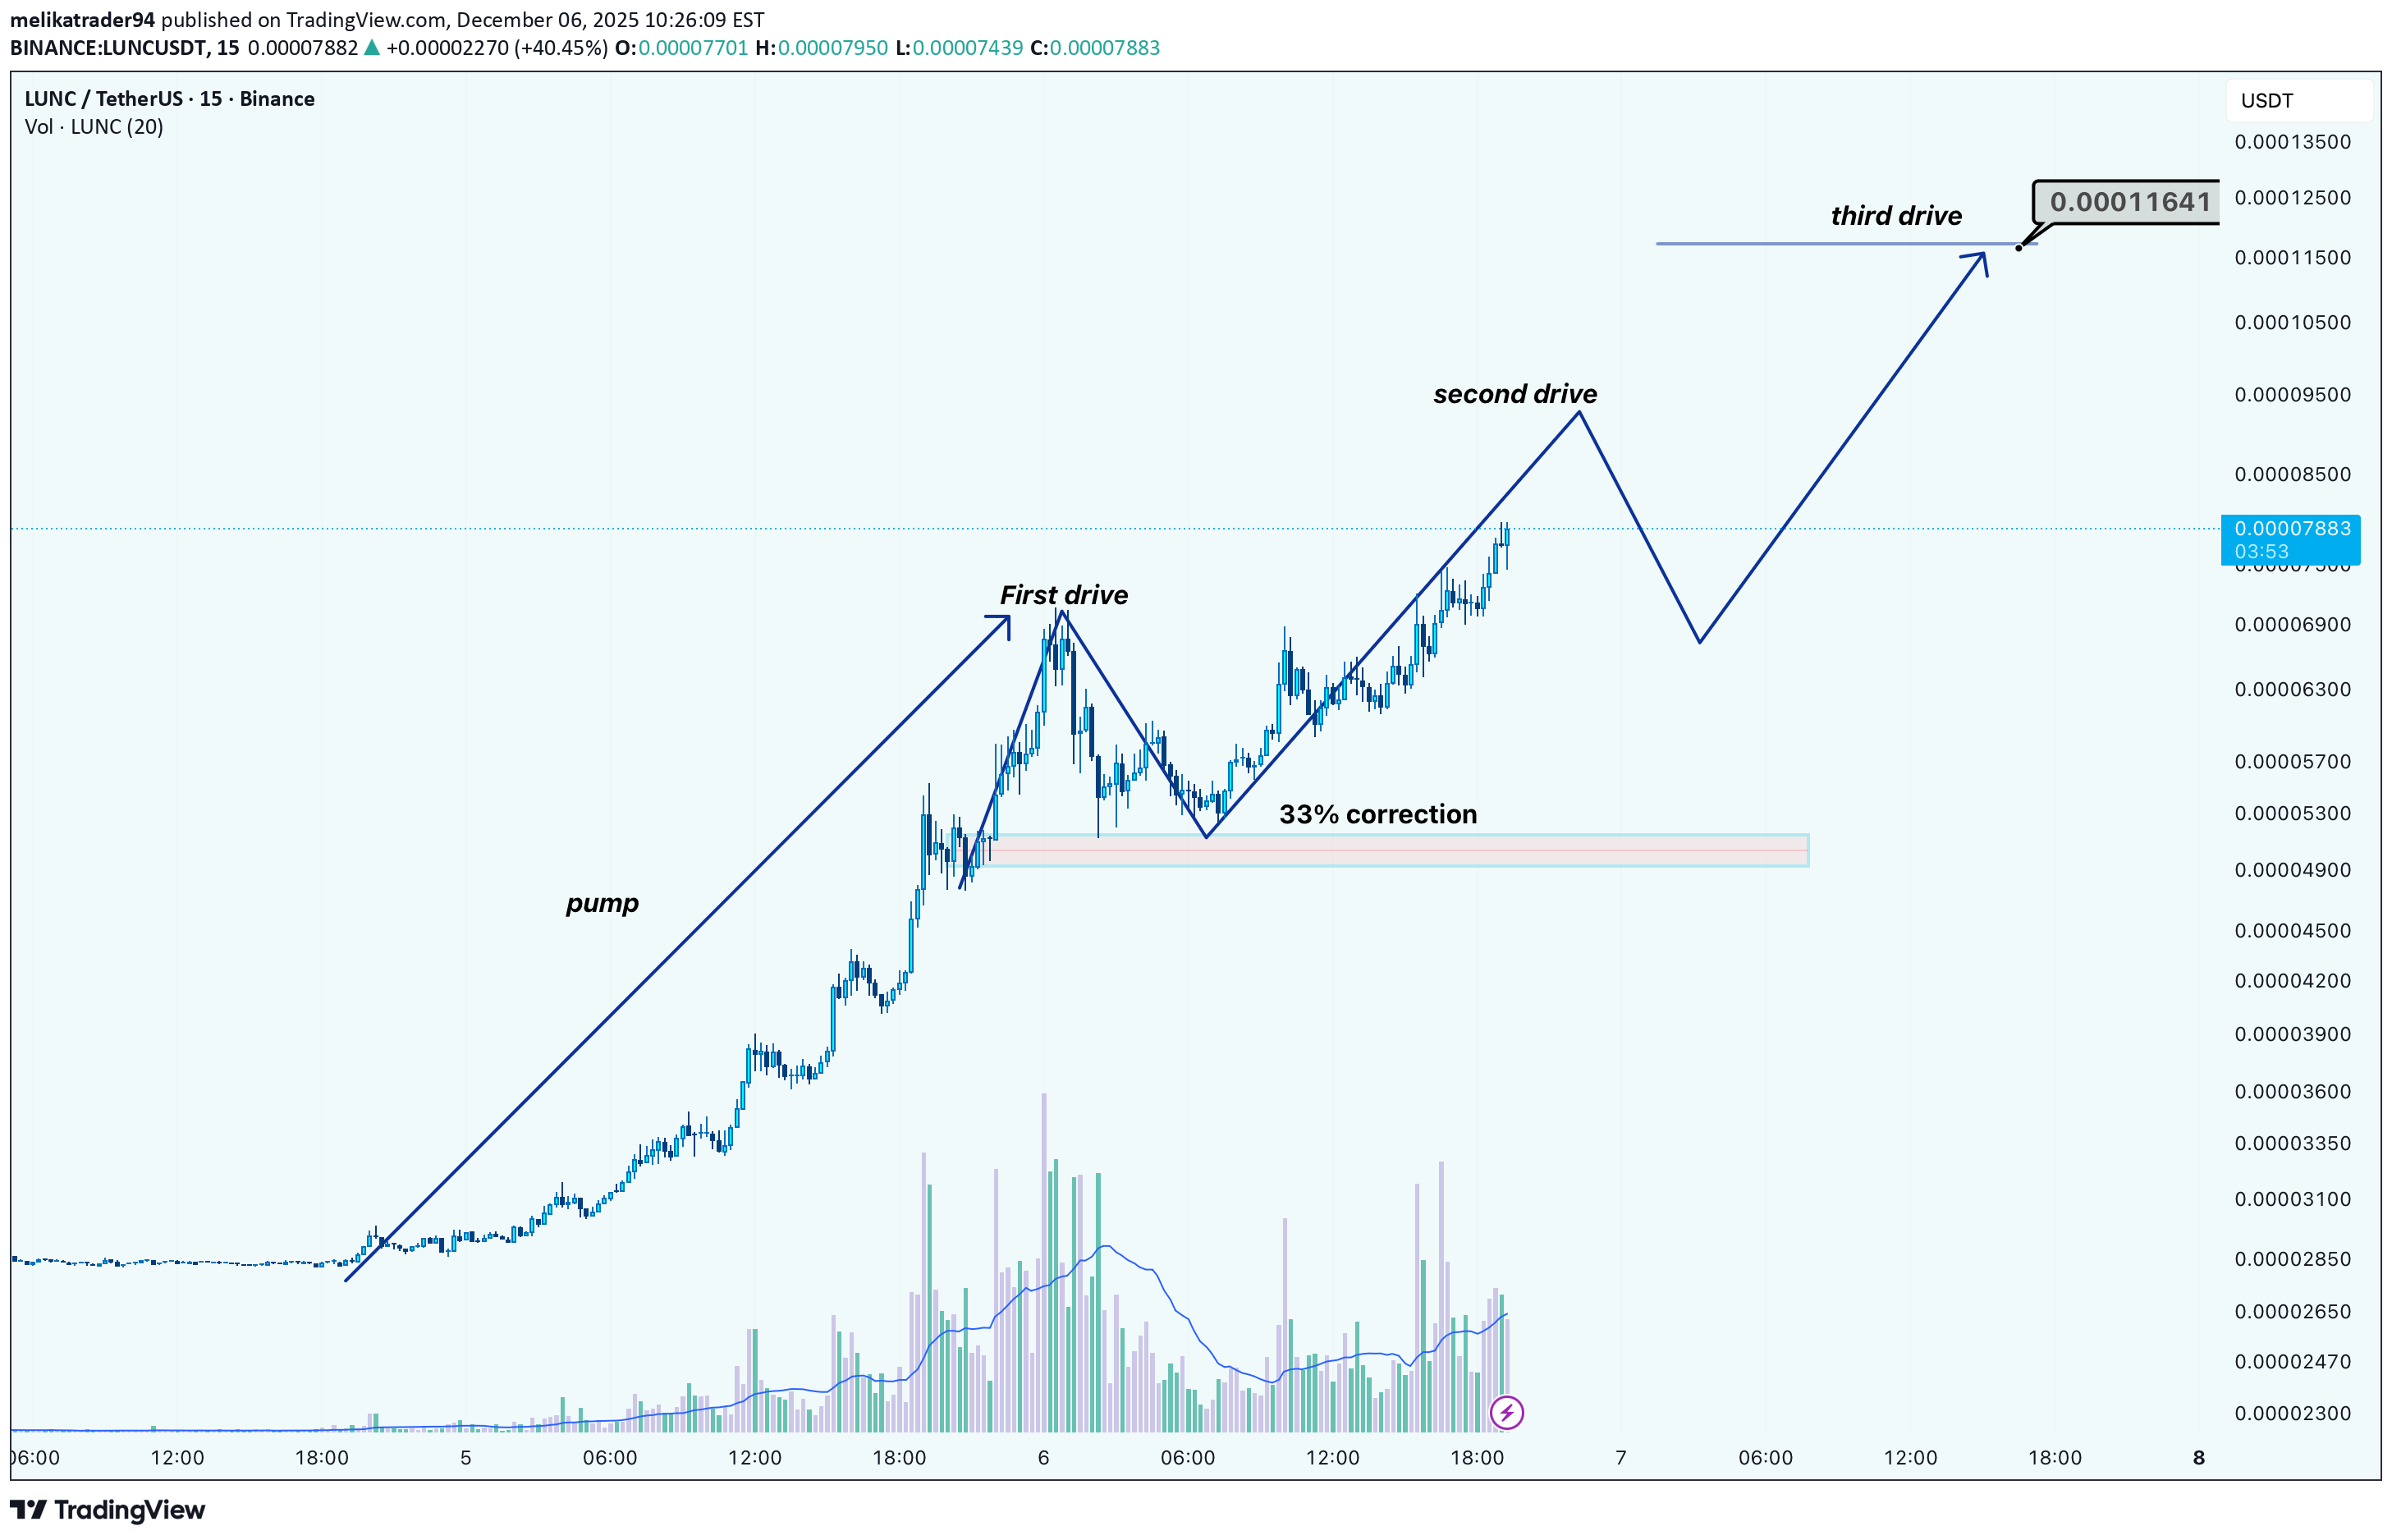
Hi! The chart illustrates a strong pump followed by what looks like a developing three-drive pattern. After the first drive, price pulled back roughly 33%, forming a solid base before climbing into the second drive. Momentum is still bullish, but a deeper retracement may occur before the projected third drive toward the 0.000116 area. As long as corrections stay controlled and volume supports the trend, the overall structure suggests continued upside potential.
Cryptojobs
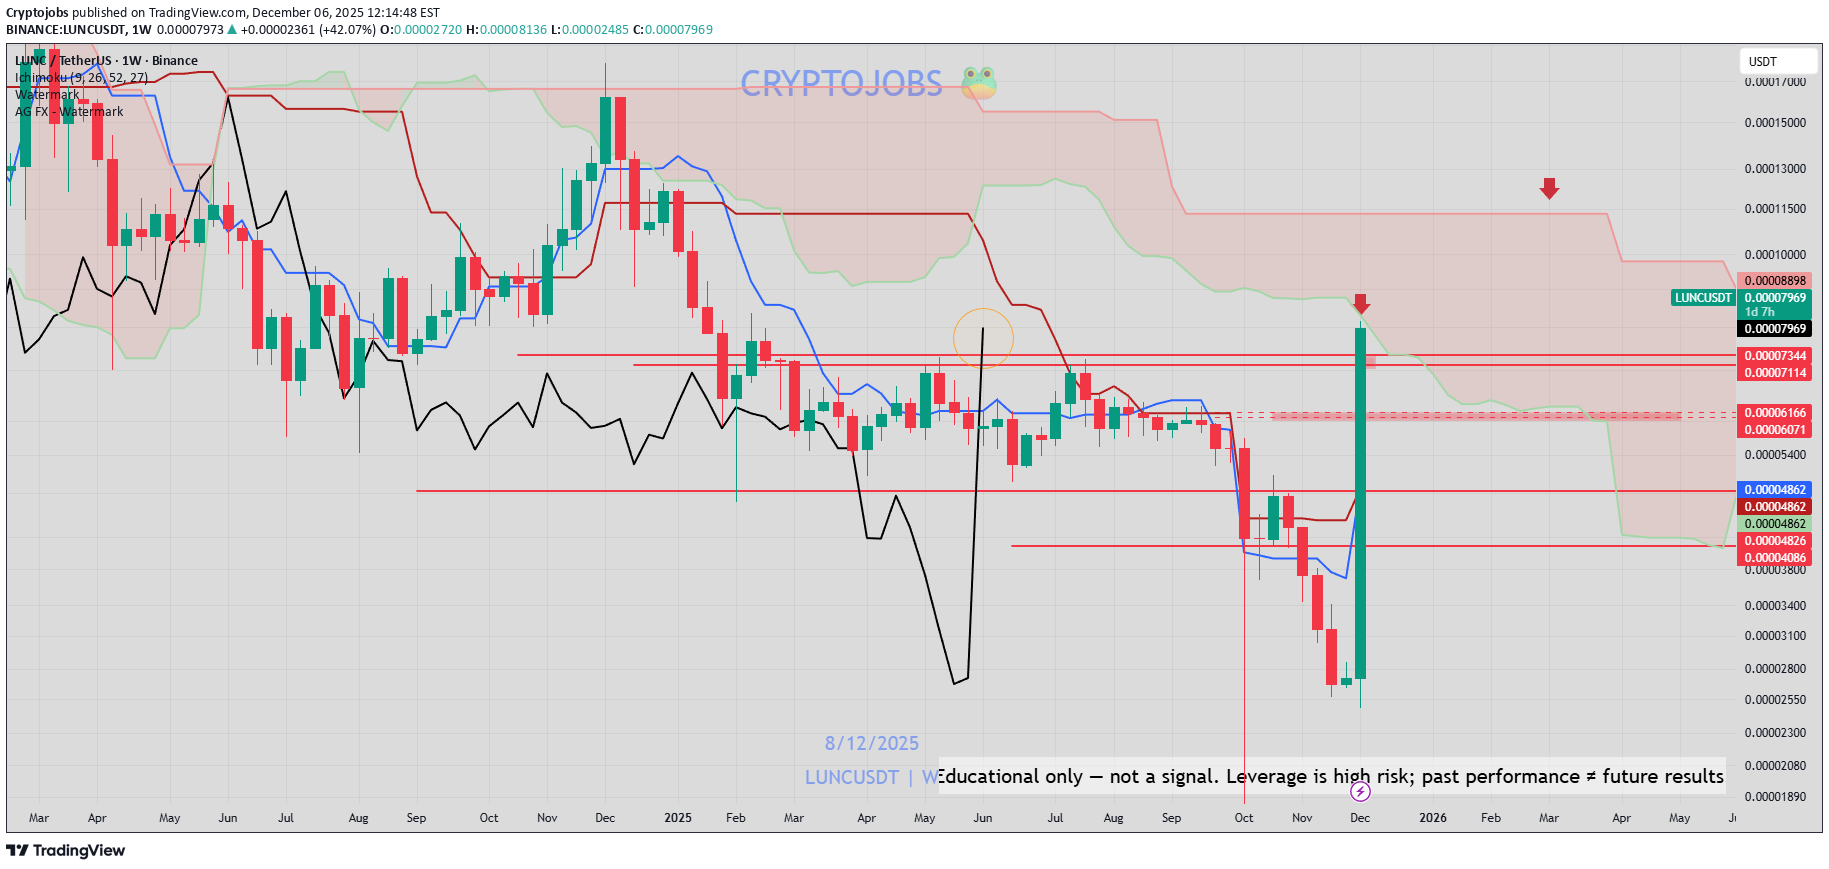
آیا لونا کلاسیک (LUNC) به سقف دوقلو میرسد؟ هشدار ریزش سنگین پس از صعود انفجاری!
LUNC is on fire with a +140% recovery on a weekly basis 📈 But stay cautious here, as the weekly top could be around $ 0.0007300 🔴 According to my analysis, this could be price manipulation, and a key resistance level has already been hit! Double top forming? ⚠️ --> 0.0004800 - 0.0004000 🎯📉 The main uptrend is holding for now, but it looks like a significant sell-off could occur if we break it. Therefore, below this higher high (HH), I expect to see a -20% to -30% pullback 📉

Osang
پامپ تاریخی لونا کلاسیک (LUNC): آیا برگشت قیمت به 1 دلار یا 10 دلار ممکن است؟
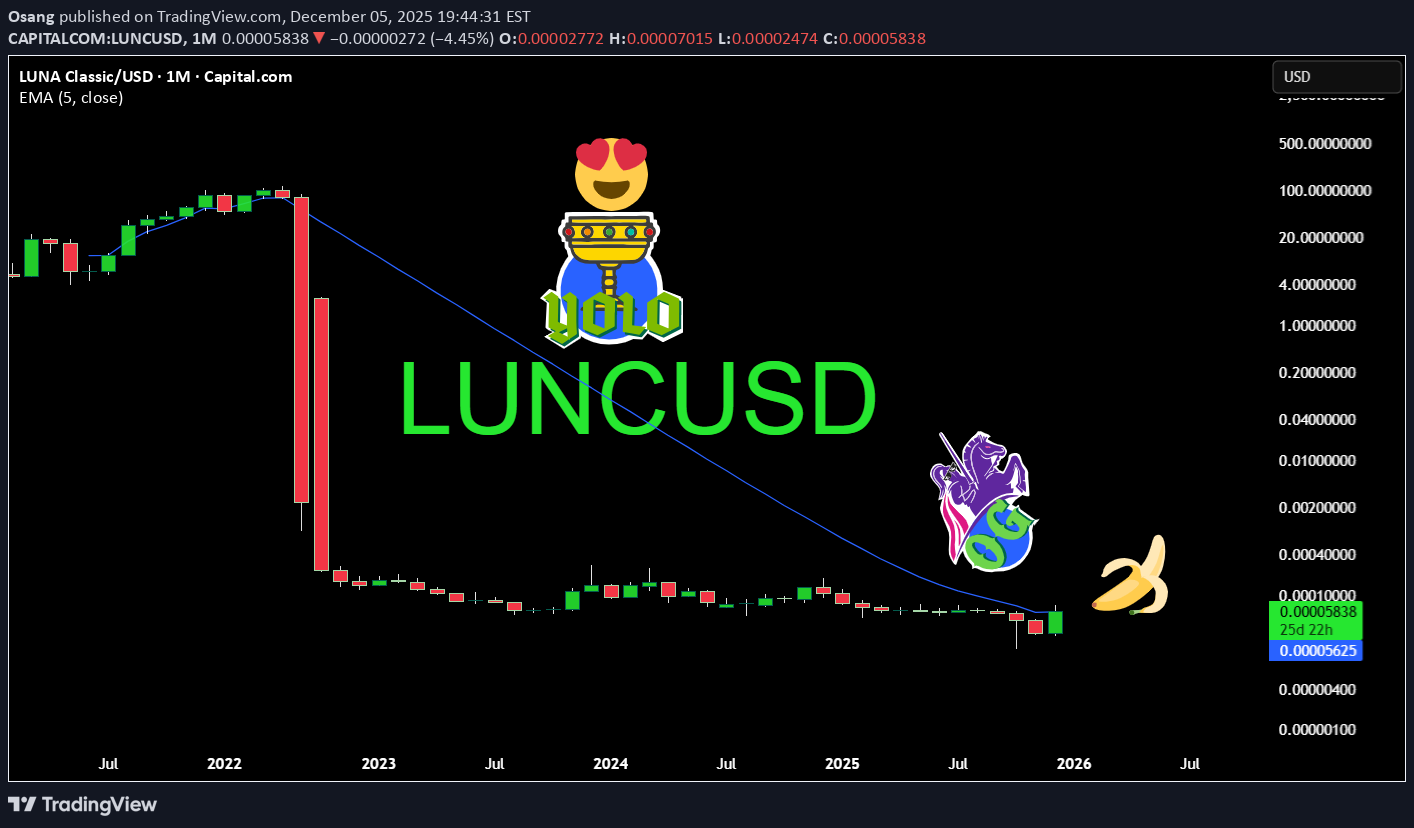
this is one of the biggest token this year end that volume and other versions are getting the best of it interest is coming back and strong hands and those who got a lot of this at below 0.00005 should be lucky good luck guys and this holiday pump is surely going to be as rewarding as before hopefully all time high holders at $50 and $100++ will be whole again at least break only if they averaged down. NFA not financial advice just wondring where my $100 go when this hits back to $10 or even just $1.0 goodness pump
Osang
لونا کلاسیک (LUNC): شور و هیجان بازگشت حجم 300 میلیون دلاری و شانس انفجار قیمت!
this is one of the biggest token this year end that volume and other versions are getting the best of it interest is coming back and strong hands and those who got a lot of this at below 0.00005 should be lucky good luck guys and this holiday pump is surely going to be as rewarding as before NFA not financial advice just wondring where my $100 go when this hits back to $10 or even just $1.0 goodness pump

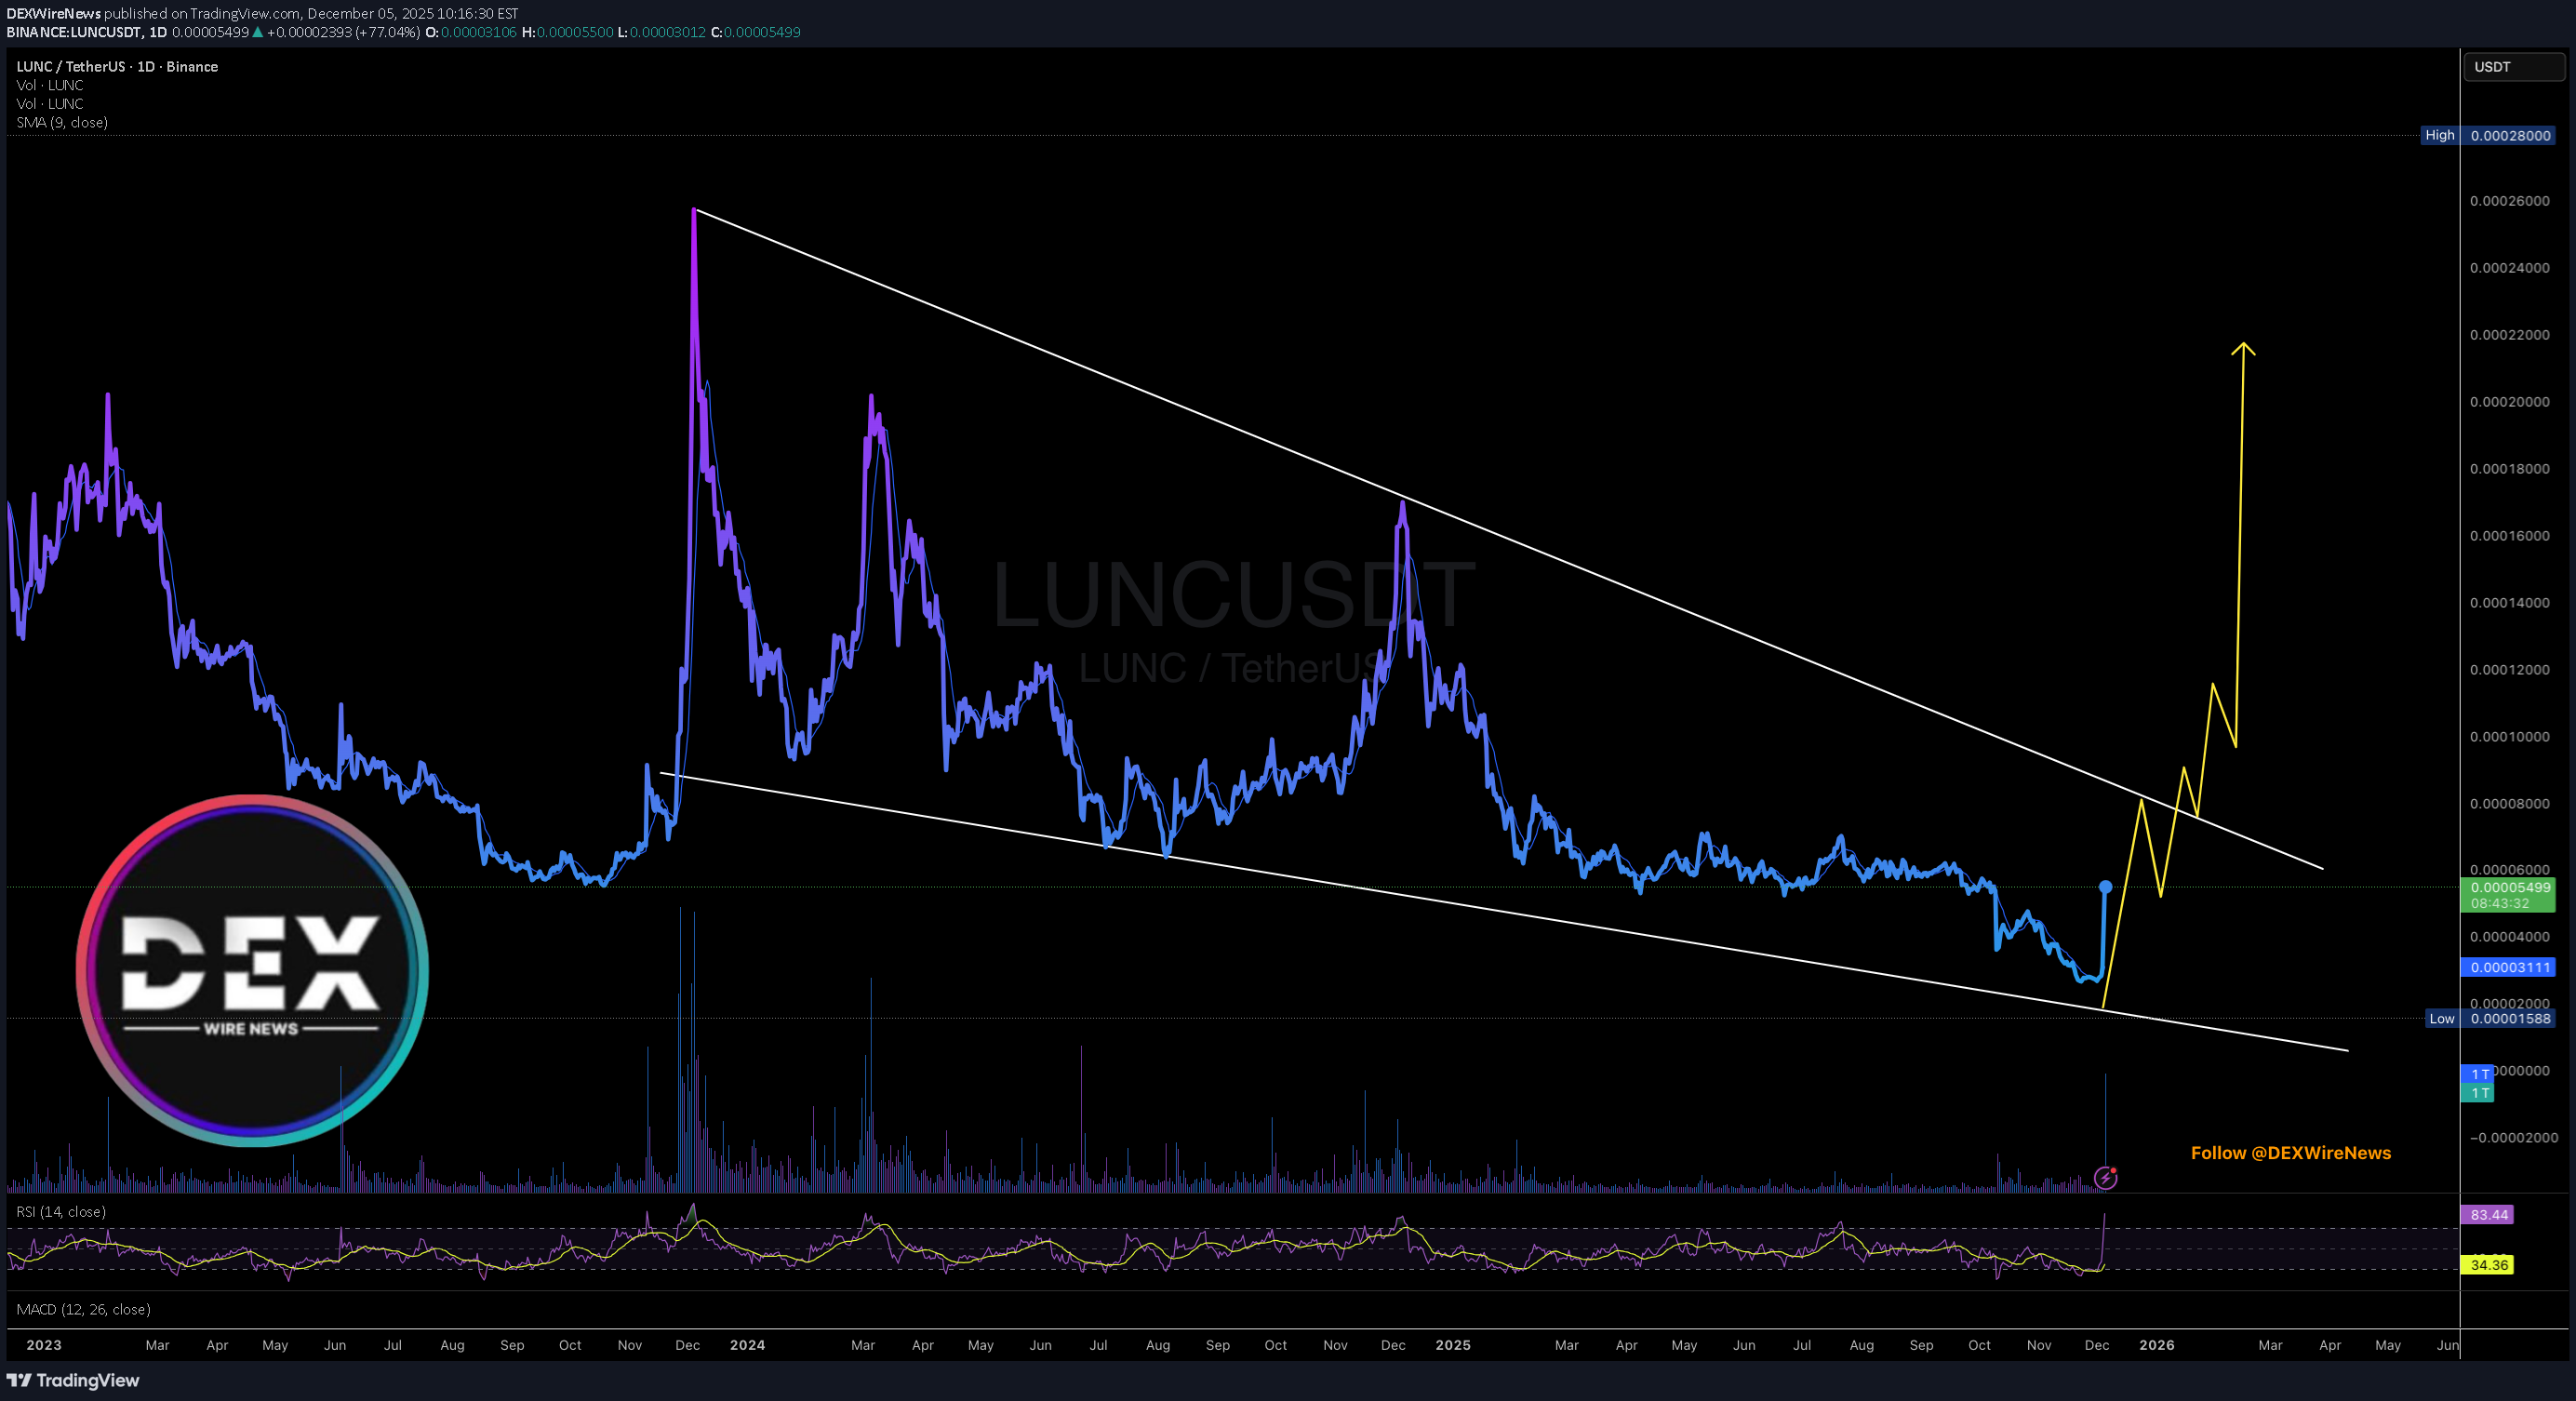
DEXWireNews
جهش ۷۴ درصدی لونا کلاسیک (LUNC) و خبر تسویه حساب ۱.۳ میلیارد دلاری ترافرم لبز!
Terra Classic ( LUNC ) today a notable 65% albeit market sentiment was essentially bearish. the memecoin spike in early Friday morning placing the asset in an overbought region implying the possibility of a drawback. The asset is set to spike 150% today should it break the ceiling of the falling wedge formed on the chart. In another news, Terraform Labs secures $1.3B settlement court approval. Settlement impacts Terra Classic, LUNA, and USTC. The $1.3 billion settlement by Terraform Labs is notable as it reflects significant regulatory and market shifts. It affects key crypto assets like Terra Classic and LUNA, while outlining a structured path for creditor reimbursements. The Terraform Labs settlement finalized marks a pivotal moment in the crypto regulatory landscape. Courts approved the $1.3B figure for distribution. Overseen by the U.S. Bankruptcy Court, the settlement's impact resonates across the crypto sector. What Is Terra Classic ( LUNC )? Terra is a blockchain protocol that uses fiat-pegged stablecoins to power price-stable global payments systems. According to its white paper, Terra combines the price stability and wide adoption of fiat currencies with the censorship-resistance of Bitcoin (BTC) and offers fast and affordable settlements Terra Classic Price Data The Terra Classic price today is $0.000047 USD with a 24-hour trading volume of $150,349,720 USD. Terra Classic is up 65.62% in the last 24 hours. The current CoinMarketCap ranking is #146, with a market cap of $256,910,315 USD. It has a circulating supply of 5,486,583,841,259 LUNC coins and the max.

Alpha-GoldFX
الوانسی آماده انفجار ۹۰ درصدی؟ الگوی گوه نزولی نویدبخش جهش بزرگ!
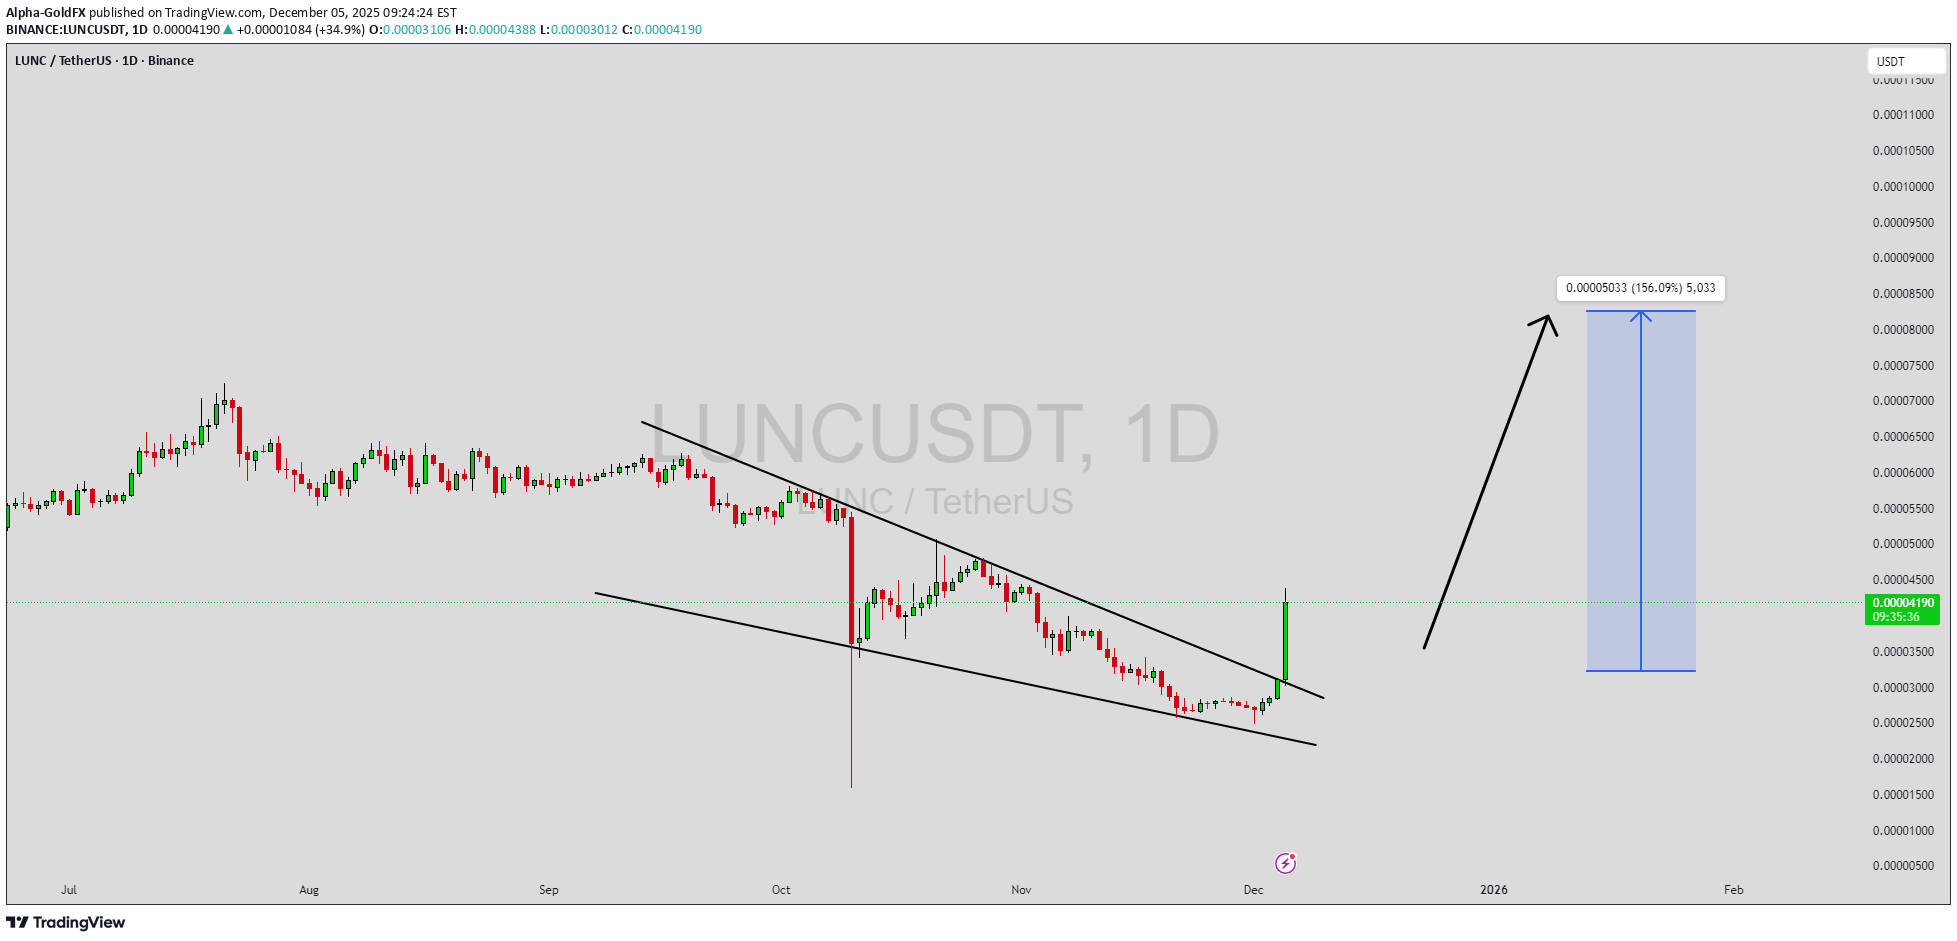
LUNCUSDT is forming a clear falling wedge pattern, a classic bullish reversal signal that often indicates an upcoming breakout. The price has been consolidating within a narrowing range, suggesting that selling pressure is weakening while buyers are beginning to regain control. With consistent volume confirming accumulation at lower levels, the setup hints at a potential bullish breakout soon. The projected move could lead to an impressive gain of around 90% to 100% once the price breaks above the wedge resistance. This falling wedge pattern is typically seen at the end of downtrends or corrective phases, and it represents a potential shift in market sentiment from bearish to bullish. Traders closely watching LUNCUSDT are noting the strengthening momentum as it nears a breakout zone. The good trading volume adds confidence to this pattern, showing that market participants are positioning early in anticipation of a reversal. Investors’ growing interest in LUNCUSDT reflects rising confidence in the project’s long-term fundamentals and current technical strength. If the breakout confirms with sustained volume, this could mark the start of a fresh bullish leg. Traders might find this a valuable setup for medium-term gains, especially as the wedge pattern completes and buying momentum accelerates. ✅ Show your support by hitting the like button and ✅ Leaving a comment below! (What is your opinion about this Coin?) Your feedback and engagement keep me inspired to share more insightful market analysis with you!
Disclaimer
Any content and materials included in Sahmeto's website and official communication channels are a compilation of personal opinions and analyses and are not binding. They do not constitute any recommendation for buying, selling, entering or exiting the stock market and cryptocurrency market. Also, all news and analyses included in the website and channels are merely republished information from official and unofficial domestic and foreign sources, and it is obvious that users of the said content are responsible for following up and ensuring the authenticity and accuracy of the materials. Therefore, while disclaiming responsibility, it is declared that the responsibility for any decision-making, action, and potential profit and loss in the capital market and cryptocurrency market lies with the trader.