
LTC
Litecoin
| تریدر | نوع سیگنال | حد سود/ضرر | زمان انتشار | مشاهده پیام |
|---|---|---|---|---|
 CryptoSanders9563Rank: 3051 | خرید | حد سود: تعیین نشده حد ضرر: تعیین نشده | 12/13/2025 | |
 tomas_jntxRank: 3933 | فروش | حد سود: تعیین نشده حد ضرر: تعیین نشده | 12/17/2025 | |
 thakurudays9970Rank: 4303 | خرید | حد سود: تعیین نشده حد ضرر: تعیین نشده | 12/16/2025 | |
 etherking69420Rank: 15888 | خرید | حد سود: تعیین نشده حد ضرر: تعیین نشده | 12/9/2025 | |
 MadWhaleRank: 30314 | خرید | حد سود: تعیین نشده حد ضرر: تعیین نشده | 12/7/2025 |
Price Chart of Litecoin
سود 3 Months :
خلاصه سیگنالهای Litecoin
سیگنالهای Litecoin
Filter
Sort messages by
Trader Type
Time Frame

VIPCryptoVault
LTCUSD | Reality Check — Liquidity Hasn’t Been Taken
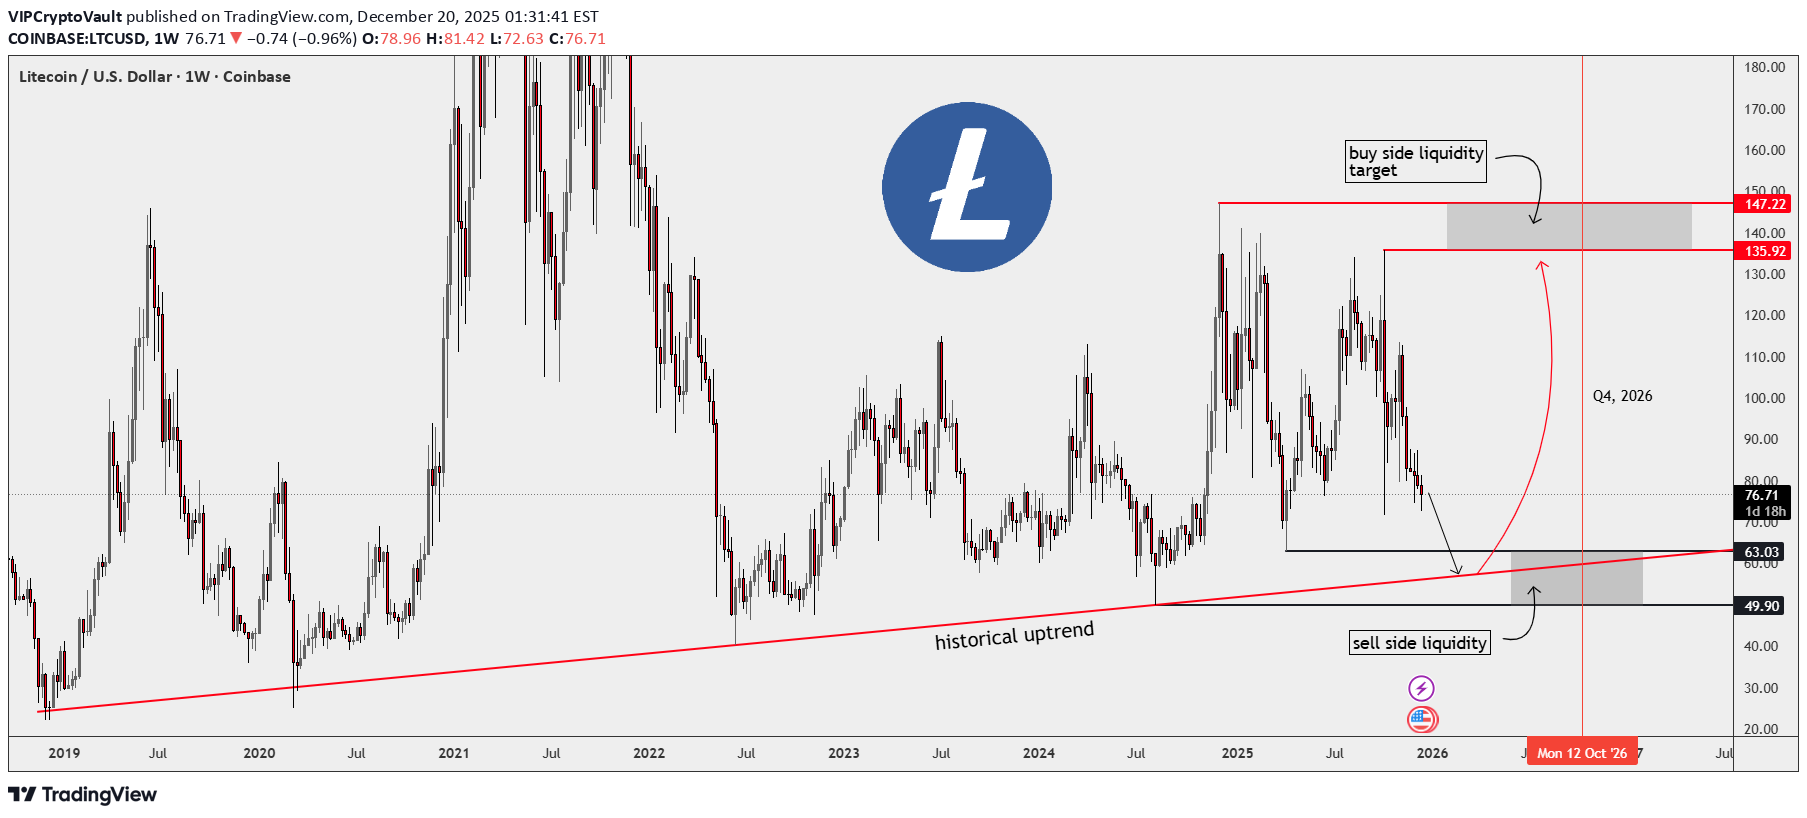
Hello traders, I’m not bullish on LTC yet. You shouldn't be either. 1W TF for LTC is still as bearish as it gets. Massive stop loss orders for buyers are setting below $63. The structure is clear: before any real bullish expansion, sell-side liquidity must be swept. This historical uptrend is where long-term positioning gets reset. Every strong run LTC ever had came after price touched that line, shook out weak hands, and re-accumulated. Remember this period (Q4, 2026) 📍 Levels I’m watching Buy zone (sell-side sweep): $63 – $50 This is where I’ll be interested, not before. Sell targets (buy-side liquidity): $136 - $147 From now on during 2026 bearish market, any price up will be a reset chance. Good Luck! If you find this useful, hit a like, drop a comment and follow for more
LTC/USDT — Market Structure
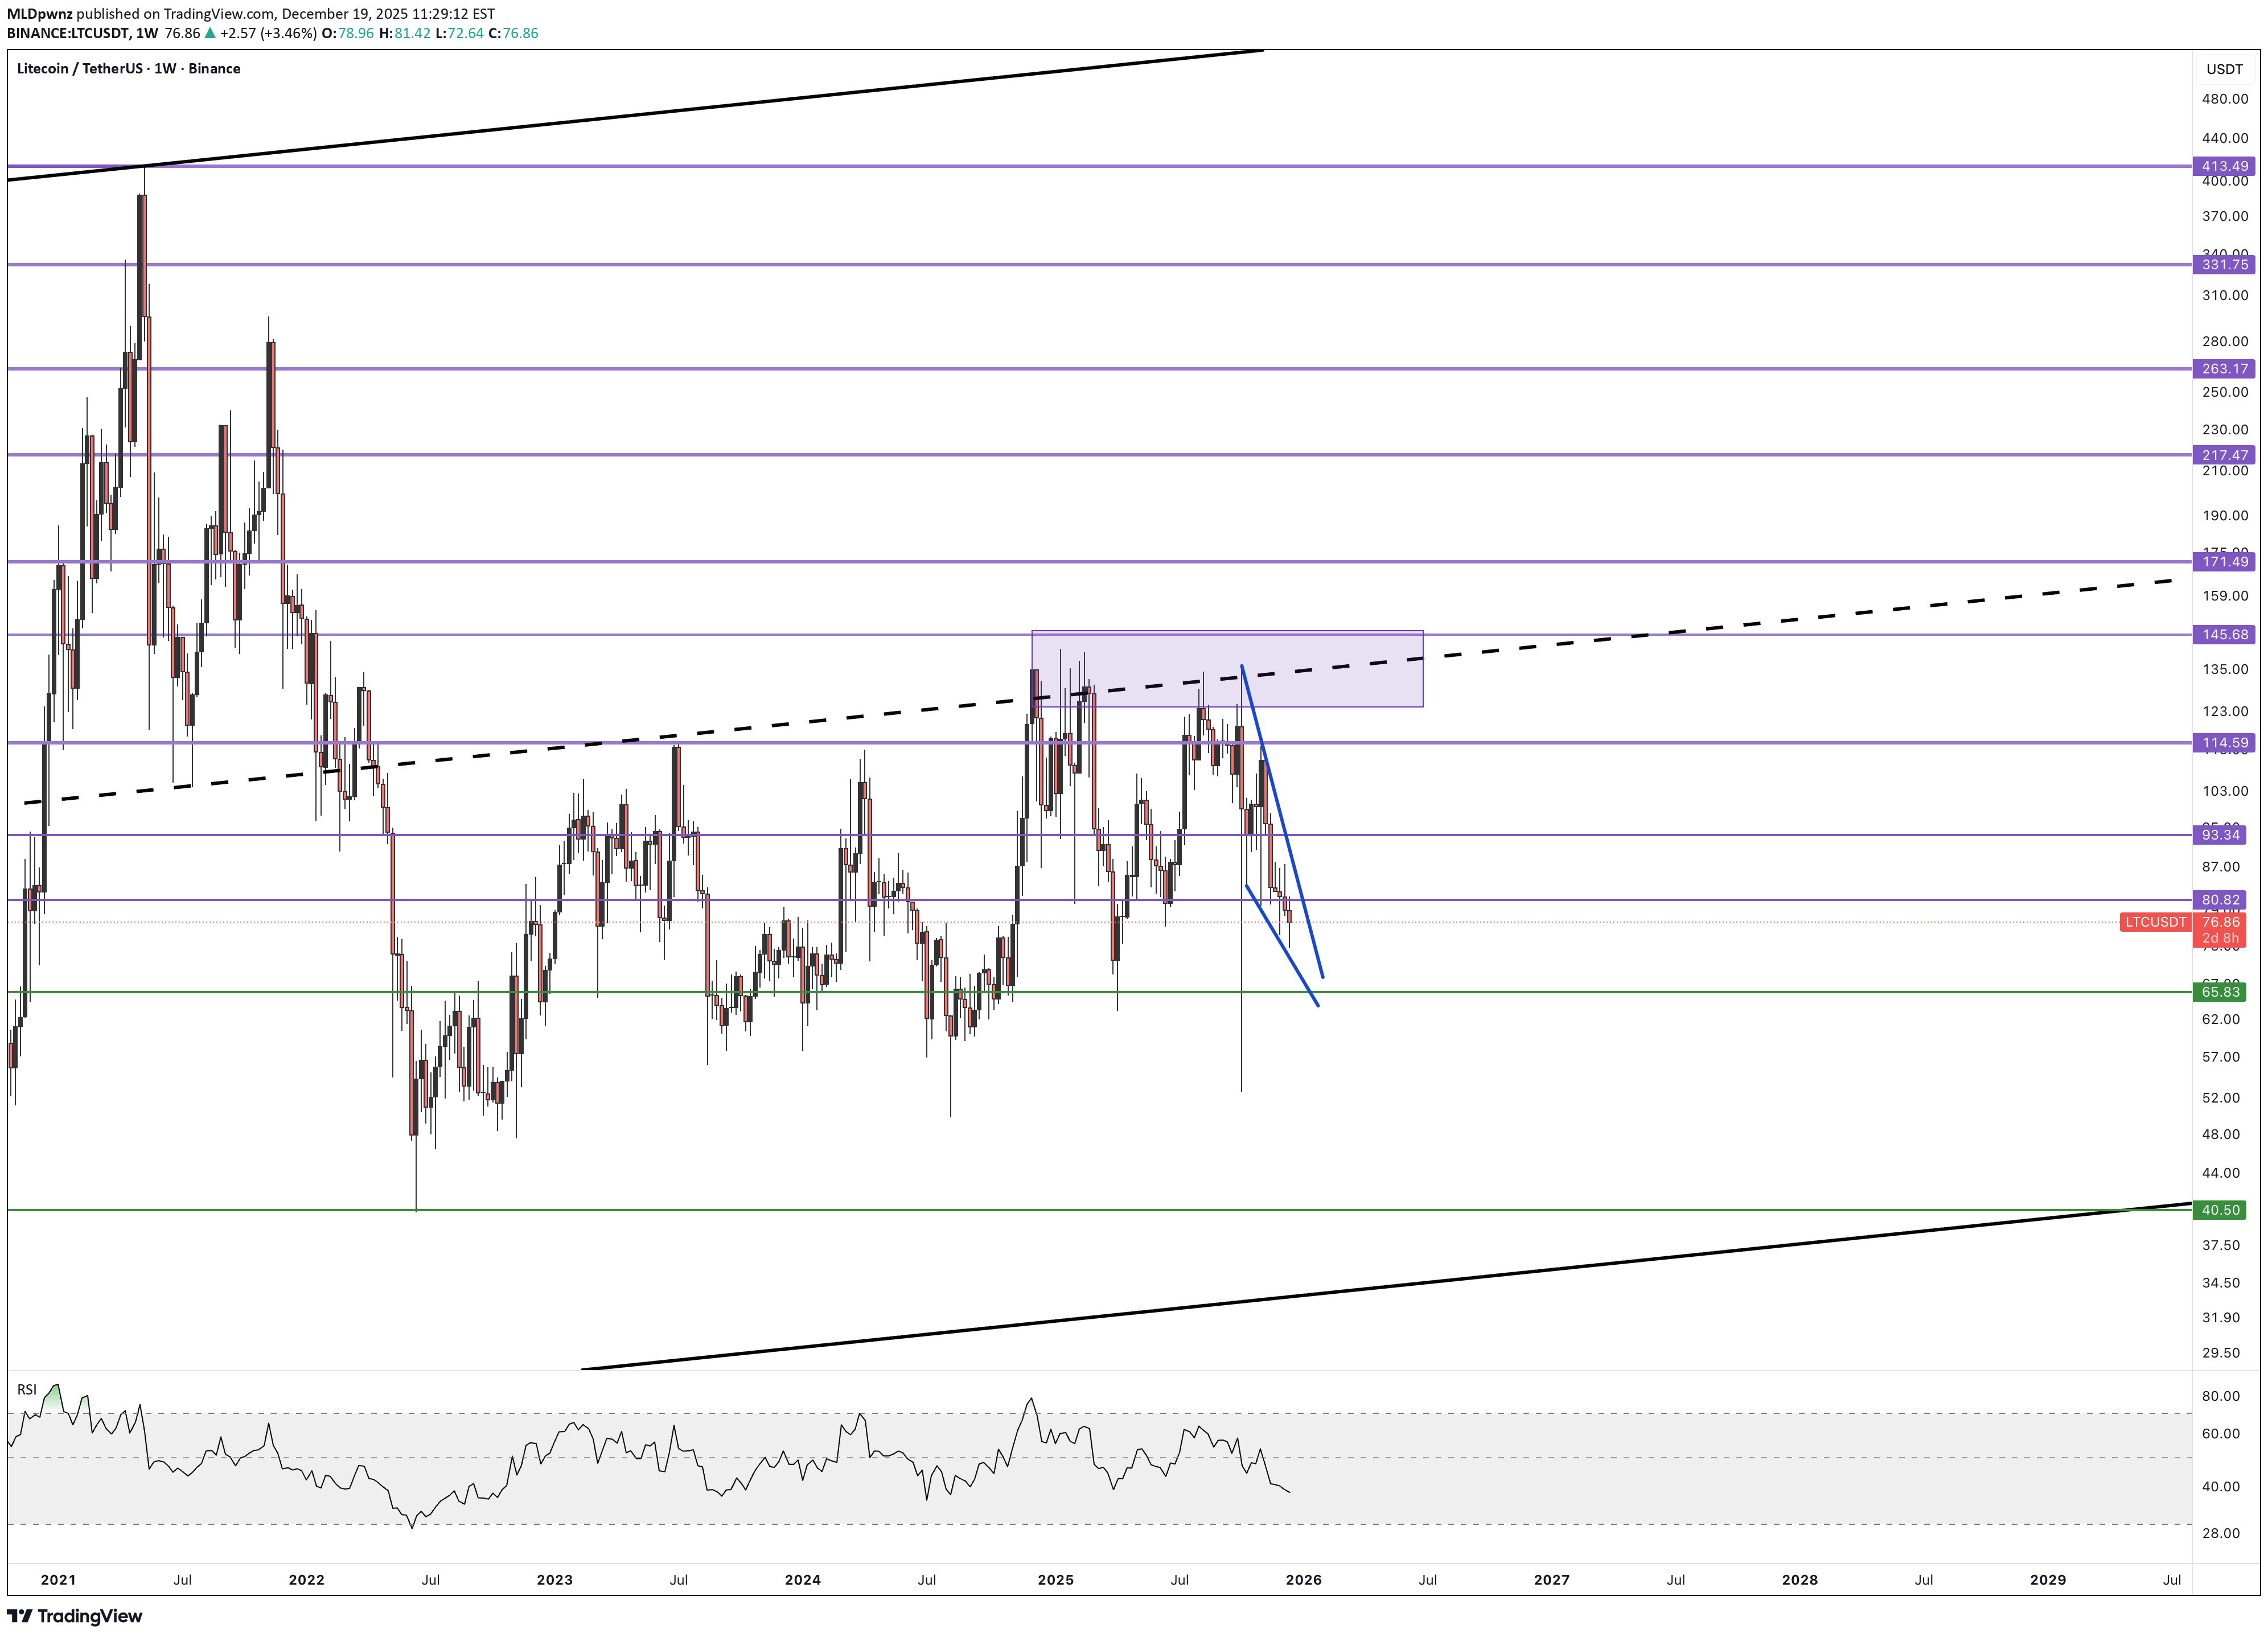
The resistance block and the channel midline proved too strong — after another test, price moved into a correction. The $70–95 range is the most heavily traded zone, where position building is taking place. A bullish wedge is currently forming within this range. Trade options: — accumulate inside the pattern with a mandatory stop-loss below it; — or wait for a confirmed breakout above the wedge’s upper boundary and enter on confirmation. 🎯 Primary targets: $93 and $110. Long-term targets should be considered only after a sustained break and hold above $150.
SIGNAL TRADING: LITECOIN (LTC/USDT)
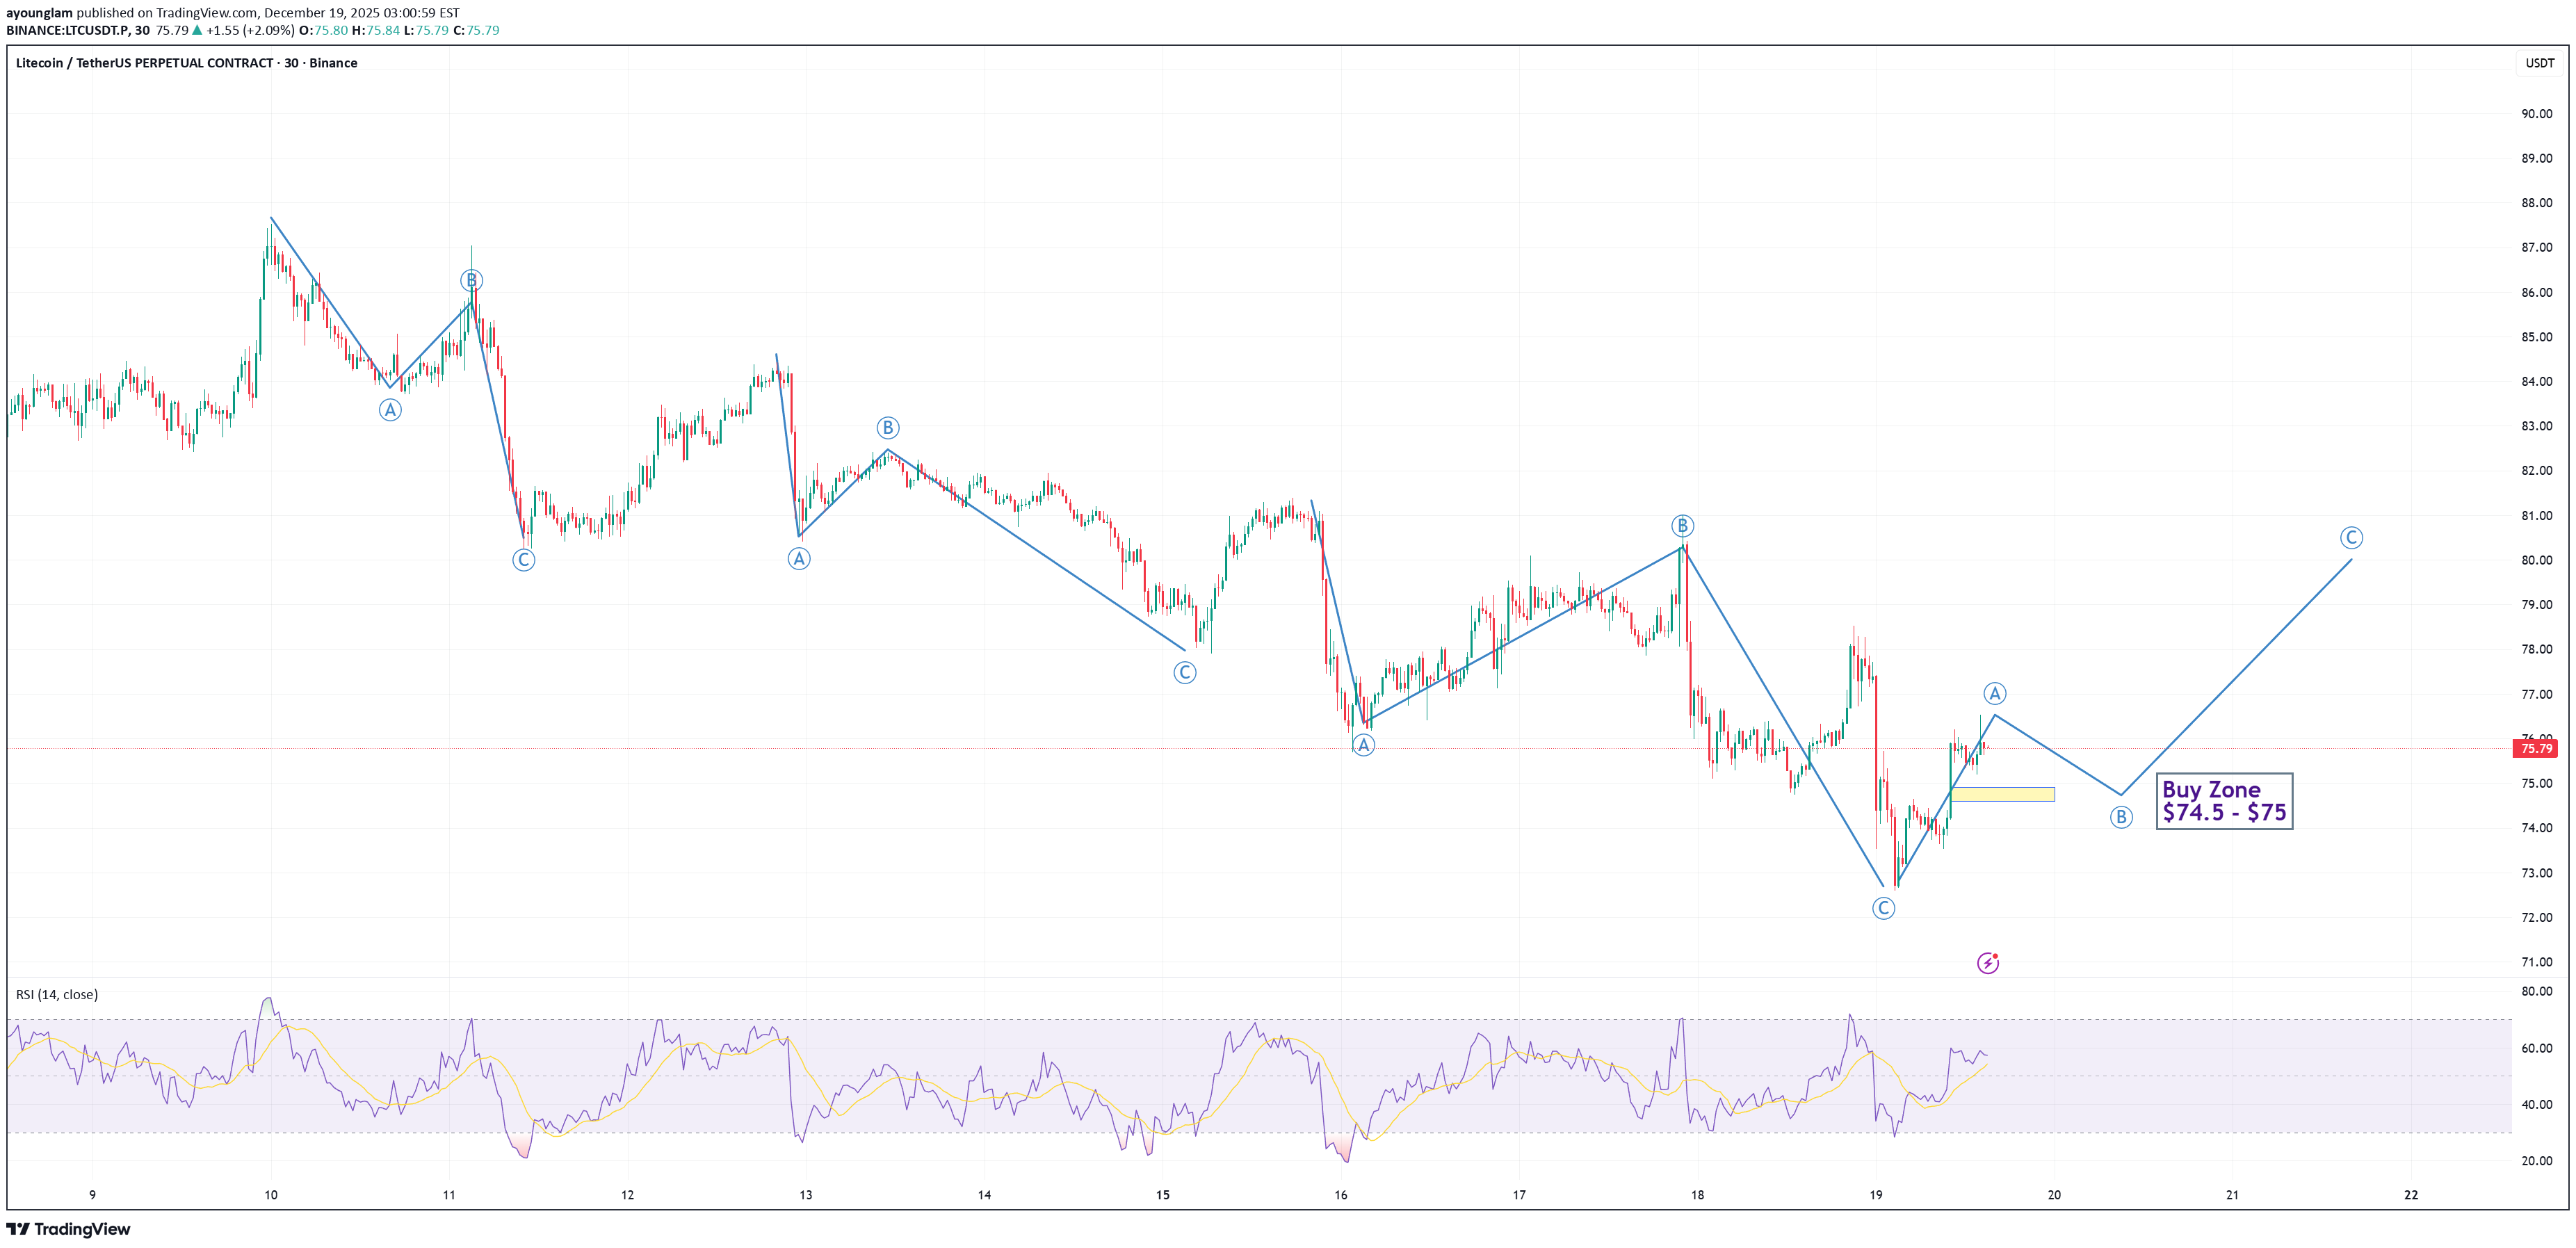
Direction: BUY (Long) 📋 Technical Summary: Elliot Wave 🎯 ENTRY ZONE: $74.50 – $76.50 🛡️ STOP LOSS (SL): $71.5 💰 TAKE PROFIT (TP) TARGETS: TP 1: $77.5 TP 2: $80.5 Disclaimer: This is a technical analysis based on the provided chart and is not absolute financial advice. The crypto market is highly volatile. Always use proper risk management and position sizing.
LTCUSD potential reversal from bear traps
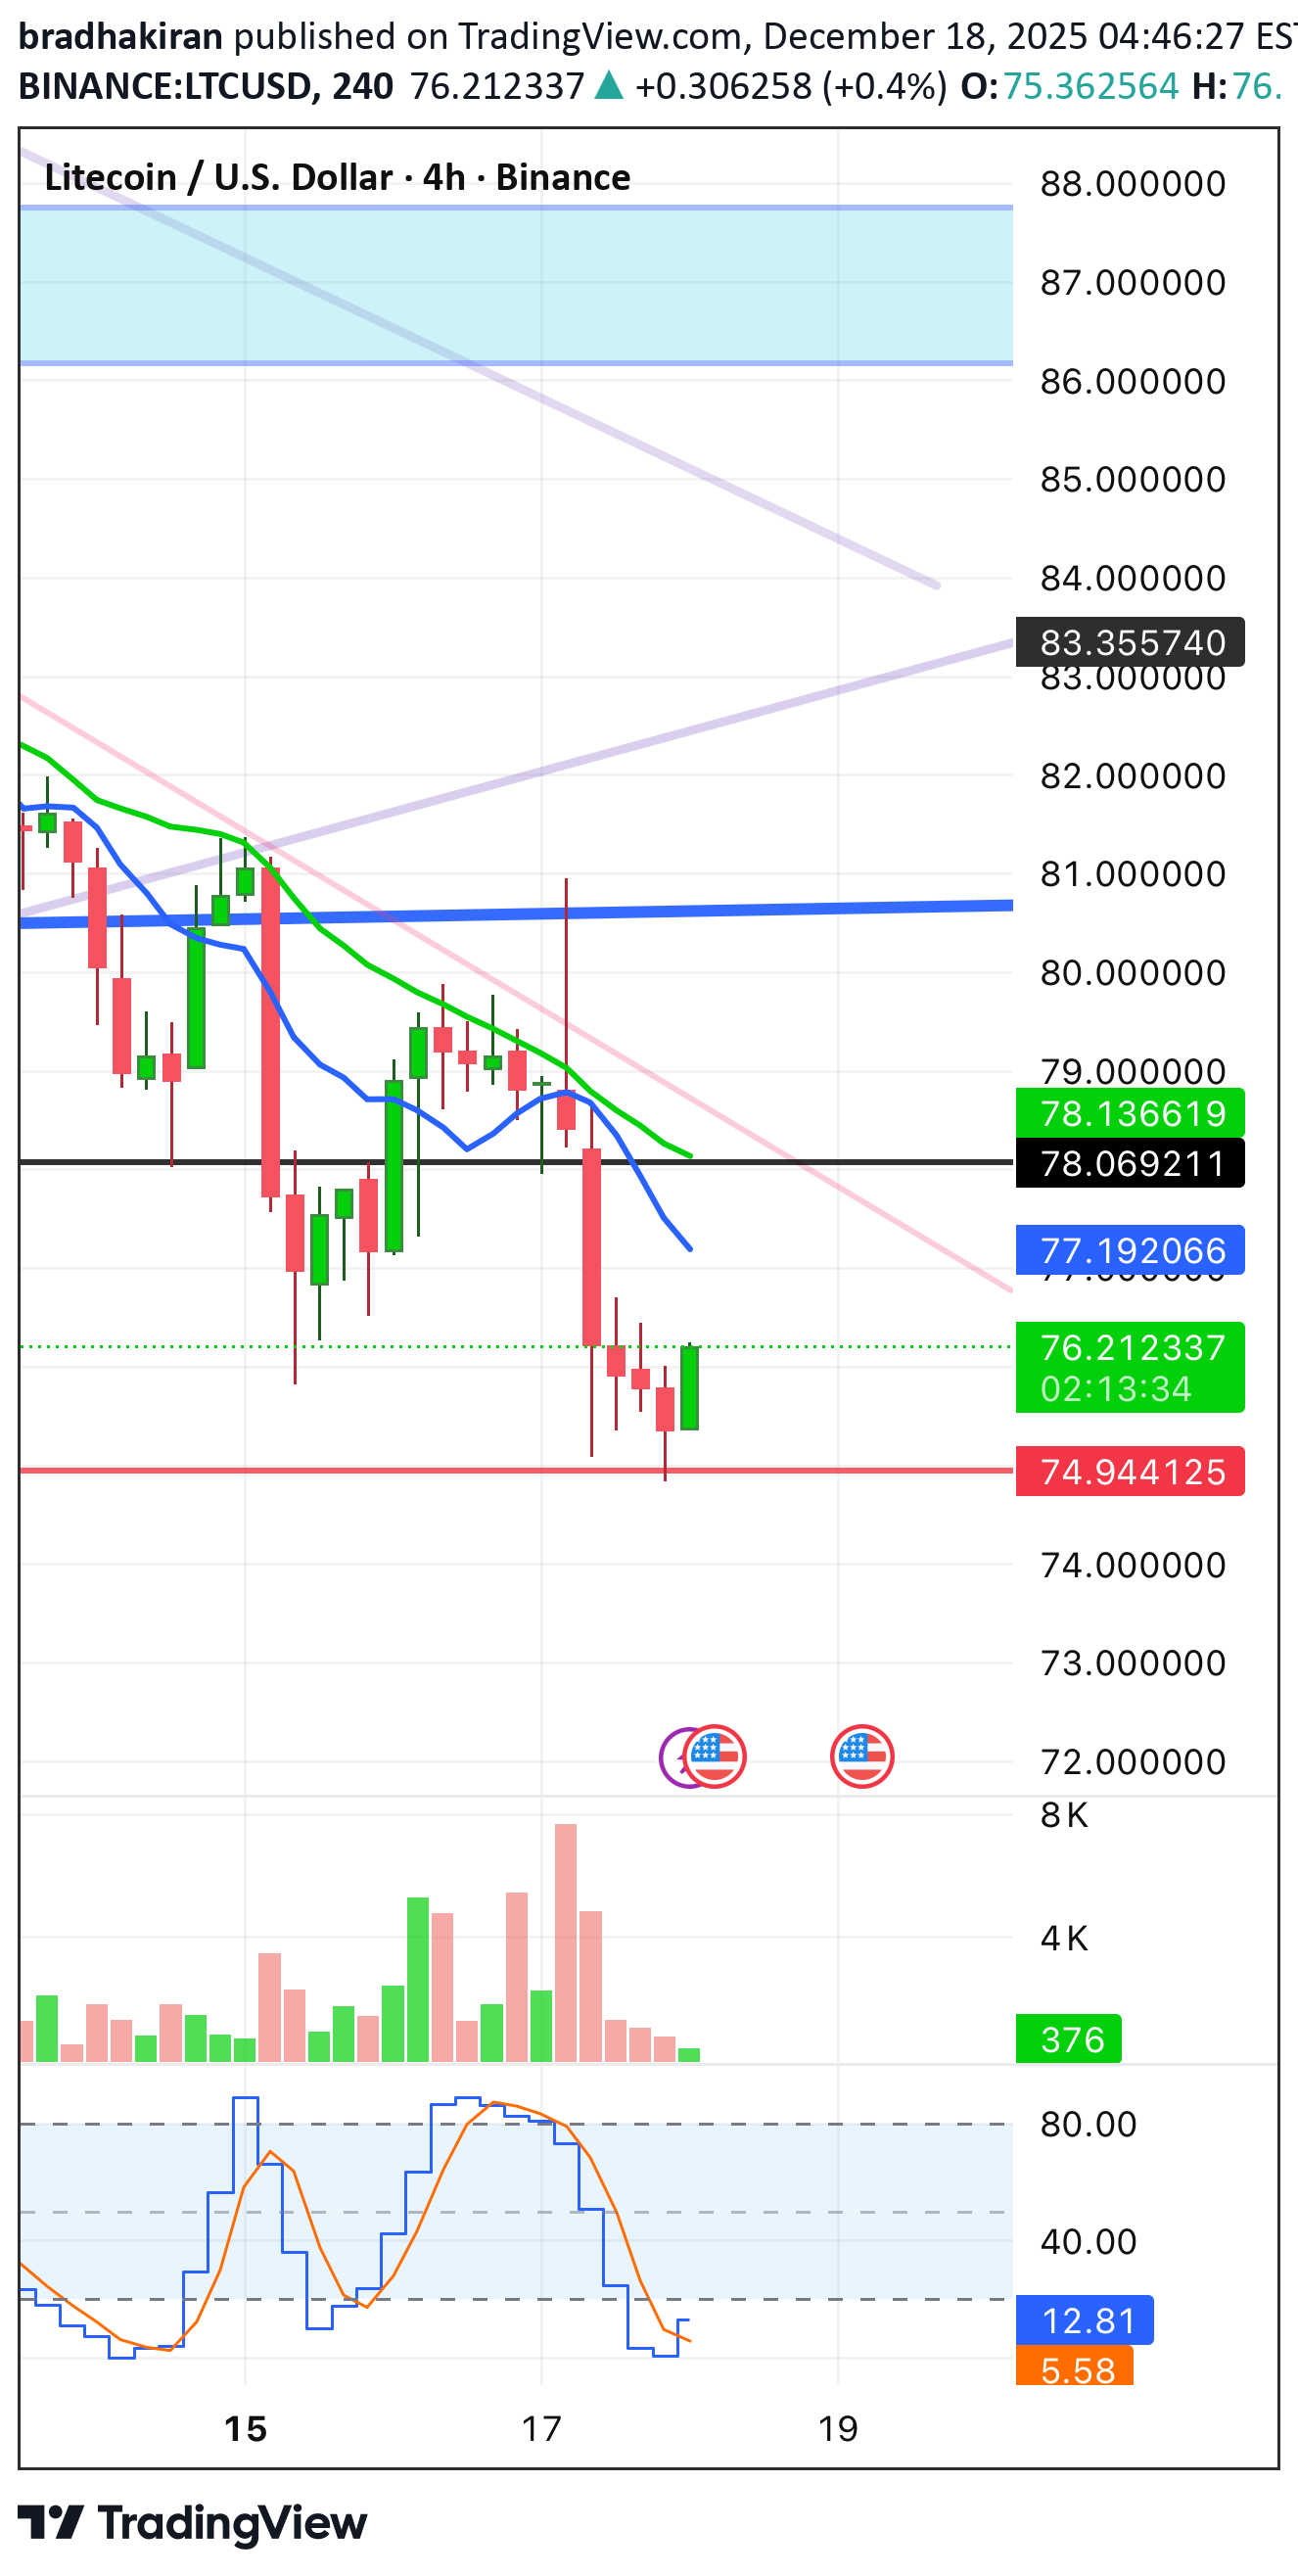
Though there is missing bullish momentum on LTC, my view is it struggling due to overall sentiment on crypto and BTC. As discussed couple of days ago there was a bear trap set to break its key support structure. Making investors to make panic selling and hunting there stop losses at key support trend lines. Looks like it is making a pull back now from $74 to $76 range. Now we need to sit tight to see if it closes above $78.06 for a potential reversal signal for entry point. There may be another retest due to test the $75 support line. I feel the last 2 weeks of the year will be a super charged for LTC. An opportunity to raise to $97 to $108. ~25% to $35% raise possible. Don’t miss your chances. Invest with caution and wisely, end of the day it’s your money.
tomas_jntx
LTC Loses Structure – More Downside Ahead?
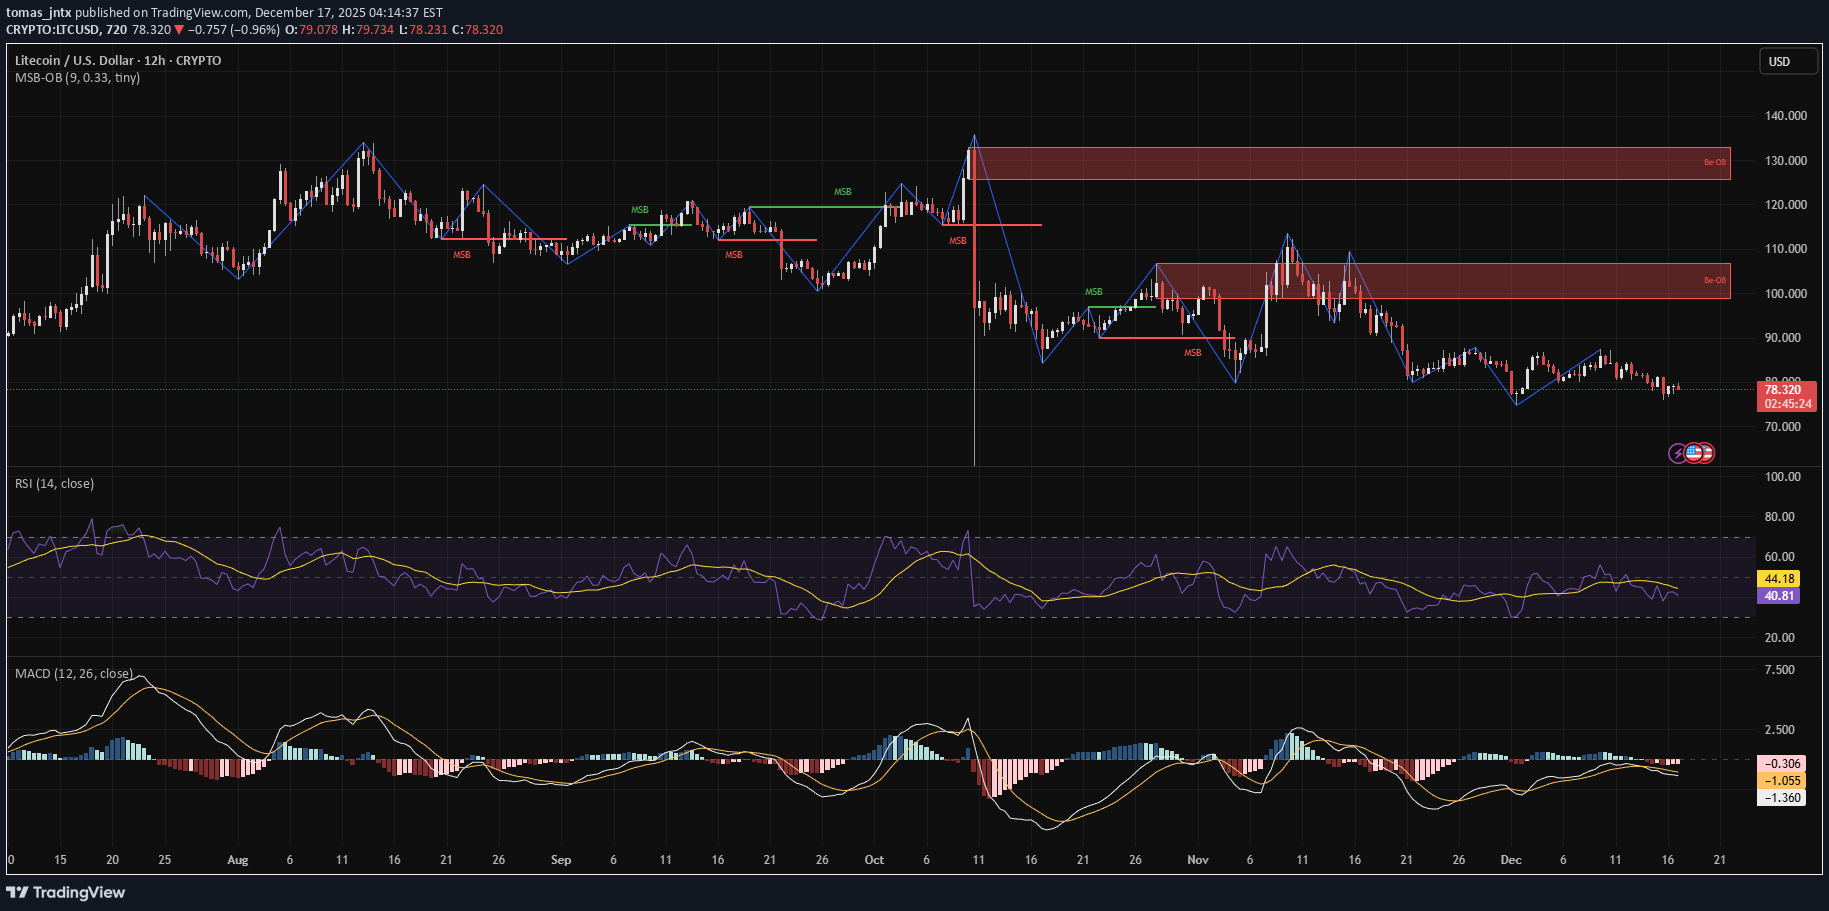
Trend Check: LTC has flipped bearish again with a strong MSB down and no bullish reclaim since. Price is trending lower with failed reactions to resistance. Indicators: RSI: 40 (bearish) MACD: Bearish momentum, widening cross Structure: After multiple bearish MSBs and rejection from the $88–$90 area, LTC looks weak. No demand reaction yet. Position: Short bias Entry Idea: Short below $77.5 Stop: Above $80 Targets: $73 → $68 Reasoning: Structure favors sellers. Indicators show momentum supports the trend — bearish continuation likely unless bulls step in fast.
thakurudays9970
Trading Levels for LTCUSD.
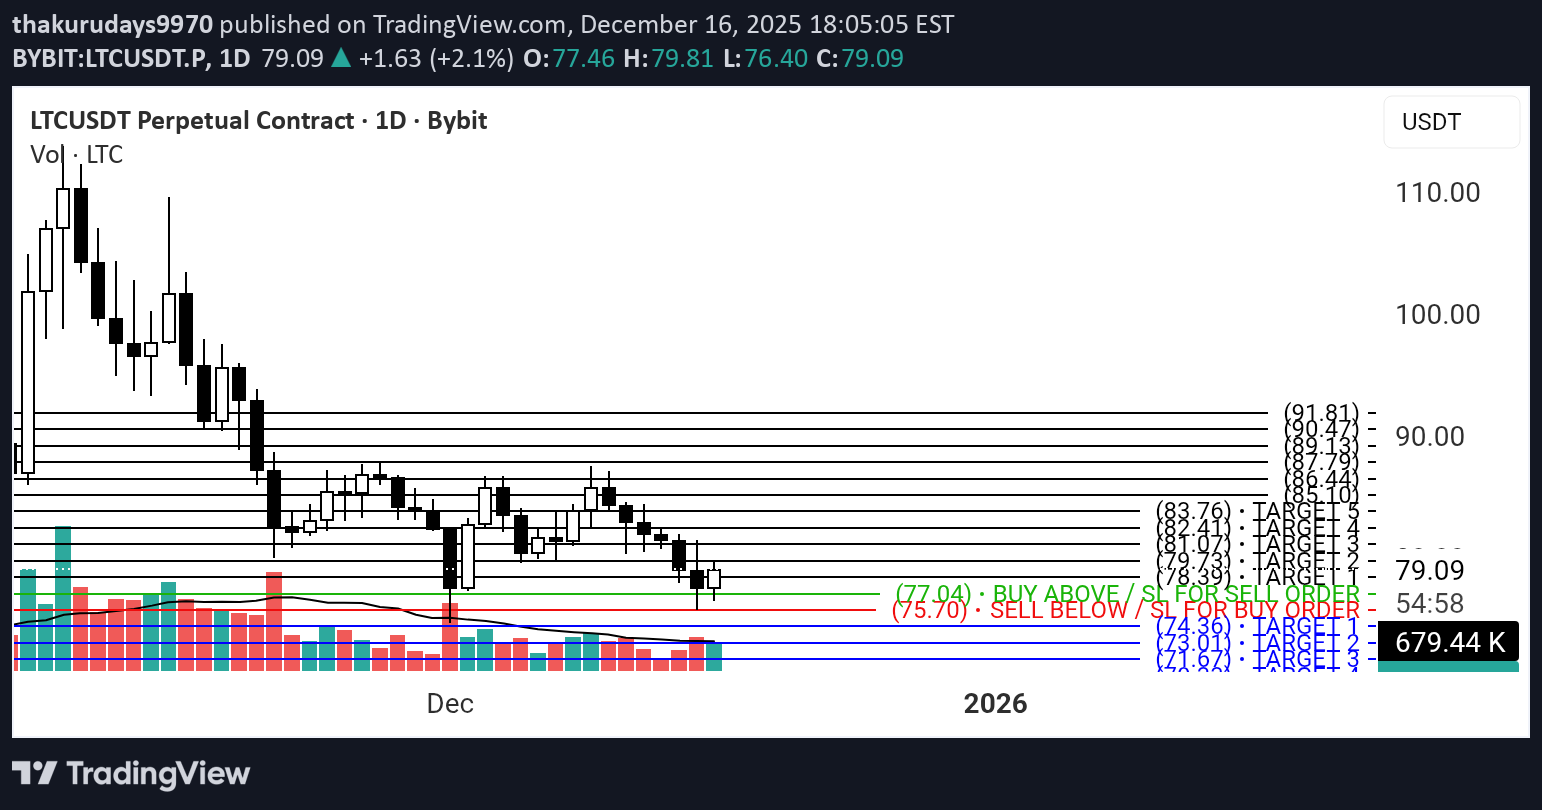
Trading Levels for LTCUSD. Anyone can trade on both sides with strict stoploss.

SwallowAcademy
Litecoin (LTC): Once We Break The Neckline Zone We Longing | BUY
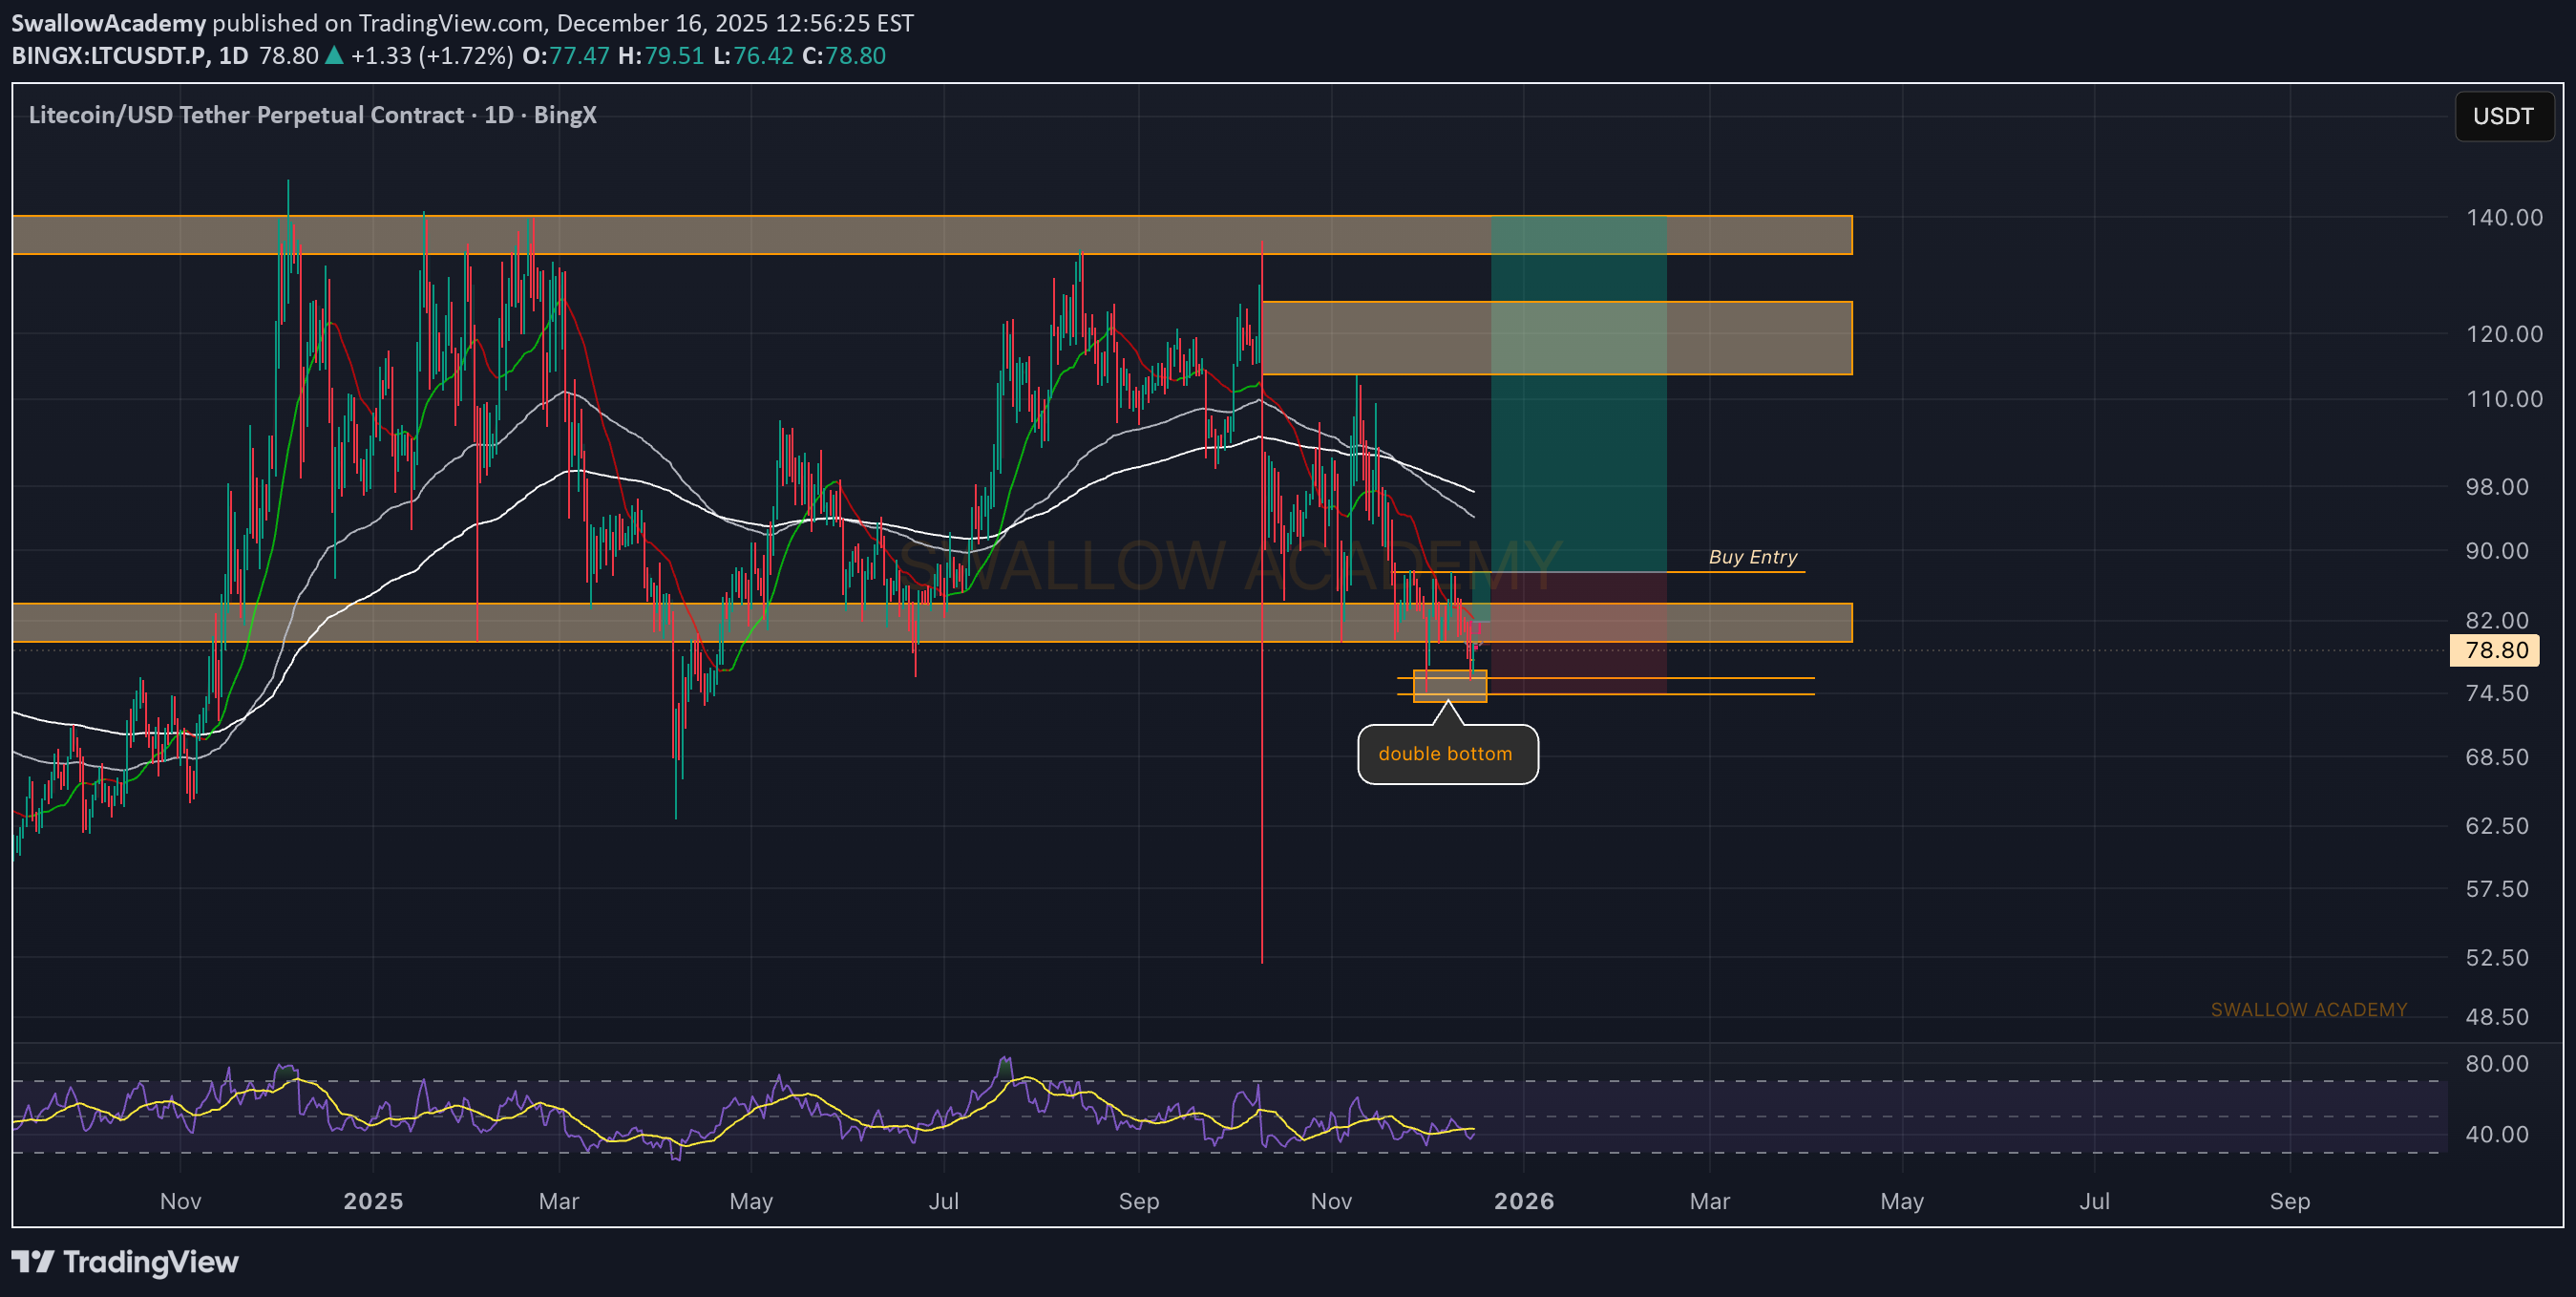
LTC is forming a decent pattern here, where price is sitting near the local support zone. If all goes as planned, we might be seeing a good buy entry, so we wait! More in-depth info is in the video—enjoy! Swallow Academy
LTC: Breakout Before Altcoin Season
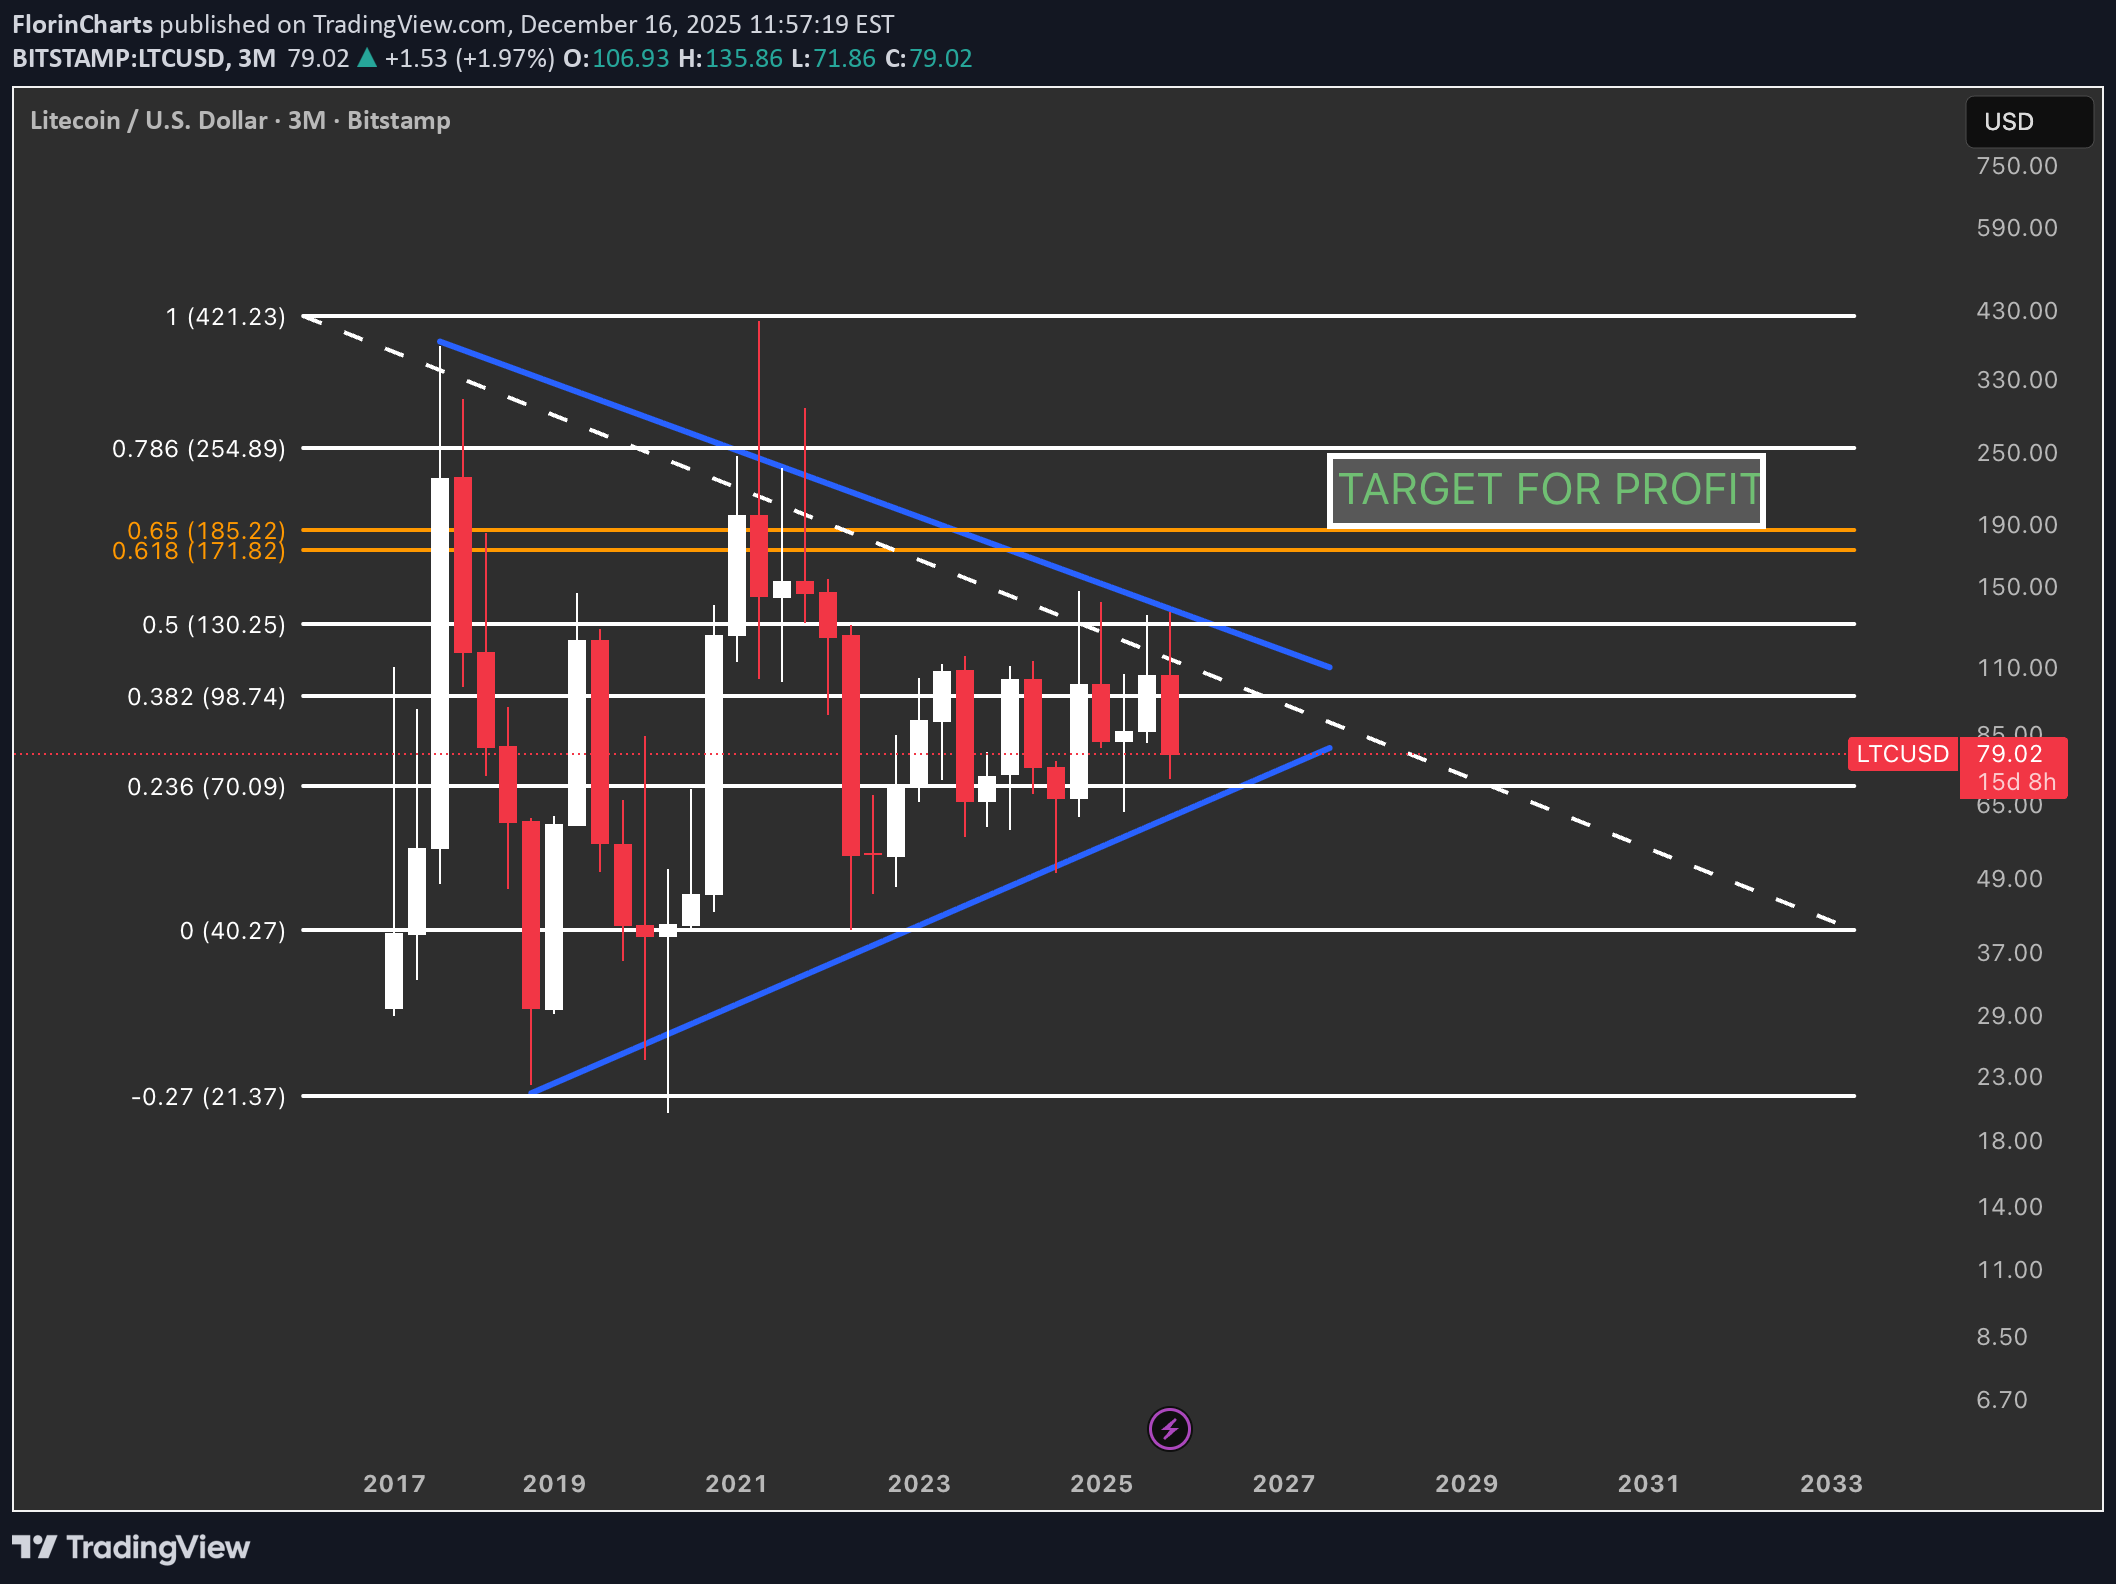
Price has been moving inside a large 3‑month symmetrical triangle, with lower highs from the 2017 peak and higher lows since the 2018 bottom. The current candle is compressing between the support and resistance trendlines, suggesting a larger move is getting closer. A confirmed breakout above the triangle resistance and the 0.5–0.618 Fib would open the way toward the marked profit zone in the 0.65–0.786 area (~185–255 USD), where previous supply sits. As long as the higher‑low structure holds, the bias remains bullish; a clean weekly/3M close back below the triangle support would invalidate this idea and shift the focus back toward the 40–50 USD zone. Litecoin often behaves as a “mid‑cap beta play” between Bitcoin and smaller alts: when BTC stabilizes and capital starts rotating out along the risk curve, LTC is one of the first large caps to wake up. A strong, high‑timeframe breakout on Litecoin can therefore be an early sign that market participants are ready to take more risk, paving the way for a broader altcoin season.
Tradu
LTCUSD H4 | Bearish Continuation
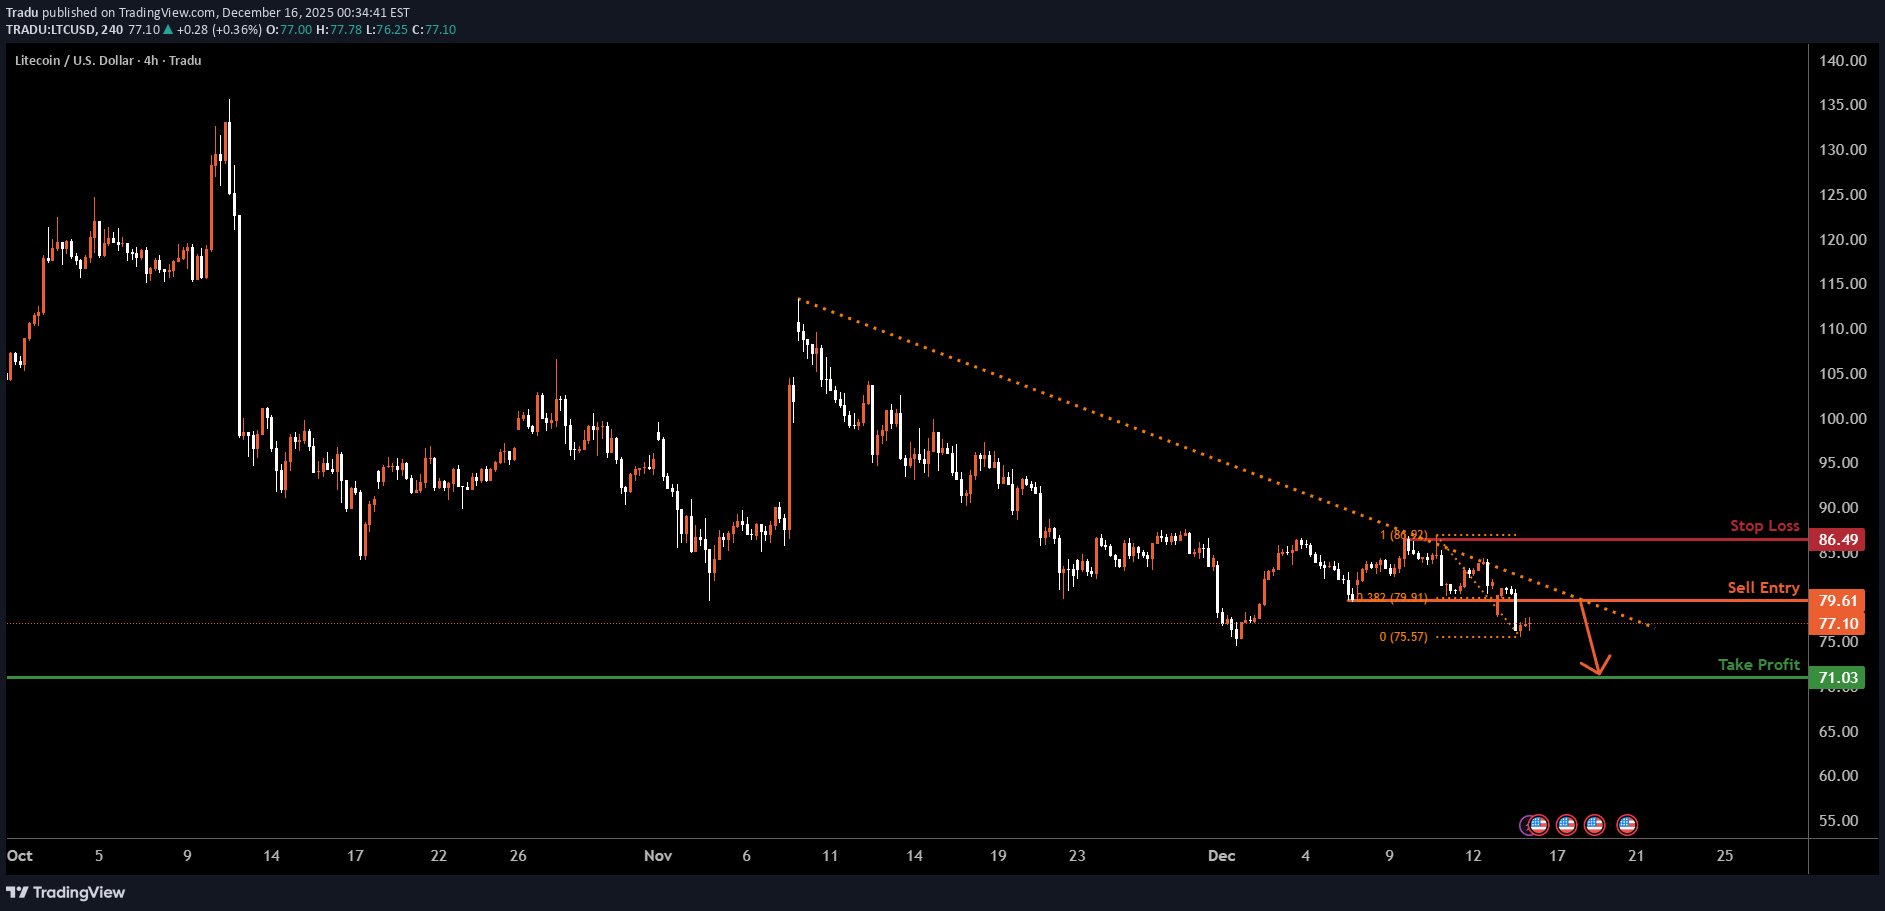
Momentum: Bearish Price may retrace to the sell entry, which aligns with the 38.2% Fibonacci retracement, adding significant strength to this level. Sell Entry: 79.61 Pullback resistance 38.2% Fibonacci retracement Stop Loss: 86.49 Pullback resistance Take Profit: 71.03 Pullback support High Risk Investment Warning Stratos Markets Limited ( tradu.com/uk ), Stratos Europe Ltd ( tradu.com/eu ): CFDs are complex instruments and come with a high risk of losing money rapidly due to leverage. 70% of retail investor accounts lose money when trading CFDs with this provider. You should consider whether you understand how CFDs work and whether you can afford to take the high risk of losing your money. Stratos Global LLC ( tradu.com/en ): Losses can exceed deposits. Please be advised that the information presented on TradingView is provided to Tradu (‘Company’, ‘we’) by a third-party provider (‘TFA Global Pte Ltd’). Please be reminded that you are solely responsible for the trading decisions on your account. Any information and/or content is intended entirely for research, educational and informational purposes only and does not constitute investment or consultation advice or investment strategy. The information is not tailored to the investment needs of any specific person and therefore does not involve a consideration of any of the investment objectives, financial situation or needs of any viewer that may receive it. Past performance is not a reliable indicator of future results. Actual results may differ materially from those anticipated in forward-looking or past performance statements. We assume no liability as to the accuracy or completeness of any of the information and/or content provided herein and the Company cannot be held responsible for any omission, mistake nor for any loss or damage including without limitation to any loss of profit which may arise from reliance on any information supplied by TFA Global Pte Ltd.

karwanbk
شکستن گُوِه نزولی لایت کوین (LTC): آیا زمان صعود فرا رسیده است؟
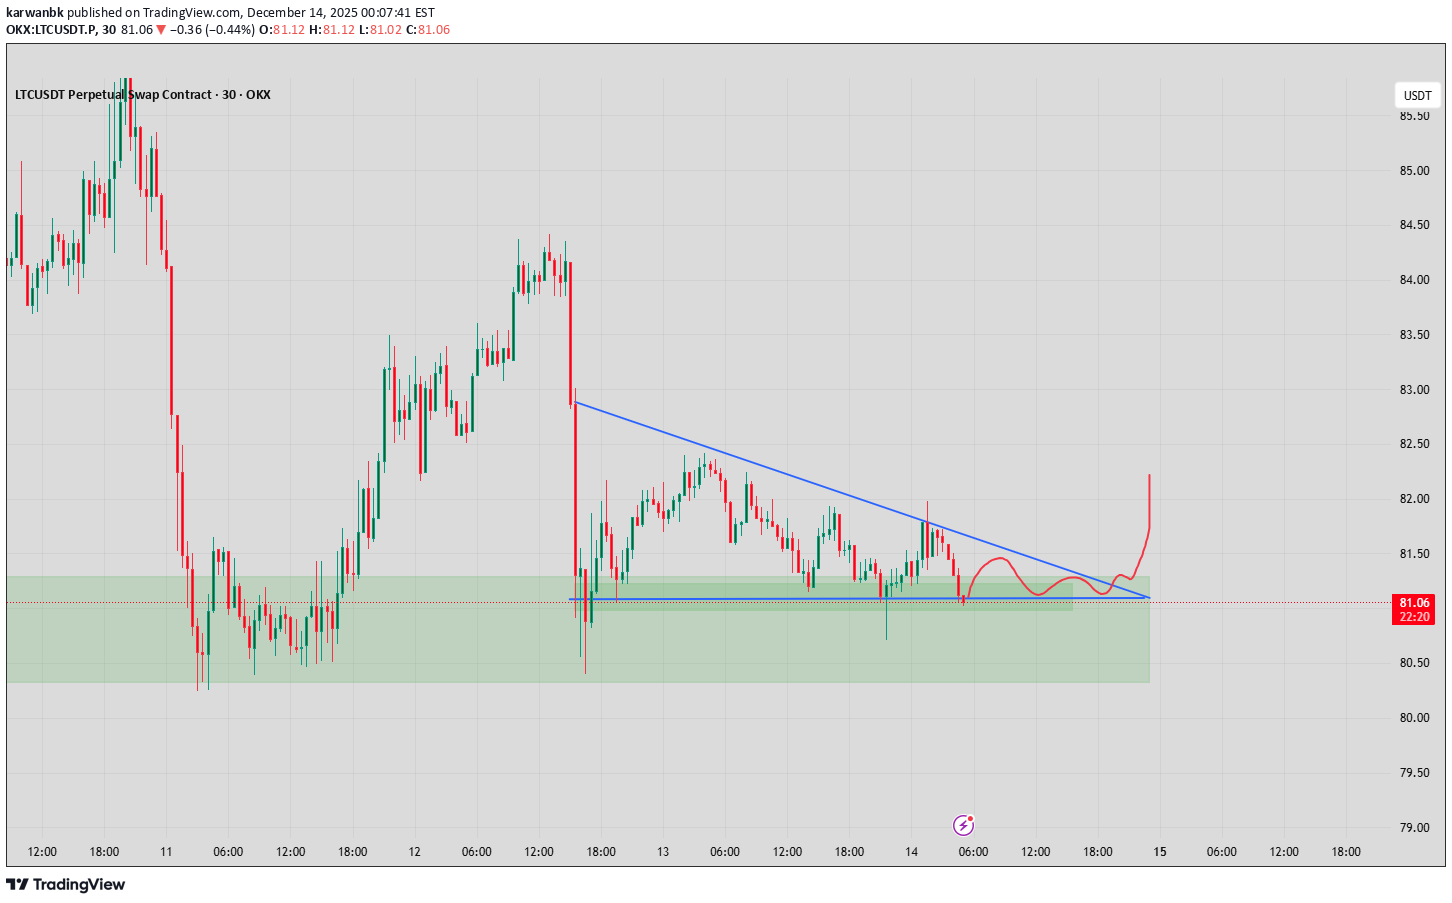
we may see bullish push after breaking that falling wedge structure
Disclaimer
Any content and materials included in Sahmeto's website and official communication channels are a compilation of personal opinions and analyses and are not binding. They do not constitute any recommendation for buying, selling, entering or exiting the stock market and cryptocurrency market. Also, all news and analyses included in the website and channels are merely republished information from official and unofficial domestic and foreign sources, and it is obvious that users of the said content are responsible for following up and ensuring the authenticity and accuracy of the materials. Therefore, while disclaiming responsibility, it is declared that the responsibility for any decision-making, action, and potential profit and loss in the capital market and cryptocurrency market lies with the trader.