
INJ
Injective Protocol
| تریدر | نوع سیگنال | حد سود/ضرر | زمان انتشار | مشاهده پیام |
|---|---|---|---|---|
 Richtv_officialRank: 30059 | خرید | حد سود: تعیین نشده حد ضرر: تعیین نشده | 12/4/2025 | |
خرید | حد سود: تعیین نشده حد ضرر: تعیین نشده | 12/5/2025 |

Price Chart of Injective Protocol
سود 3 Months :
خلاصه سیگنالهای Injective Protocol
سیگنالهای Injective Protocol
Filter
Sort messages by
Trader Type
Time Frame
تحلیل تکنیکال لحظهای INJ: آیا ارزان شدن فعلی، فرصت رسیدن به ۶ دلار است؟

Richtv_official
فرصت انفجاری INJ: خرید در کف قیمت حمایتی با پتانسیل سود بالا!

Injective INJ is trading at an extremely oversold level, sitting directly on major horizontal support that has historically triggered strong bullish reversals. The current zone could offer a high-risk, high-reward opportunity for a long spot position. 🟢 Trade Setup Entry Zone: $5.50 – $6.00 Targets (TP): • TP1: $7.00 – $8.00 • TP2: $10.25 – $12.00 • TP3: $14.00 – $16.00 Stop Loss: $5.00

mastercrypto2020
سیگنال خرید قوی INJ/USDT: اهداف سود و استراتژی ورود دقیق!

--- 📢 Official Trade Signal – INJ/USDT 📈 Position Type: LONG 💰 Entry Price: 5.430 --- 🎯 Take-Profit Targets (Partial Exits): TP1 = 5.575 TP2 = 5.711 TP3 = 5.936 TP4 = 6.113 TP5 = — --- 🛑 Stop-Loss: 5.125 📊 Timeframe: 15m ⚖️ Risk/Reward Ratio: 2.28 💥 Suggested Leverage: 5× – 10× --- 🧠 Technical Analysis Summary INJ is showing bullish structure development after reclaiming the 5.40 zone. Price is forming higher lows and pushing into early reversal momentum on the 15m chart. Liquidity targets align with resistance clusters at 5.57, 5.71, and 5.93. A breakout from the recent consolidation zone could trigger continuation toward 6.11. --- ⚙️ Trade Management Rules ✔️ Take partial profit at TP1 ✔️ Move SL to Break-Even immediately after TP1 is hit ✔️ Trail SL as price progresses toward upper targets ✔️ Avoid re-entry if SL at 5.125 gets hit ✔️ Confirm structure before entering --- ⚠️ Risk-Management Note After TP1 is hit, SL must be moved to the Entry Price — this is standard professional risk management. If price reaches TP1 then reverses and hits break-even, it is not a loss. The trade simply closed with zero risk while protecting capital. --- 📌 TradingView Hashtags #INJUSDT #INJ #CryptoSignal #LongSetup #TradingView #TechnicalAnalysis #FuturesTrading #Altcoins ---

HodlAhmad
آیا این آخرین فرصت برای جهش 30 برابری ارز INJ است؟ (تحلیل پله نهایی)

“INJ macro view: Final corrective leg nearing completion. If we tap the green box, next macro leg targets $60+. 30x potential from the lows. Don’t hate me for this… it is what it is 🚀📈”

TenderTown
تحلیل انفجار قیمتی اینجکتیو (INJ): آیا حمایت تاریخی دوباره موجب صعود خواهد شد؟
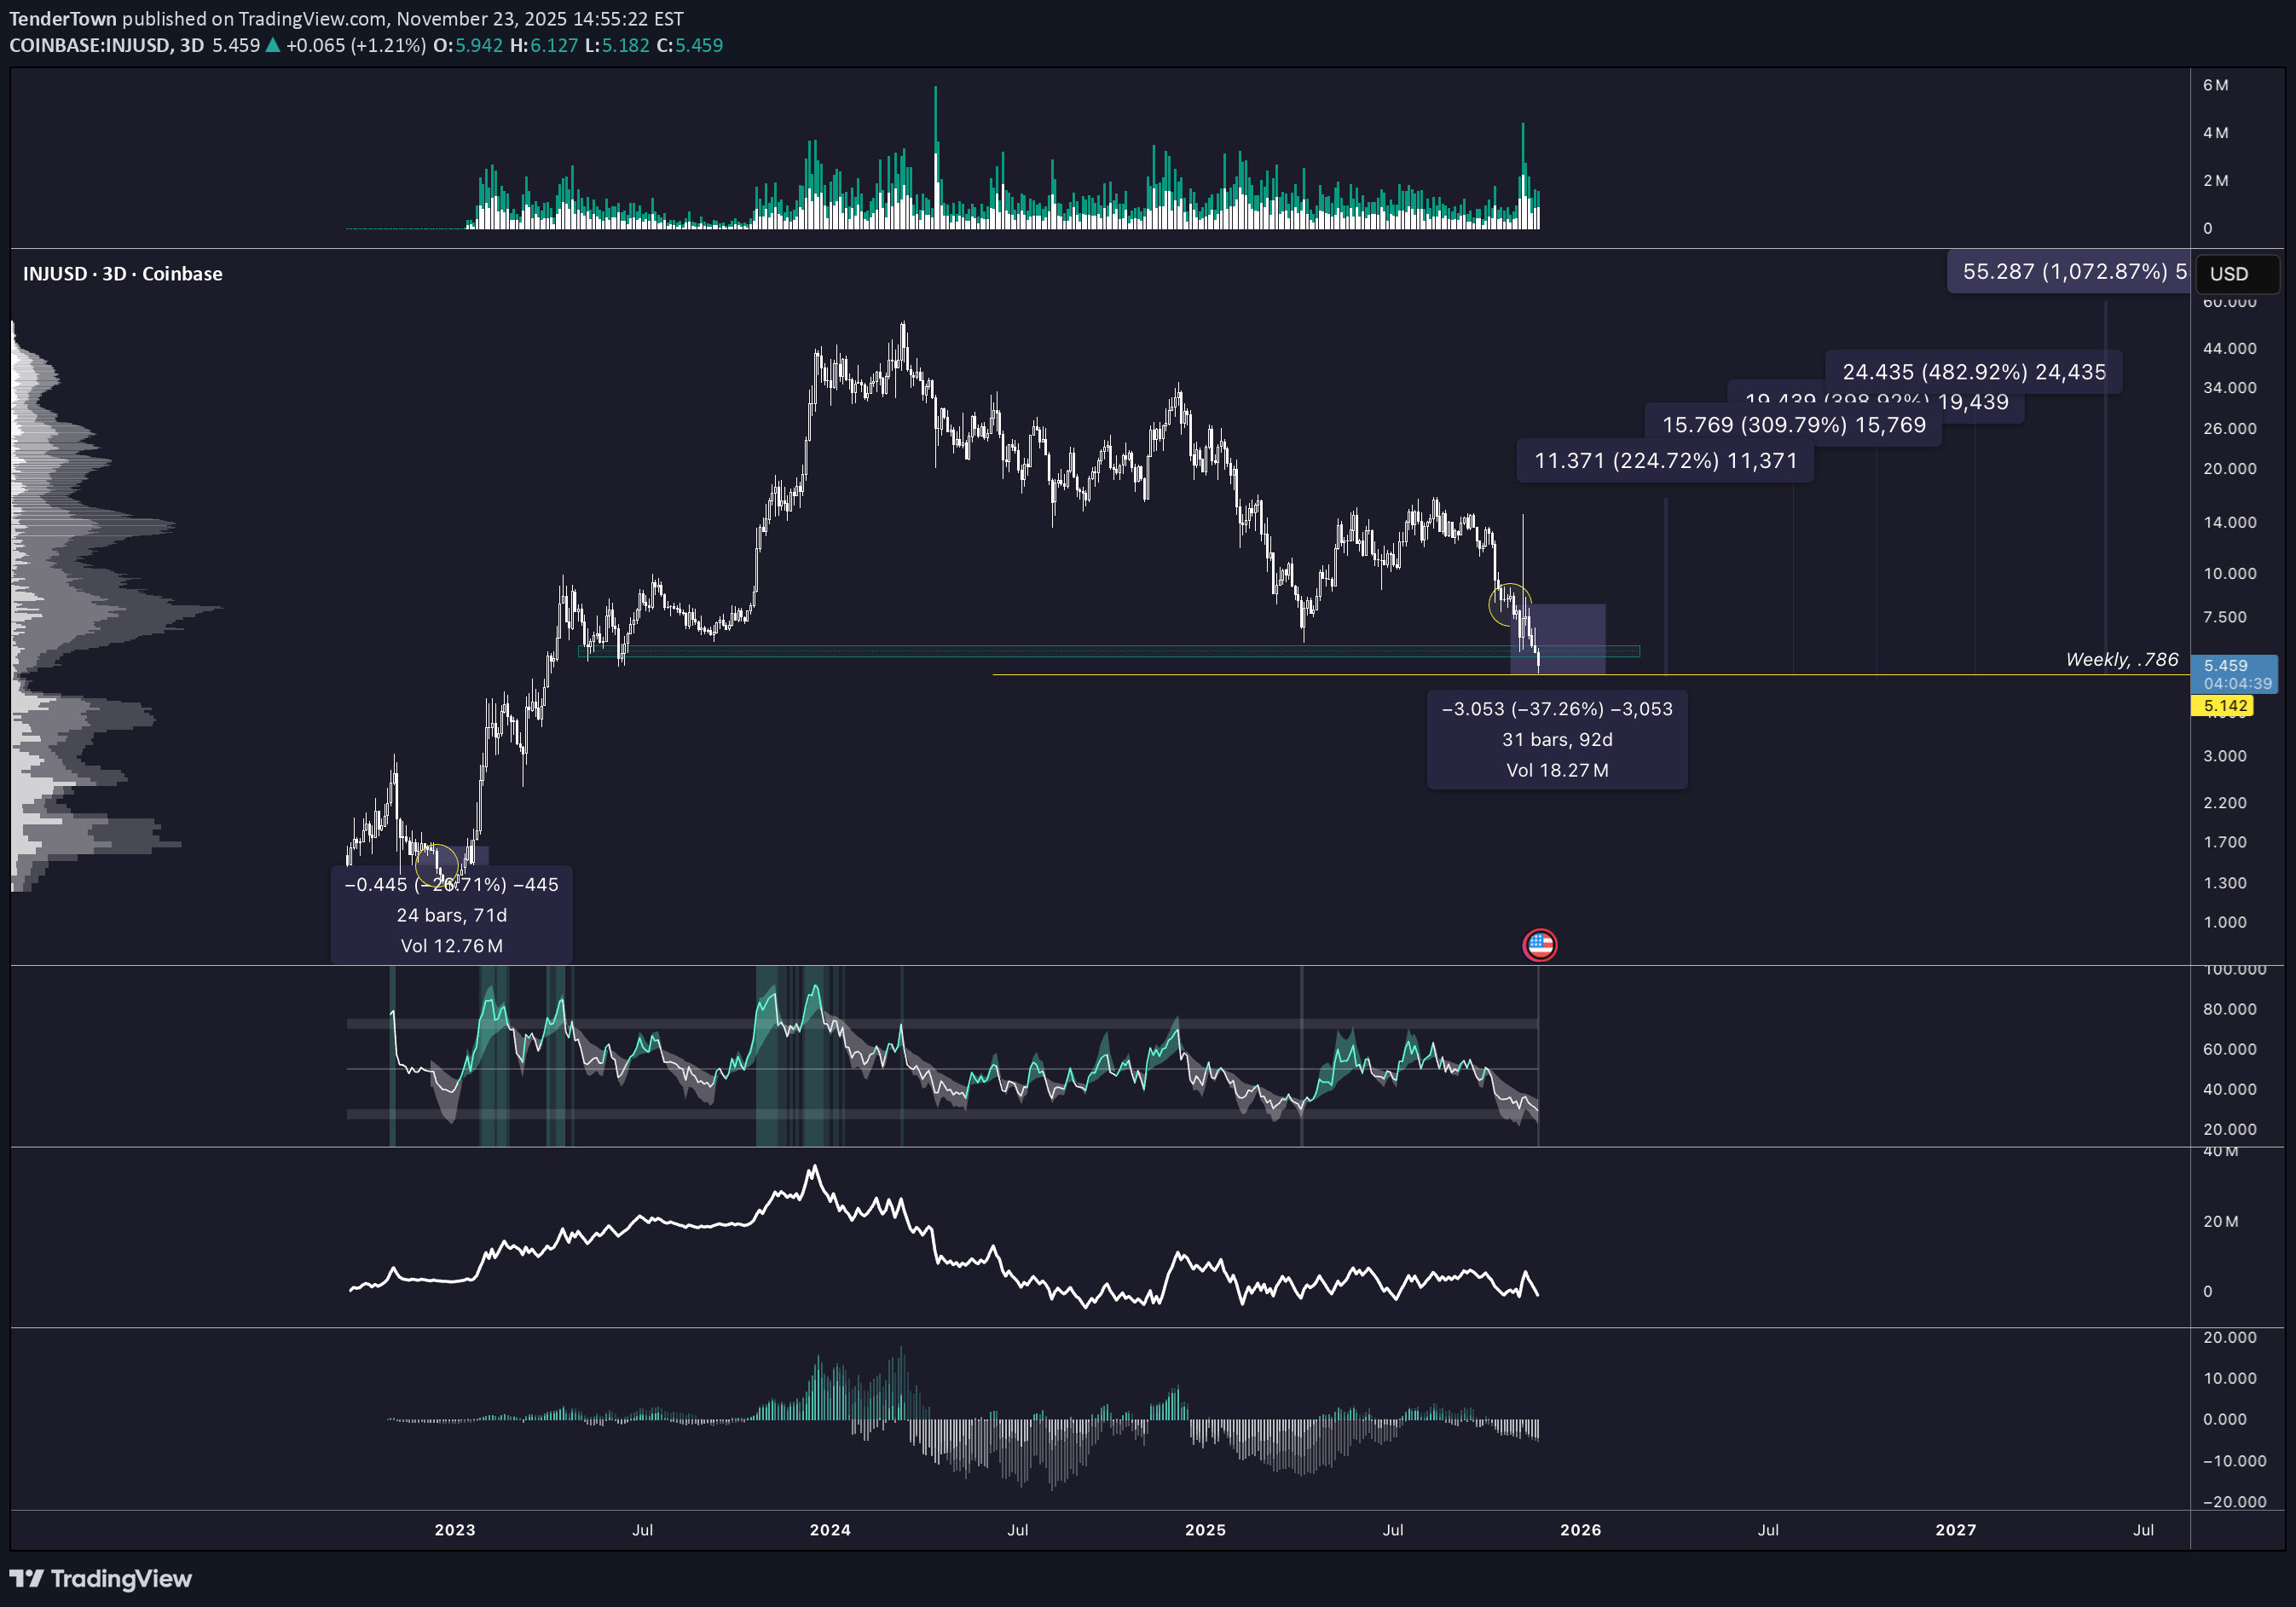
This idea focuses on how volatility expansion behaves around major structural levels on INJ using the three day and weekly charts. The first key reference point is the 2023 bottom on the left side of the chart. Price produced a cluster of exhaustion style candles, volume spiked, and volatility was compressed before a full expansion cycle began. That entire sequence is included as a historical example of how volatility expansion typically starts from deep compression and reclaimed structure. The second and most important focus is the current setup. Price has retraced directly into the same major support shelf that launched the previous expansion cycle. The yellow arrows on the weekly chart highlight the structural zone and how cleanly price is retesting it. This level also aligns with the seventy eight six retracement, giving both structural and fib confluence. The volatility panels show compression building again. Momentum is fading into support and historical volatility is sitting at the lower end of its range. This type of environment has repeatedly been the base condition for volatility expansion to occur when support holds. On the right side of the chart the fib projections outline the potential expansion legs. Eleven point three seven one and fifteen point seven six nine are the initial targets if price stabilizes above support. Twenty four point four three five and fifty five point two eight seven represent extended cycle targets based on prior expansion behavior. The idea is simple. Price is retesting a major level with volatility compressed. Historically this combination has led to strong expansion cycles. The next move depends on whether this structural shelf holds or fails.
mastercrypto2020
سیگنال فروش فوری (شورت) INJ/USDT: ورود در 6.890 با ریسک 5.9 برابری!
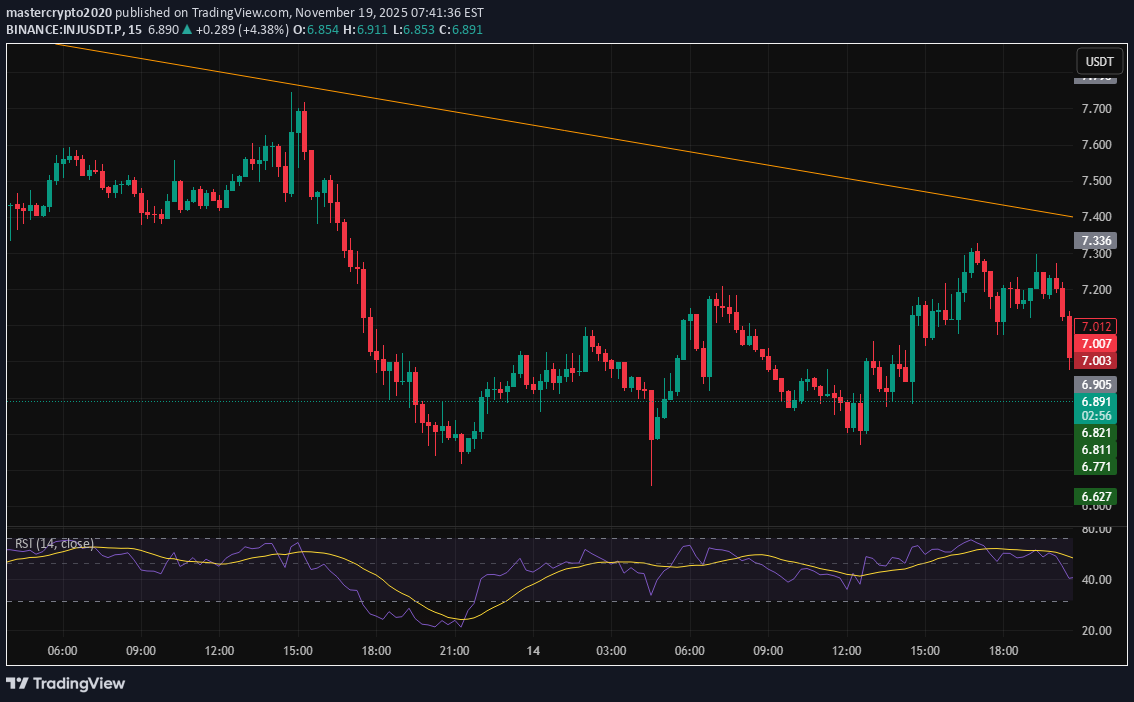
📢 Trade Signal – INJ/USDT 📉 Position Type: Short 💰 Entry Price: 6.890 --- 🎯 Take-Profit Targets (Partial Exits) TP1 = 6.8210 TP2 = 6.627 TP3 = 6.326 TP4 = — TP5 = — TP6 = — --- 🛑 Stop-Loss: 7.000 📊 Timeframe: — ⚖️ Risk/Reward Ratio: 5.9 💥 Suggested Leverage: 5× – 10× --- 🧠 Technical Analysis Summary INJ is showing weakness after tapping the 6.95–7.00 supply zone. Price has formed a bearish structure with lower highs and is now breaking below local liquidity. A clean breakdown under 6.82 (TP1) will confirm continuation toward 6.62 and 6.32, where major liquidity pools sit. Momentum indicators (RSI & volume) show increasing bearish pressure. --- ⚙️ Trade Management Take partial profit at TP1 Move SL to Break Even after TP1 hits Trail SL if price continues toward TP2–TP3 Avoid re-entry if price closes above 7.00 --- ⚠️ Disclaimer This signal is for educational purposes only. Always manage risk properly. --- 📌 Hashtags for TradingView #INJ #INJUSDT #CryptoSignal #ShortTrade #TradingView #TechnicalAnalysis #FuturesTrading #Altcoins ---
mastercrypto2020
سیگنال خرید INJ/USDT: مسیر صعودی تا هدف 8 دلار با اهرم 10X!
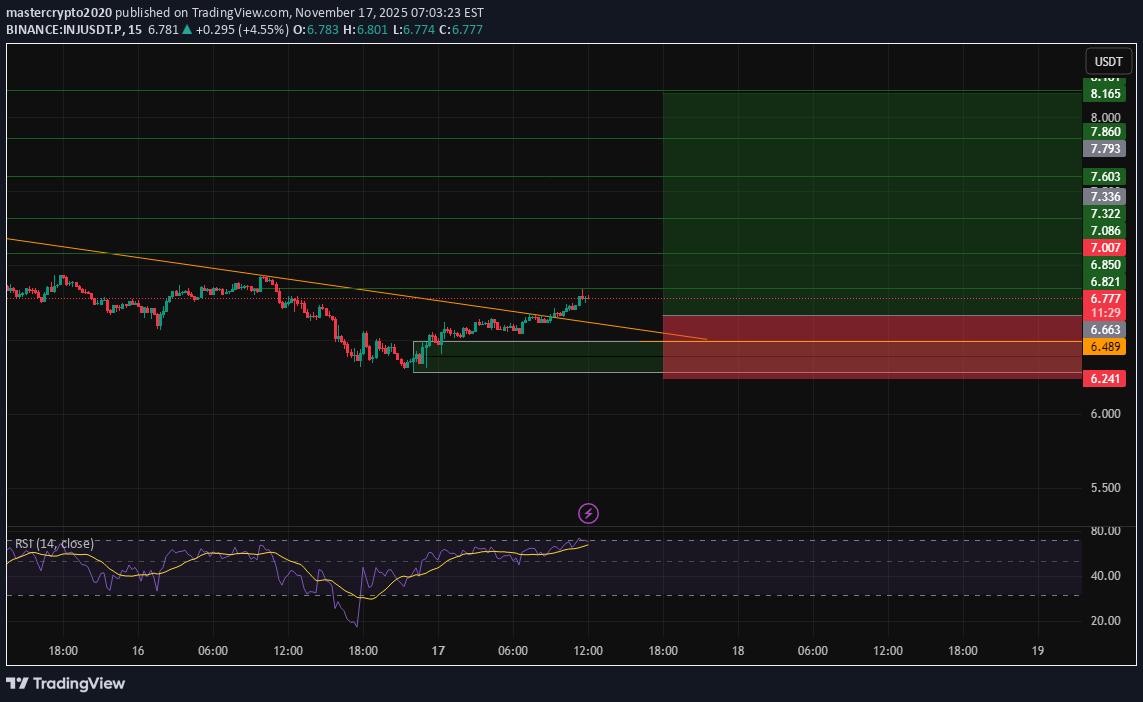
--- 📢 Trade Idea: INJ/USDT Type: Long Entry Zone: 6.489 – 6.667 --- 🎯 Take-Profit Targets (Partial Exits): • TP1 = 6.850 • TP2 = 7.090 • TP3 = 7.324 • TP4 = 7.600 • TP5 = 7.860 • TP6 = 8.185 --- 🛑 Stop-Loss: 6.234 ⏱ Timeframe: 15m ⚖️ R/R Ratio: 3.56 💥 Suggested Leverage: 5x – 10x --- 🧠 Technical Analysis Summary: INJ is trading inside a bullish accumulation zone between 6.48 – 6.66, showing strong support and repeated higher lows. A breakout above 6.85 will likely trigger bullish continuation toward 7.09 → 7.32 → 7.60. Momentum indicators (RSI & MACD) show early bullish reversal signals. Price is reclaiming EMA20 and EMA50 on lower timeframes, supporting a long setup. --- ⚙️ Trade Management Tips: • Take partial profit at TP1 and move SL to entry. • Use a trailing stop from TP2 onward. • Avoid re-entry if price closes below 6.23. --- ⚠️ Disclaimer: This is educational analysis, not financial advice. Always manage risk and use proper position sizing. --- 📌 TradingView Hashtags: #INJUSDT #Injective #CryptoSignal #TradingViewIdeas #TechnicalAnalysis #FuturesTrading #AltcoinSet

CryptoNuclear
INJ در آستانه تصمیم بزرگ: آیا سقوط ادامه مییابد یا شوک بزرگ بازگشت؟
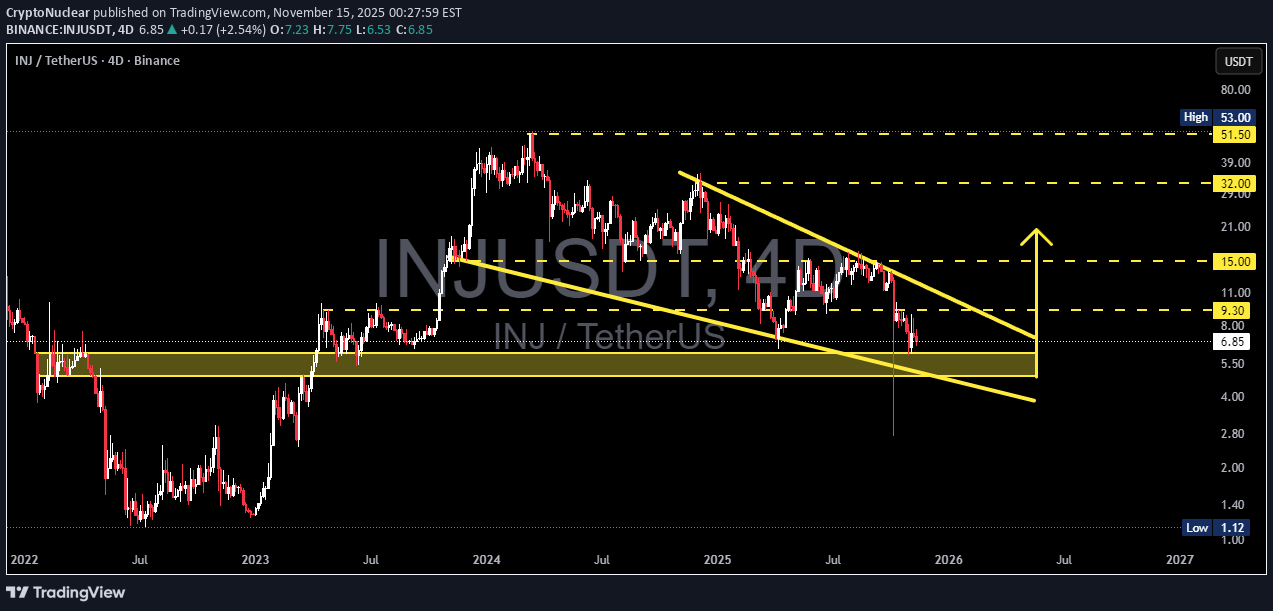
INJ is currently at a critical moment within its broader market structure. The price has returned to the historical demand zone at 6.1–4.9, an area that previously triggered a large rally. The market’s reaction here will dictate whether INJ is preparing for a major bullish reversal, or entering a continuation of the bearish trend toward lower levels. The current formation resembles a medium-term Falling Wedge, a pattern typically known for signaling a potential reversal if a breakout occurs. However, selling pressure still dominates, with a persistent sequence of lower highs kept in check by the descending upper trendline. One of the most interesting elements on this chart is the long wick sweeping below support, indicating liquidity grabbing — many stop losses were triggered before the price was pulled back up. This is often an early sign that the market may be preparing to move in the opposite direction, but only if bullish confirmation follows. Without a breakout, the structure remains firmly under bearish control. In short: ➡️ INJ is standing at its biggest decision point for the coming weeks. --- Bullish Scenario — “High-Potential Reversal from the Golden Zone” Bullish Triggers A strong bounce from 6.1–4.9 with a solid 4D bullish candle. A clear breakout above the wedge’s upper trendline. Increasing buy volume accompanying the breakout. Bullish divergence appearing on momentum indicators (RSI/MACD). Bullish Targets (Tiered & Based on the Chart) 1. 9.3 USDT → first resistance and early bullish validation. 2. 15 USDT → medium-term resistance to test trend strength. 3. 32 USDT → major target if a mid-term uptrend forms. 4. 51.5 USDT → long-term major supply for a super-bullish scenario. Bullish Narrative If INJ successfully breaks out of this wedge, the structure will strongly resemble a classic reversal pattern, often marking the beginning of a significant impulsive move. --- Bearish Scenario — “Support Break Leads to Trend Continuation” Bearish Triggers A 4D candle closing below 4.9, breaking the demand zone. No strong buying reaction on the retest of the broken support. Increasing sell volume during the breakdown. Bearish Targets (Tiered) 1. 3.0 USDT → psychological level & previous structural zone. 2. 1.12 USDT → extreme downside target if the long-term structure collapses. Bearish Narrative If the 6.1–4.9 zone fails to hold, the bearish momentum that has been building since early 2024 is likely to continue, and the wedge structure turns into a medium-term bearish channel. --- Pattern Explanation The chart currently forms a Falling Wedge (traditionally bullish). But until a breakout occurs, the pattern remains controlled by sellers. The 6.1–4.9 yellow zone acts as the key demand block — the buyers’ last major line of defense. The long lower wick indicates a liquidity sweep, often preceding a trend shift. The descending upper trendline has rejected every attempt at recovery since 2024 — a breakout here is the most crucial signal for a bullish move. --- #INJ #Injective #INJUSDT #CryptoAnalysis #PriceAction #CryptoChart #SupportAndResistance #FallingWedge #CryptoBreakout #AltcoinAnalysis #TechnicalAnalysis #MarketStructure

CryptoYodaX
سیگنال خرید پرریسک INJ در تایم فریم ۱ ساعته: آیا الان زمان ورود به بازار است؟
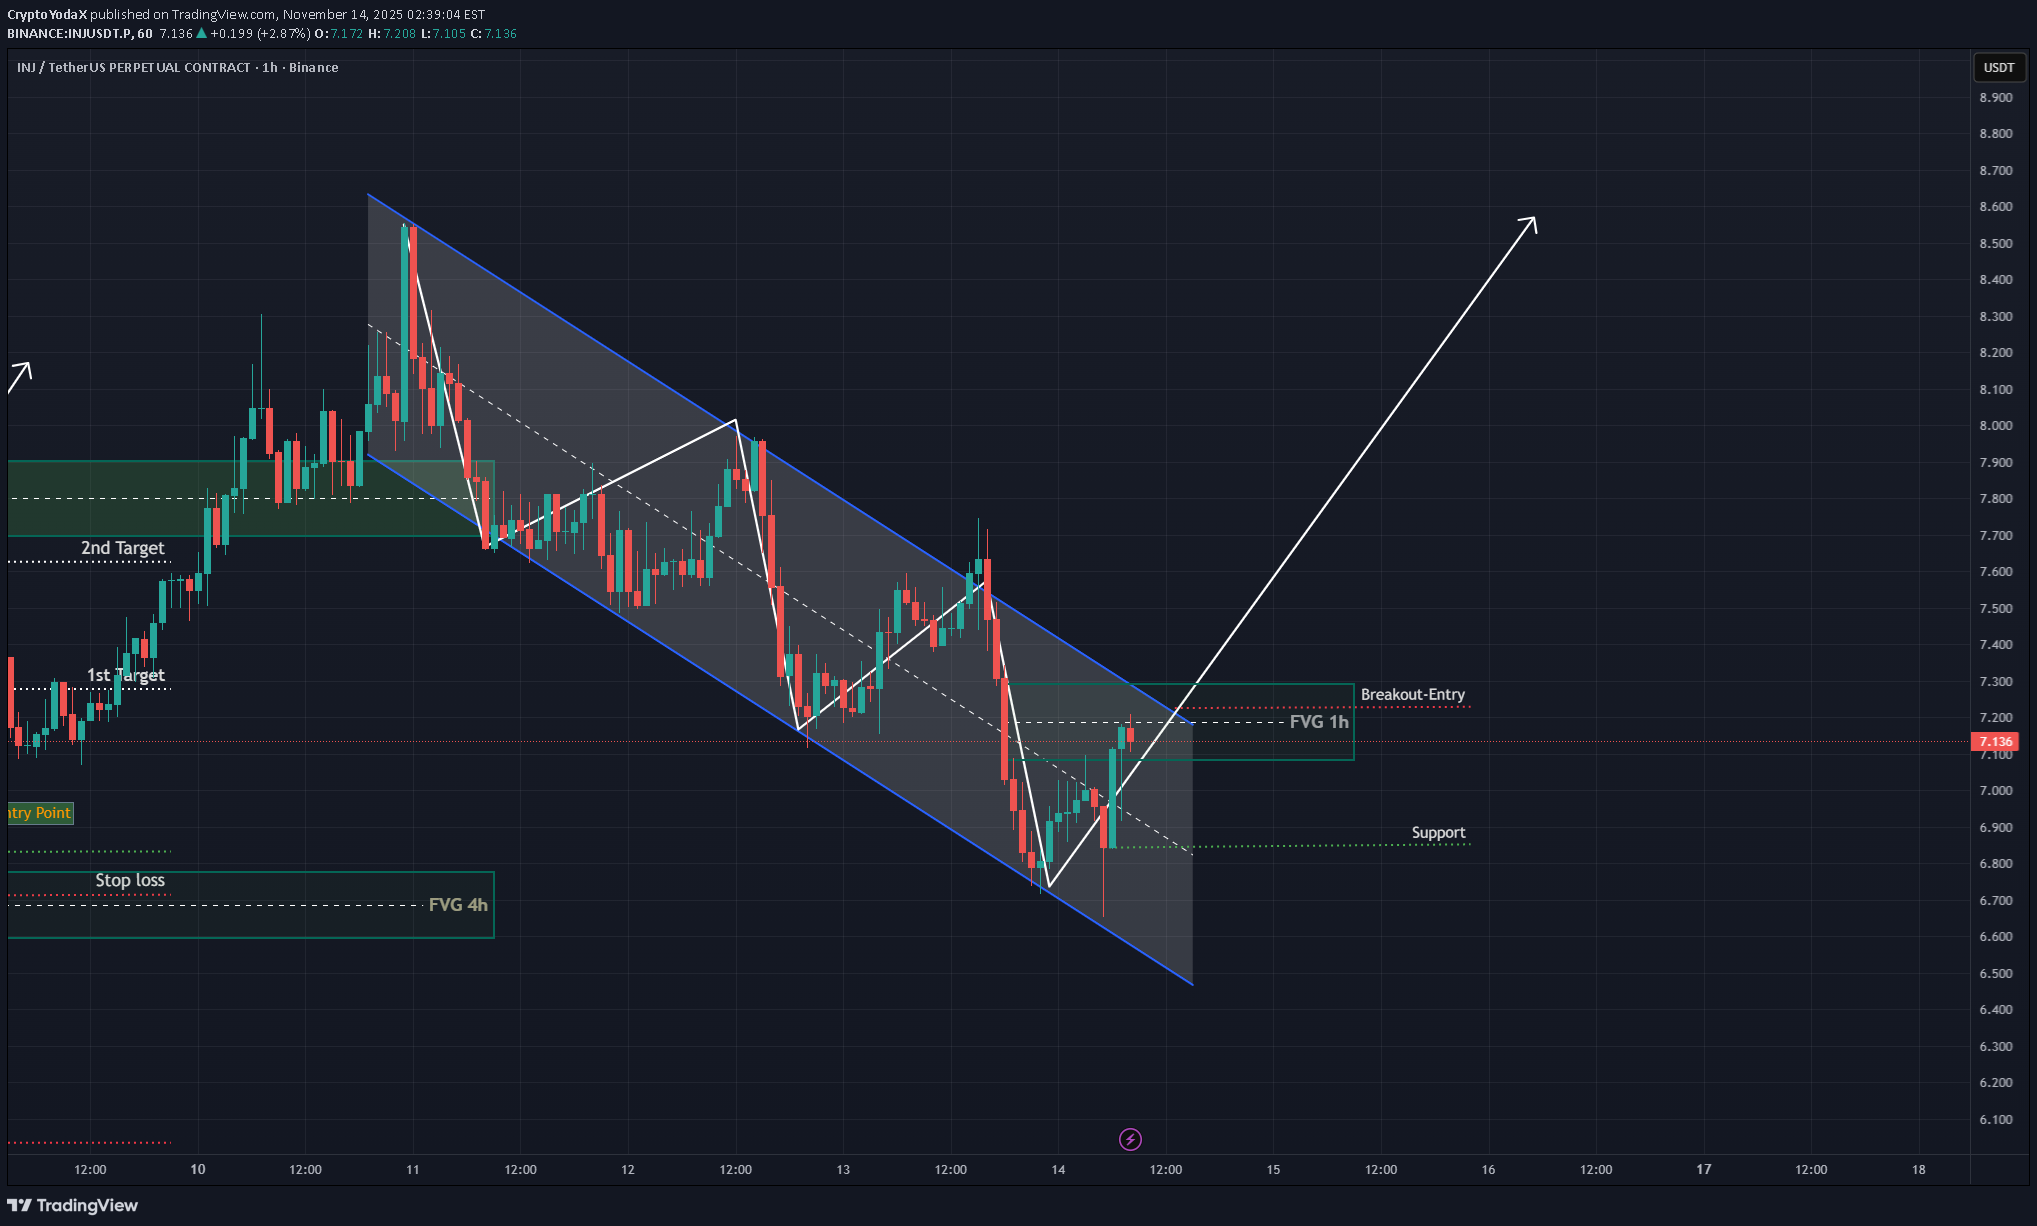
INJ 1H – No Bullish Breakout Yet INJ is still trading inside the descending channel, which means a confirmed bullish breakout has NOT happened yet. Any long entry taken here would be counter-trend, lower probability, and comes with a weaker R:R until price breaks and holds above the channel resistance + key Fib levels. For a safer bullish setup: Wait for a clean breakout above the channel Retest + confirmation Reclaim of 0.382 / 0.5 Fib Until then, trend remains bearish, and longs are considered high-risk. #INJ #YodaXCalls #CryptoAnalysis #RiskManagement #INJUSDT

OpenYourMind1318
حمایت قوی اینجکتیو (INJ): آیا قیمت به زیر این سطح باز میگردد؟ (تحلیل نمودار 1D/1W)

STRONG SUPPORT ZONE — HIGHLY UNLIKELY TO DROP BELOW THIS LEVEL The maximum and minimum key levels are highlighted in purple and blue, respectively. If the current falling wedge / descending triangle formation plays out, the expected target area is the red zone and due to potential slippage price could "touch' purple zone as well.
Disclaimer
Any content and materials included in Sahmeto's website and official communication channels are a compilation of personal opinions and analyses and are not binding. They do not constitute any recommendation for buying, selling, entering or exiting the stock market and cryptocurrency market. Also, all news and analyses included in the website and channels are merely republished information from official and unofficial domestic and foreign sources, and it is obvious that users of the said content are responsible for following up and ensuring the authenticity and accuracy of the materials. Therefore, while disclaiming responsibility, it is declared that the responsibility for any decision-making, action, and potential profit and loss in the capital market and cryptocurrency market lies with the trader.