
OpenYourMind1318
@t_OpenYourMind1318

What symbols does the trader recommend buying?
Purchase History
پیام های تریدر
Filter
OpenYourMind1318
ساختار دورهای بیت کوین: راز سقفهای قیمتی و پیشبینی هدف ۳۶۱ هزار دلاری!
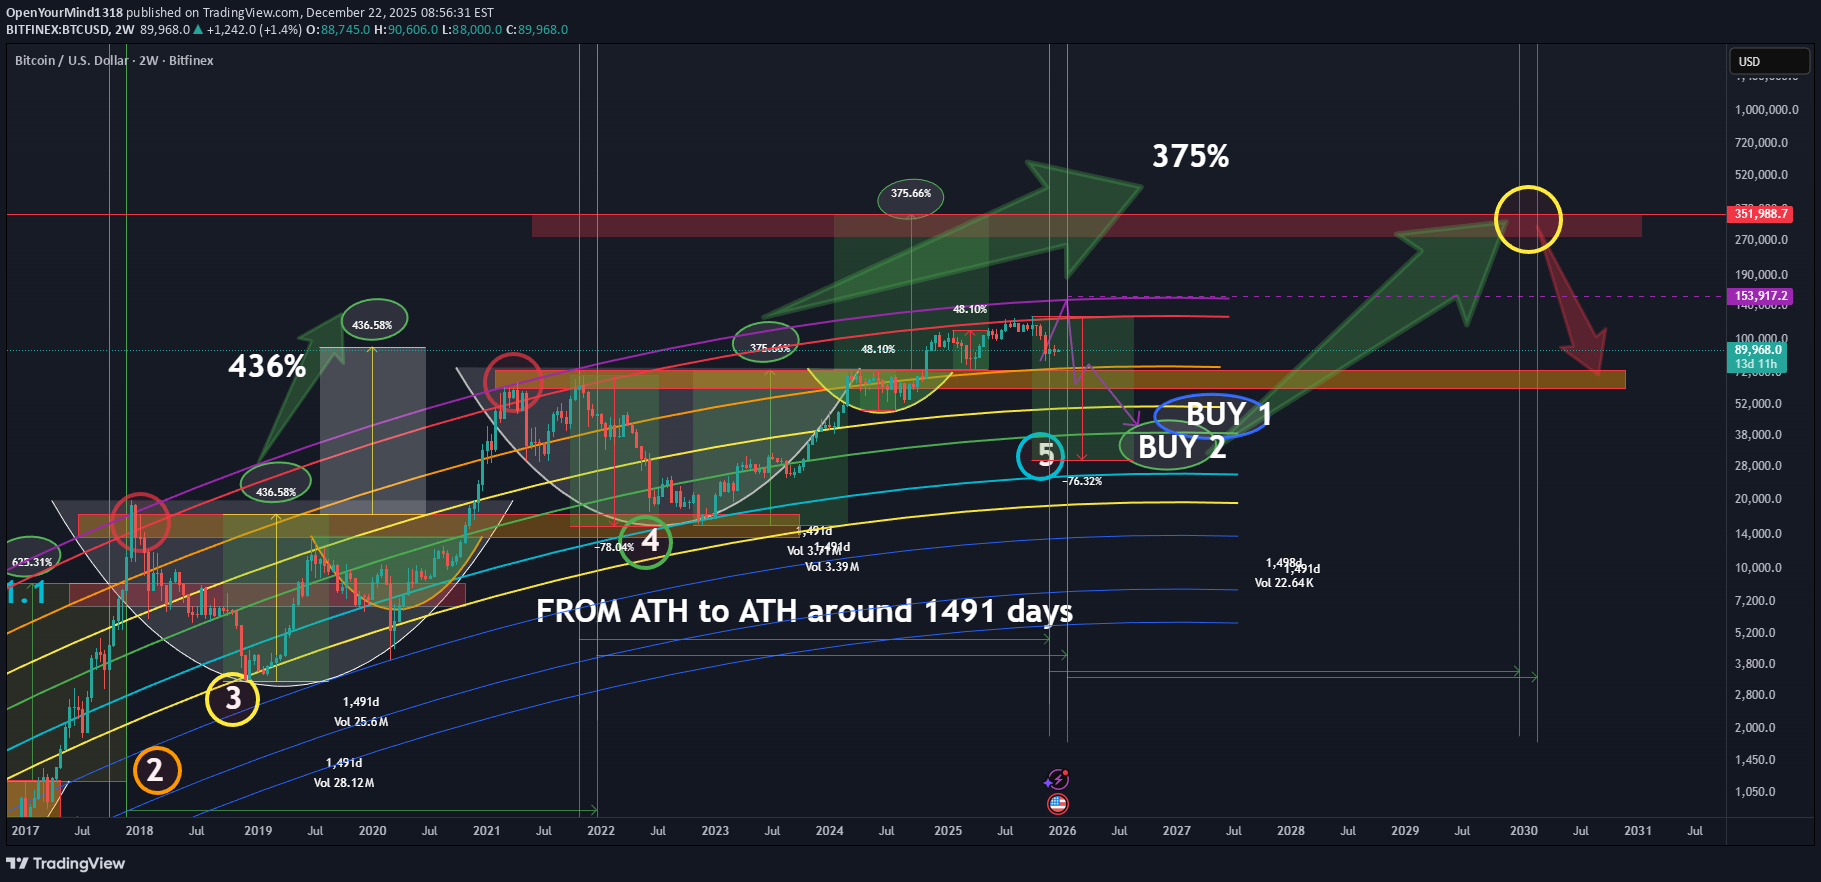
If you look at Bitcoin from the very first cycles - you will see that the behavior is surprisingly consistent Every time price reaches the area between the red and purple arcs - it has historically marked a cycle top. After that we always saw a brutal correction — roughly 80% drawdown. No exceptions so far Another interesting detail: the time from one ATH to the next ATH has been very similar each cycle, around 1,491 days. After each major bottom price didn’t just bounce — it built a cup-shaped structure, slowly accumulating before the next expansion At the same time every cycle produced higher lows almost like steps going up (levels 1–5) So! If we get a deep correction - the next major bottom could land around $29k–$39k If the correction is less severe - support shifts higher to $39k–$51k Additionally, price may first return to the previous ATH - similar to what was in 2021, potentially pushing slightly above it. This would be consistent with historical behavior, where prior ATH are often reclaimed or marginally exceeded before a larger macro pullback unfolds. If the current cup plays out the same way it did in previous cycles, the measured move points to a potential Bitcoin price around $361k at the next ATH No indicators, no hype — just repeating structure, time symmetry and proportional moves that Bitcoin has respected for years
OpenYourMind1318
SUI SUIUSD SUIUSDT 3D-1W TF

We observe a global ascending channel with clearly defined buy and sell zones where the sell zones on the chart are marked sequentially as 1, 2, 3, and 4. In addition, there is a secondary descending channel, which indicates that the current price is located within an area of global (long-term) accumulation. At these levels it is already reasonable to start building a position, while keeping in mind that the price may still be pushed lower. If further downside occurs it will represent an even better opportunity for accumulation. If the price does not go lower - the current entries remain justified. In the event of a continuation within the descending channel and a confirmed breakout and consolidation above the red zone, a price move toward the maximum target in the purple zone. All possible scenarios are illustrated on the chart.
OpenYourMind1318
ETHENA ENA ENAUSD 3D-1W TF
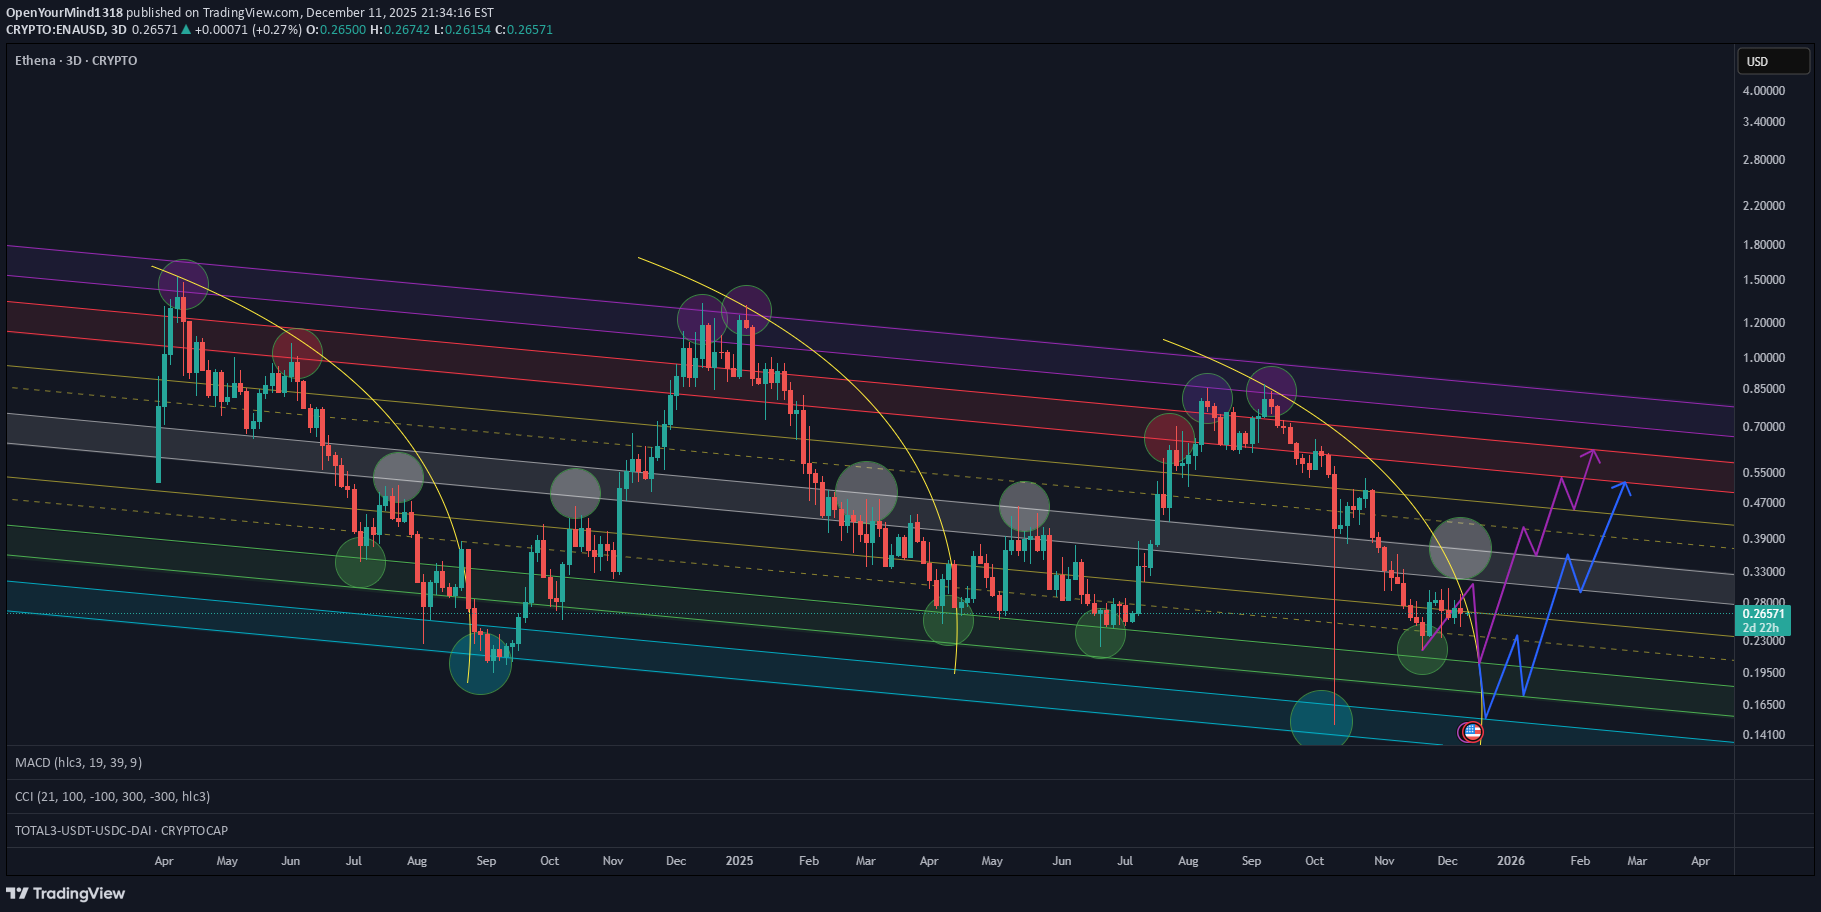
This coin can clearly be considered a pump-and-dump asset as it consistently falls to the accumulation zone and then rapidly goes upward. However! it’s important to keep in mind that exchanges tend to train traders to expect a specific pattern. Once the majority notices it and starts buying aggressively in the accumulation zone again the coin may simply be dumped and scammed leaving traders with nothing
OpenYourMind1318
POLKADOT DOT DOTUSD 1W TF
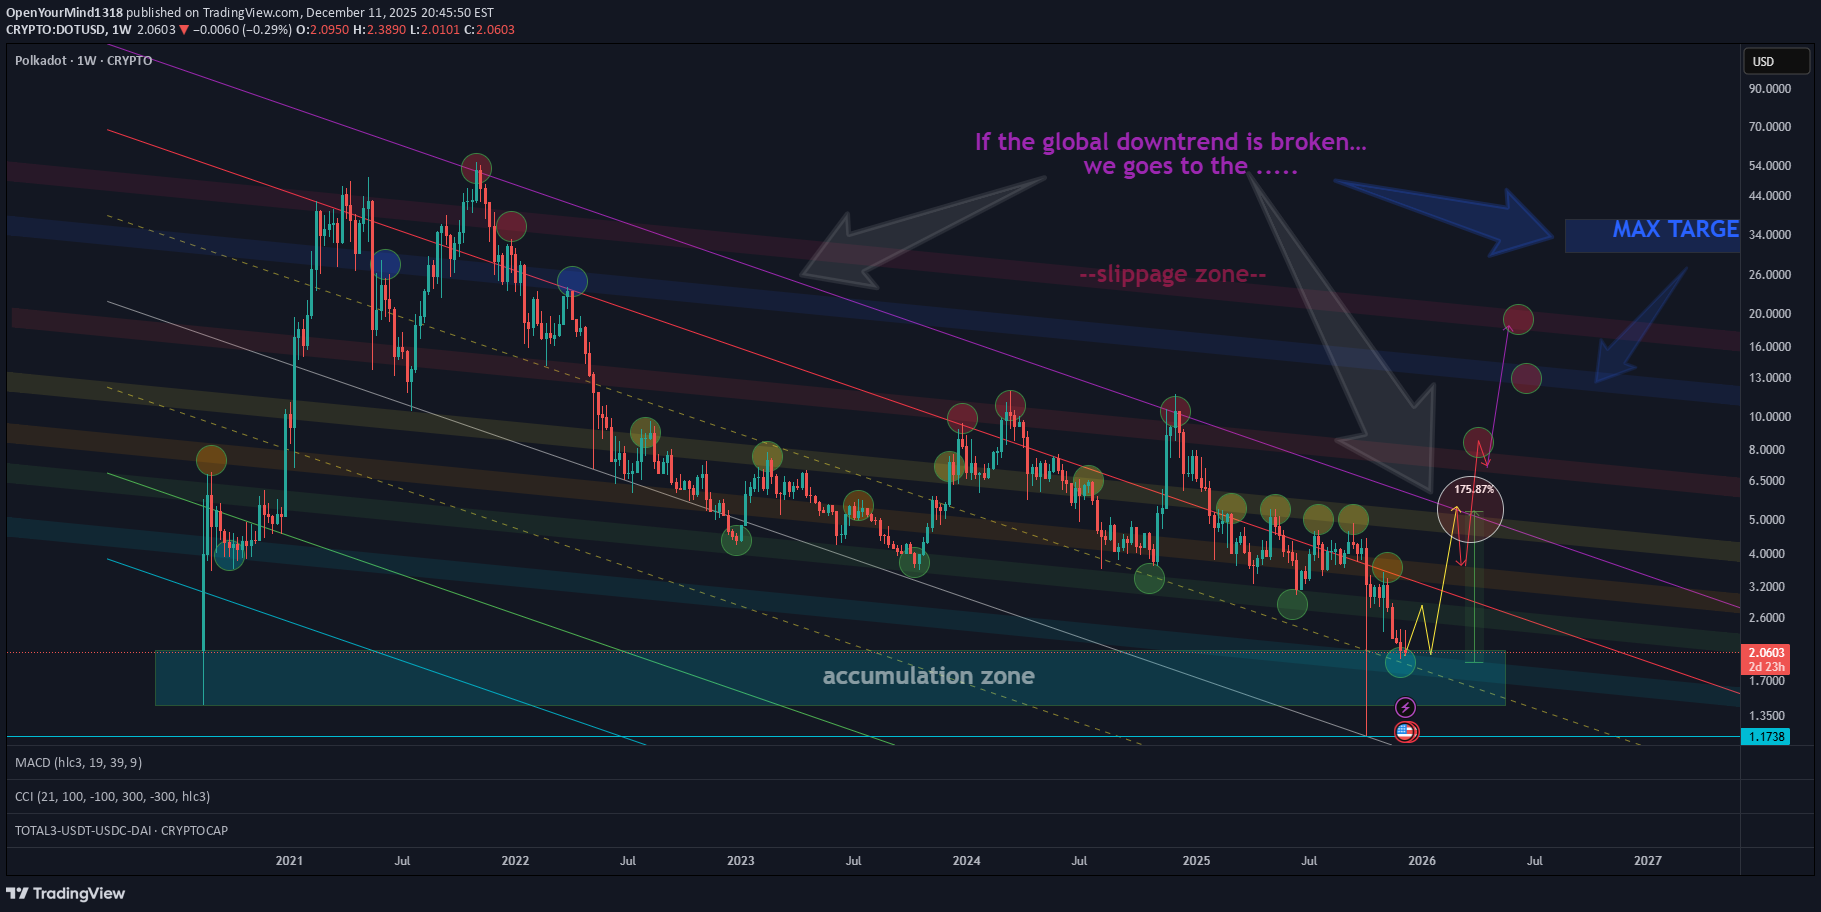
The chart shows support and resistance levels as well as the targets up to the global descending channel. If the global downtrend is broken - the maximum target is the blue zone. The red zone represents a short-squeeze area originating from the blue zone — which may or may not occur and the squeeze could also happen earlier. At the moment we are in the accumulation zone of the asset.
OpenYourMind1318
آربیتروم (ARB): آیا این الگوی تکراری نشاندهنده کلاهبرداری است؟ سقوط ۵۳ درصدی در راه است؟

Layer 2 scaling solution for Ethereum... The coin is moving in a very interesting way — you can clearly see a consistent percentage drop followed by a precise percentage rebound and this pattern keeps repeating every time, almost like a pre-written script. From the very beginning, the coin has been moving inside a global descending channel. Right now the coin is trying to repeat the same move that has already happened twice and if it repeats for the third time the outlook for this coin is not encouraging — we could drop another -53%, and it may even turn into a scam, because considering such a coin for investment would be madness. If in the end the coin finally turns bullish and breaks out of the global descending channel I wouldn’t set any targets higher than the ones marked on the chart
OpenYourMind1318
تحلیل تکنیکال آوالانچ (AVAX): دو سناریوی اصلی صعودی و نزولی در دید کوتاه مدت

Right now I see two possible scenarios: Bullish scenario: We hold the current zone and start reversing toward the purple zone (the resistance of the descending channel). From there we will see how the price reacts — if it breaks above this level, the next targets will begin to play out. Bearish scenario: If the current zone does not hold, the price may retest the green channel and possibly even the blue zone. In any case these are global targets and for now the price action is expected to develop within this broader range.
OpenYourMind1318
حمایت قوی اینجکتیو (INJ): آیا قیمت به زیر این سطح باز میگردد؟ (تحلیل نمودار 1D/1W)

STRONG SUPPORT ZONE — HIGHLY UNLIKELY TO DROP BELOW THIS LEVEL The maximum and minimum key levels are highlighted in purple and blue, respectively. If the current falling wedge / descending triangle formation plays out, the expected target area is the red zone and due to potential slippage price could "touch' purple zone as well.
OpenYourMind1318
تحلیل فنی C98: ورود به منطقه اشباع فروش و شانس صعود بزرگ!

At the moment the price is moving within a descending channel and all targets and potential reactions are marked inside this structure. The coin is currently in the oversold zone according to the CCI indicator, "0 level" acts like a magnet pulling price back ftom -300 or +300 doesnt matter. Around –300 marks the maximum oversold level. Around +300 marks the max overbought zone. You can clearly see where we stand right now — deep in oversold territory (-200 on the daily TF) If (or when) the price breaks above the channel - the MAX TARGET is already indicated on the chart.
OpenYourMind1318
پیشبینی شوکهکننده از آینده GMT/STEPN: آیا اصلاح بزرگ در راه است؟ (تحلیل تکنیکال هفتگی)

Not sure about others, but personally I really like CCI indicator. Looking at its historical performance especially on the weekly timeframe it has proven to be extremely precise in signaling key market reversals and momentum shifts. Currently, we can see a triangle pattern forming on the chart. If this triangle plays out as expected - targets are marked on the chart and I’d dare to assume those could represent the final highs before a major correction or potential “scam phase”
OpenYourMind1318
تحلیل تکنیکال لینک (LINK): کانال صعودی و نقطه طلایی ورود به خرید!
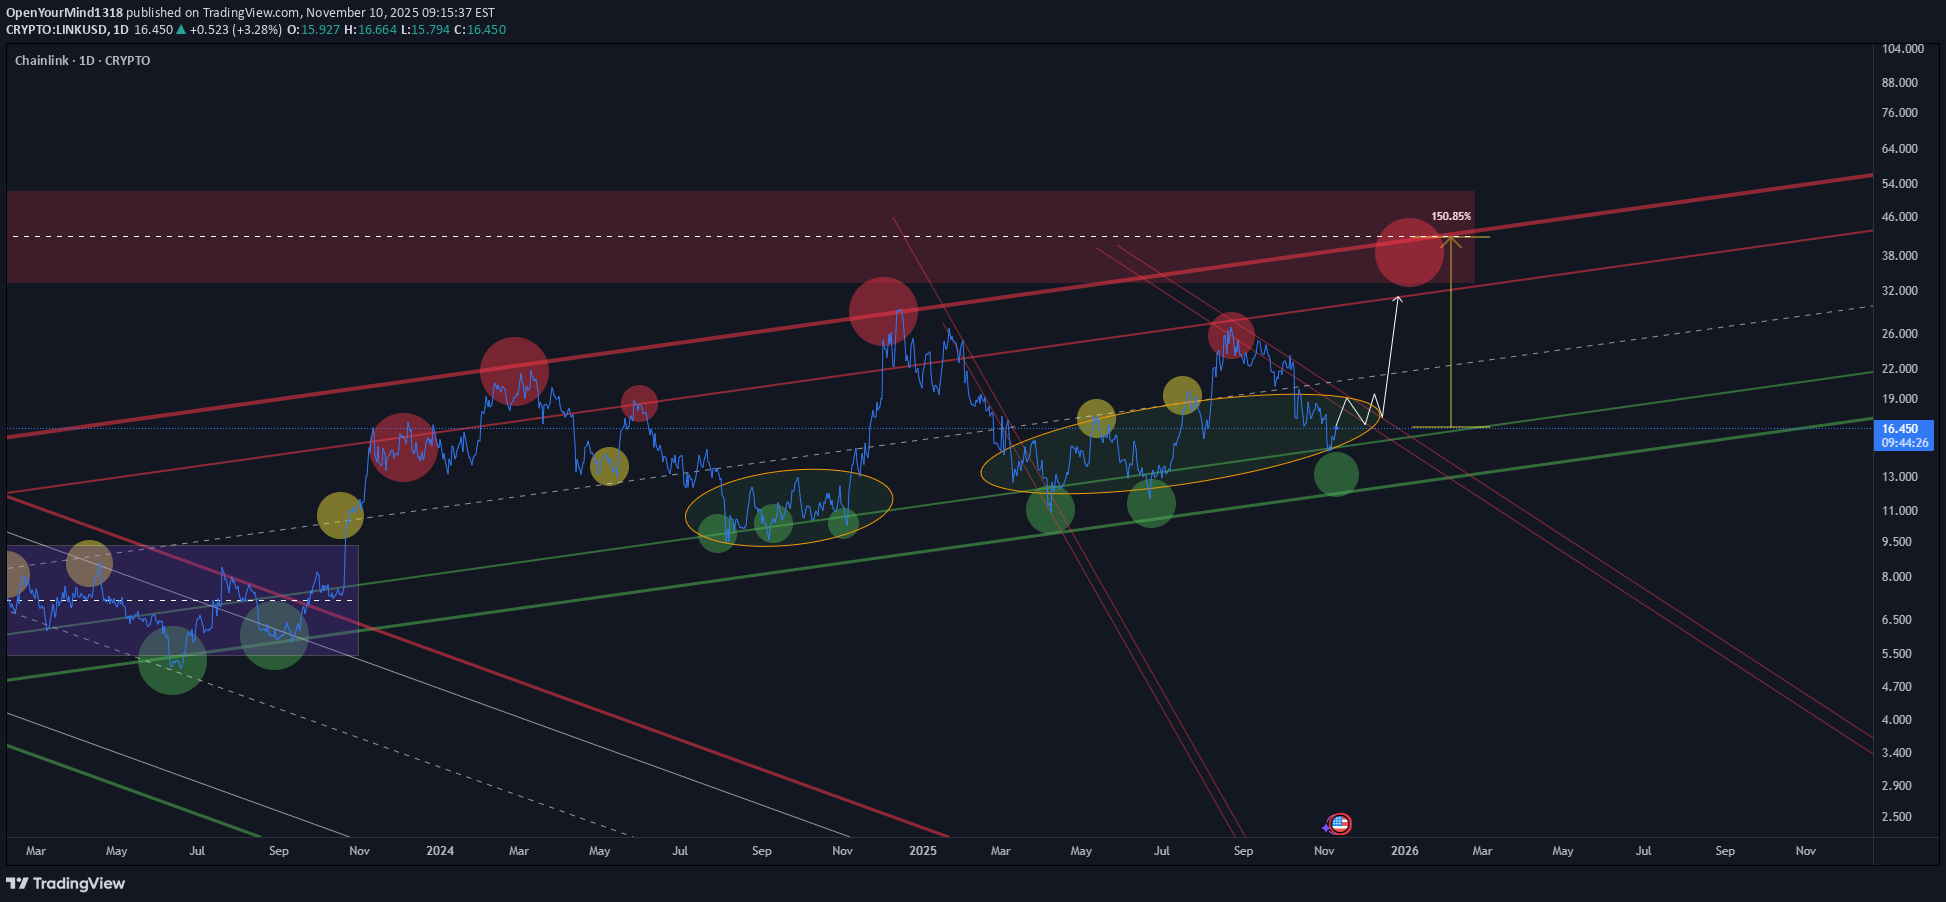
After the end of the bear trend, price started forming a clean ascending channel. The midline of the channel (dashed zone) marks a phase of uncertainty, often leading to shakeouts or temporary consolidations. Area between the white dashed and green line can be viewed as a position-building zone, where smart money accumulates before a short-term or long-term upward move (ellipses). Once the price breaks and confirms above this range, the probability of a move toward the upper boundary of the channel increases significantly.
Disclaimer
Any content and materials included in Sahmeto's website and official communication channels are a compilation of personal opinions and analyses and are not binding. They do not constitute any recommendation for buying, selling, entering or exiting the stock market and cryptocurrency market. Also, all news and analyses included in the website and channels are merely republished information from official and unofficial domestic and foreign sources, and it is obvious that users of the said content are responsible for following up and ensuring the authenticity and accuracy of the materials. Therefore, while disclaiming responsibility, it is declared that the responsibility for any decision-making, action, and potential profit and loss in the capital market and cryptocurrency market lies with the trader.