
CryptoYodaX
@t_CryptoYodaX

What symbols does the trader recommend buying?
Purchase History
پیام های تریدر
Filter
CryptoYodaX
تحلیل تکنیکال BNB: آیا پامپ هیجانانگیز به سوی ۹۴۰ دلار در راه است؟
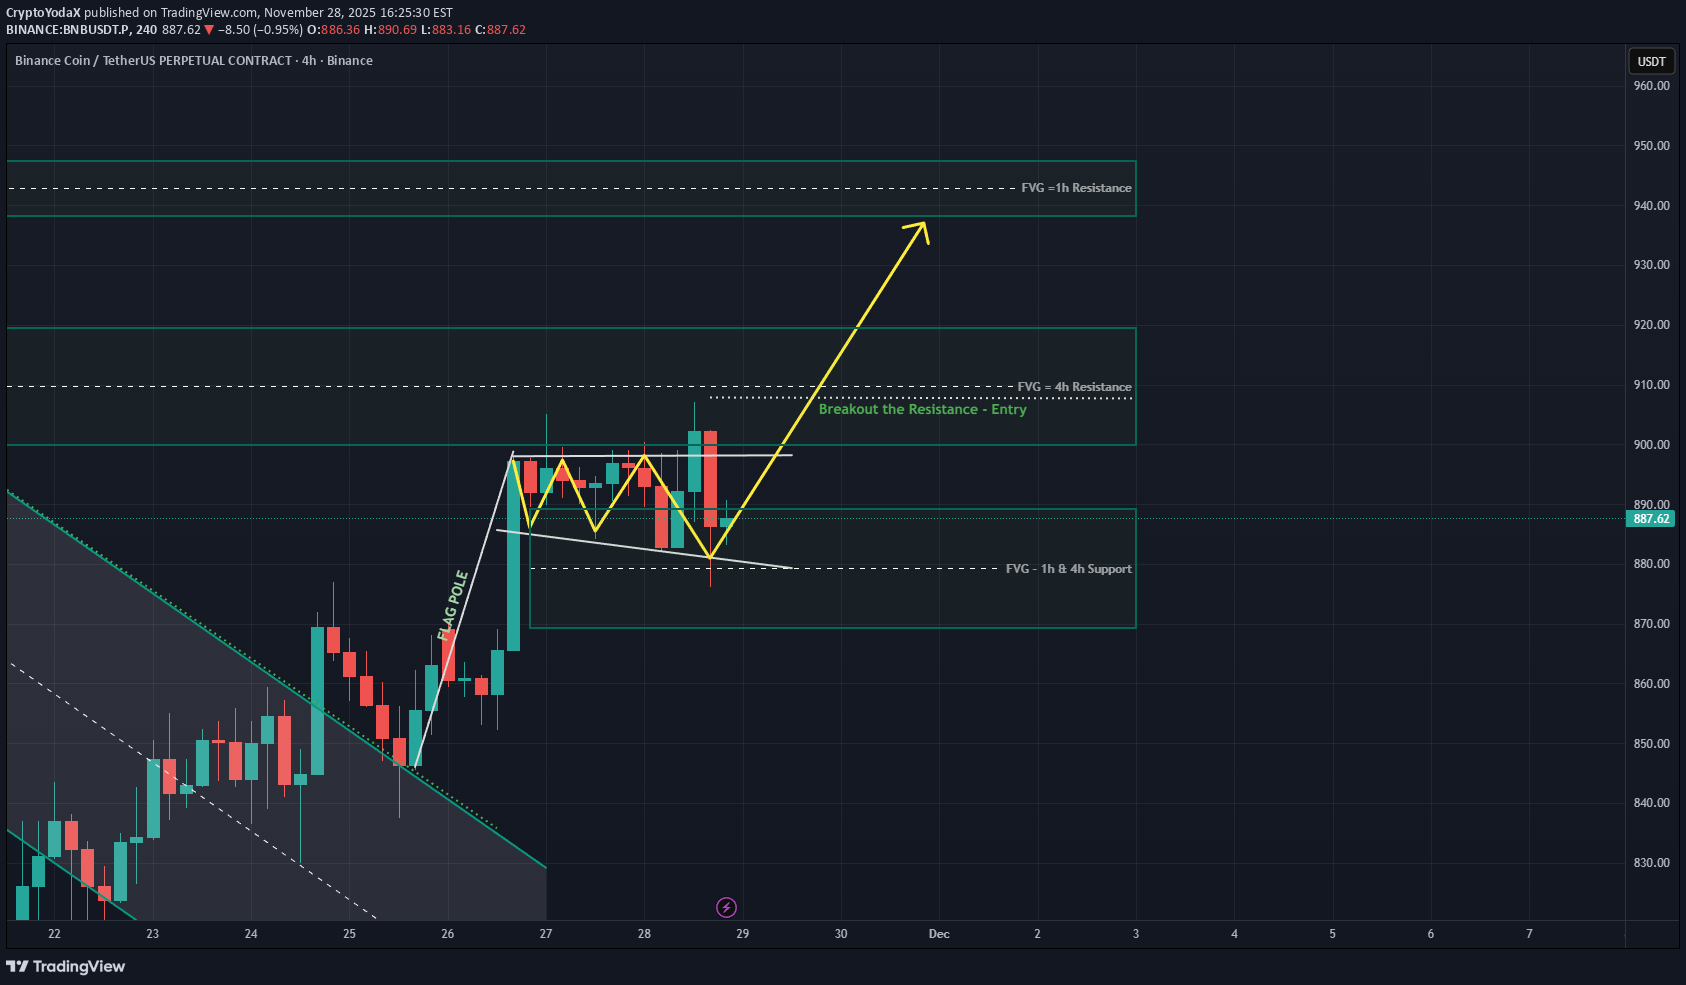
BNB 4H Rejected on the first breakout attempt, but structure is still on bullish flag. Price is retesting the breakout zone + FVG support. A strong bounce here could send BNB toward the next FVG resistance levels at $910-$940. Pattern still valid as long as support holds. Let’s see if #BNB delivers.
CryptoYodaX
CryptoYodaX
تحلیل فوری زِکش (ZEC): سقوط به کدام سطح؟ پیشبینی کاهش قیمت تا ۱۸۰ دلار!
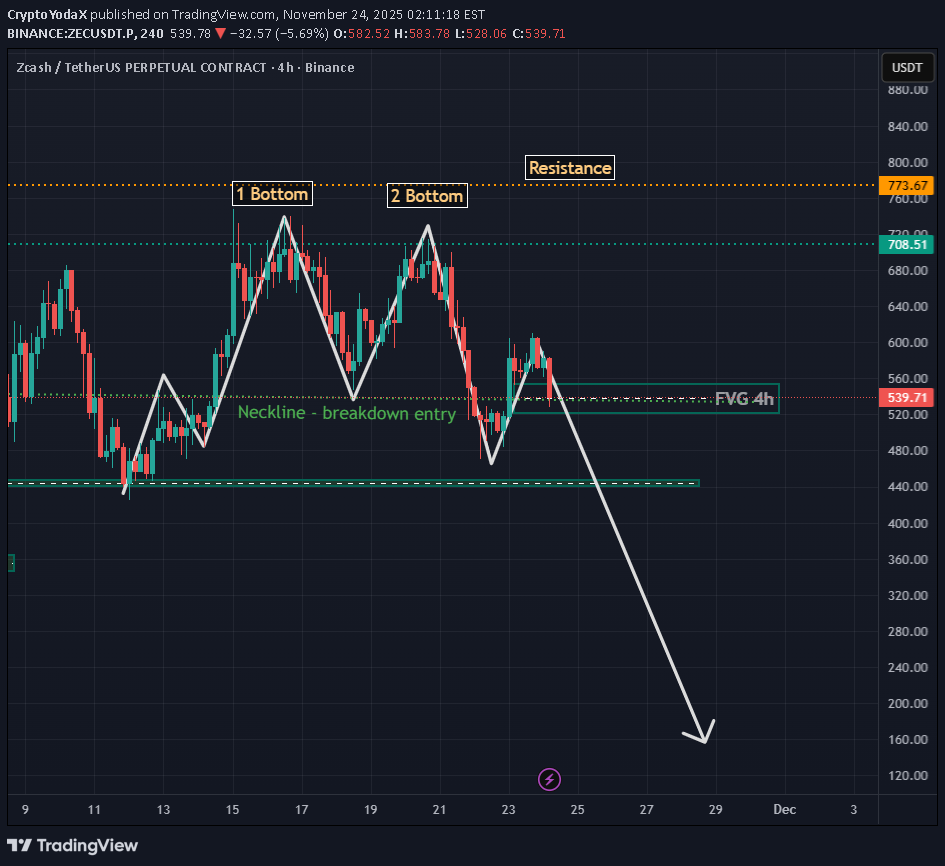
ZECUSDT.P 4H Analysis Price rejected hard from the major resistance zone and continues to print lower highs. Failure to reclaim the $580–$600 area keeps momentum bearish. Multiple FVGs below remain unfilled, opening the path toward the $200–$180 region. #Zcash #YodaXCallsTarget hit. Clean +10% move delivered straight from the breakdown setup. Now waiting for the next structure shift.
CryptoYodaX
ماهی قلابی فیِلکوین: آیا وقت خرید $FIL برای رسیدن به ۳.۵۹ دلار است؟

Clean setup on FILUSDT.P 4H. The chart is forming a clear Fish Hook Pattern after a prolonged bleed, with a reclaim of the breakout level setting up T1–T3 targets. If everything goes well, the final target could be $3.59. If momentum holds, this recovery structure has room to extend. $Filecoin #FIL #YodaXCalls
CryptoYodaX
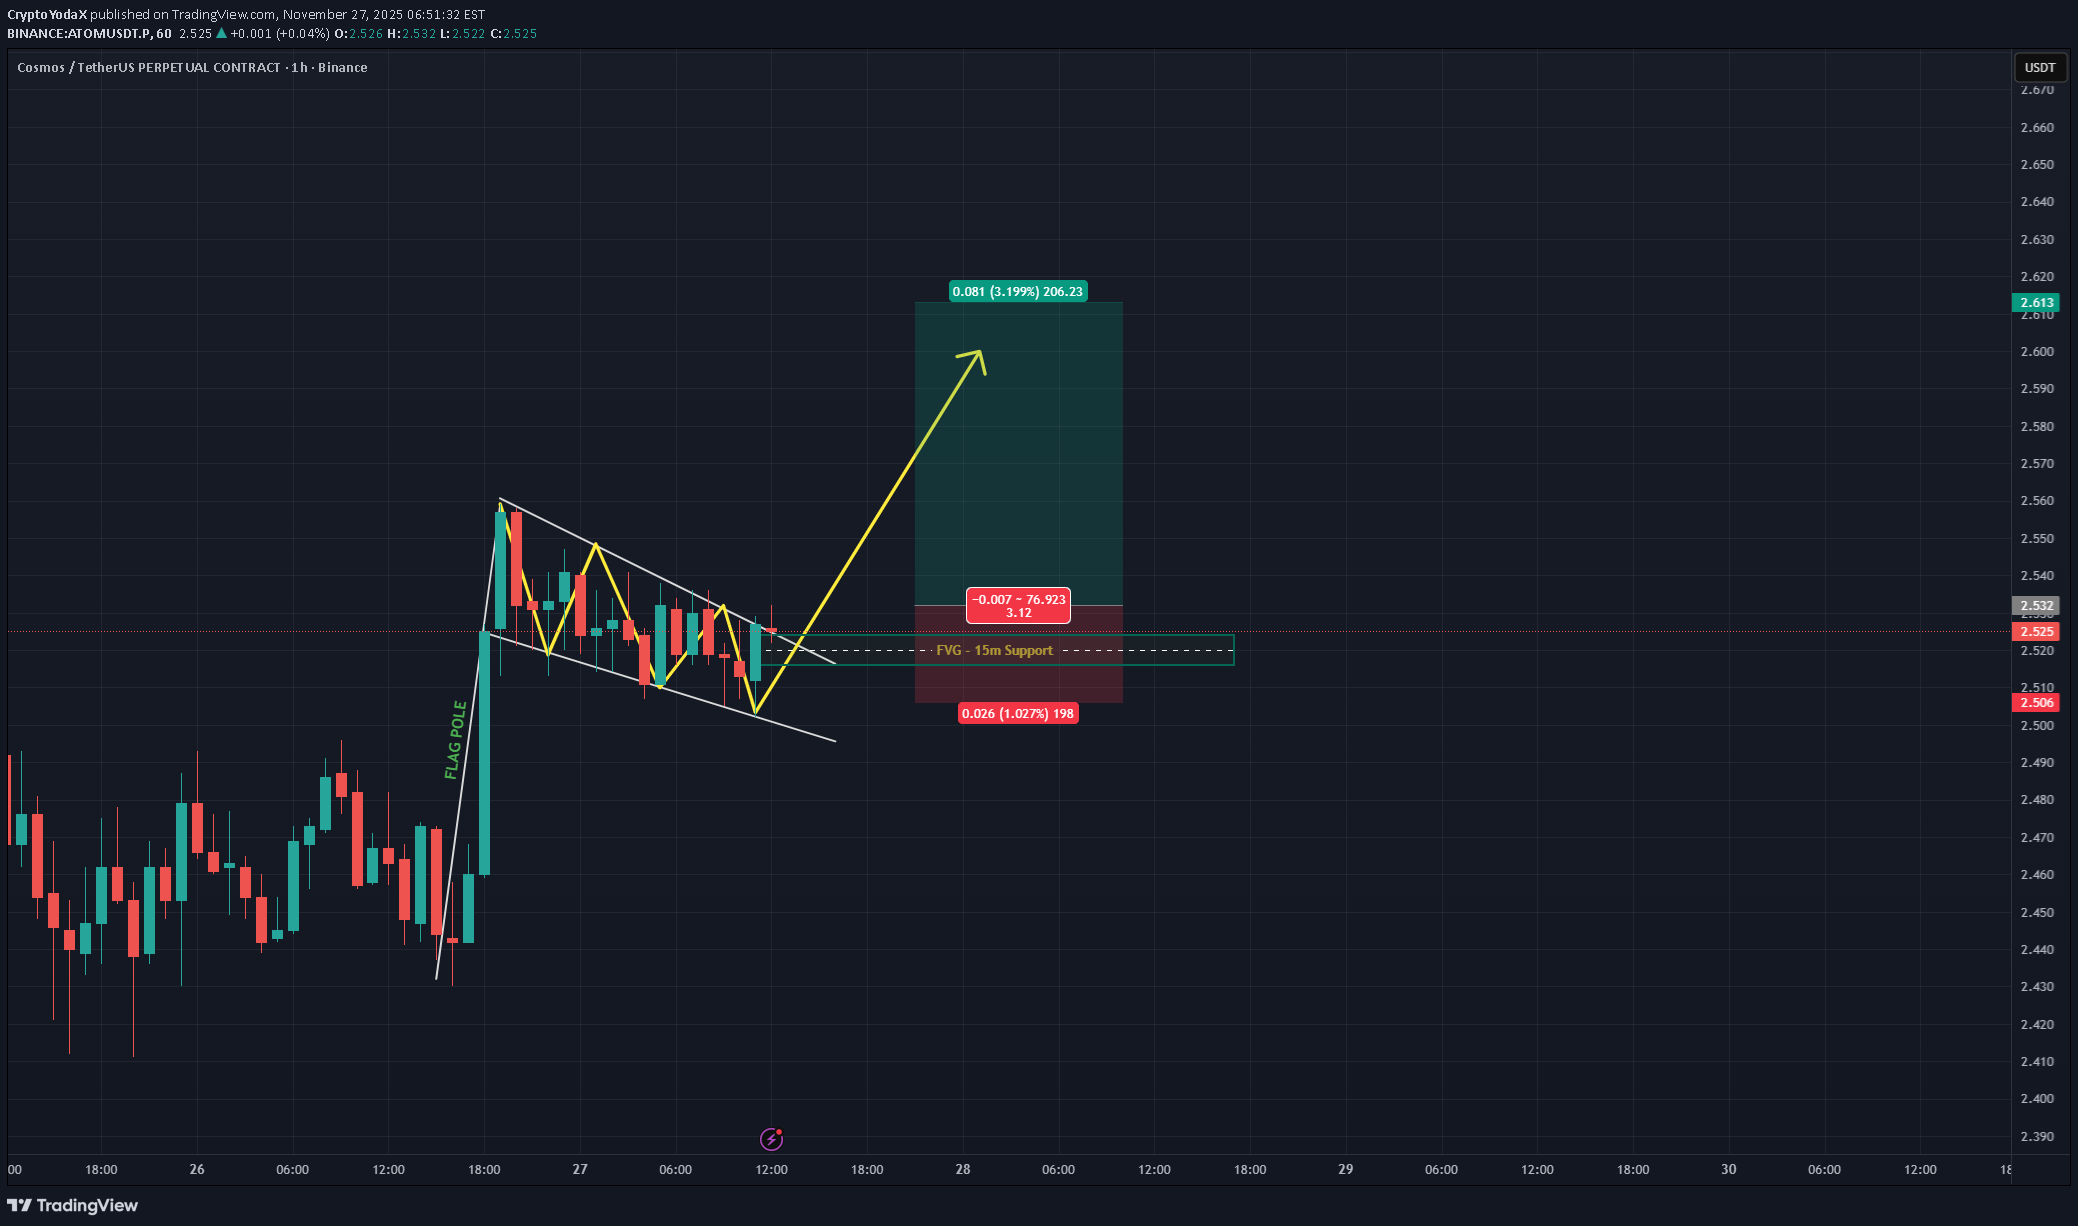
سیگنال انفجاری ATOM: آیا وقت خرید این ارز است؟ (اهداف ۳.۲ دلاری)
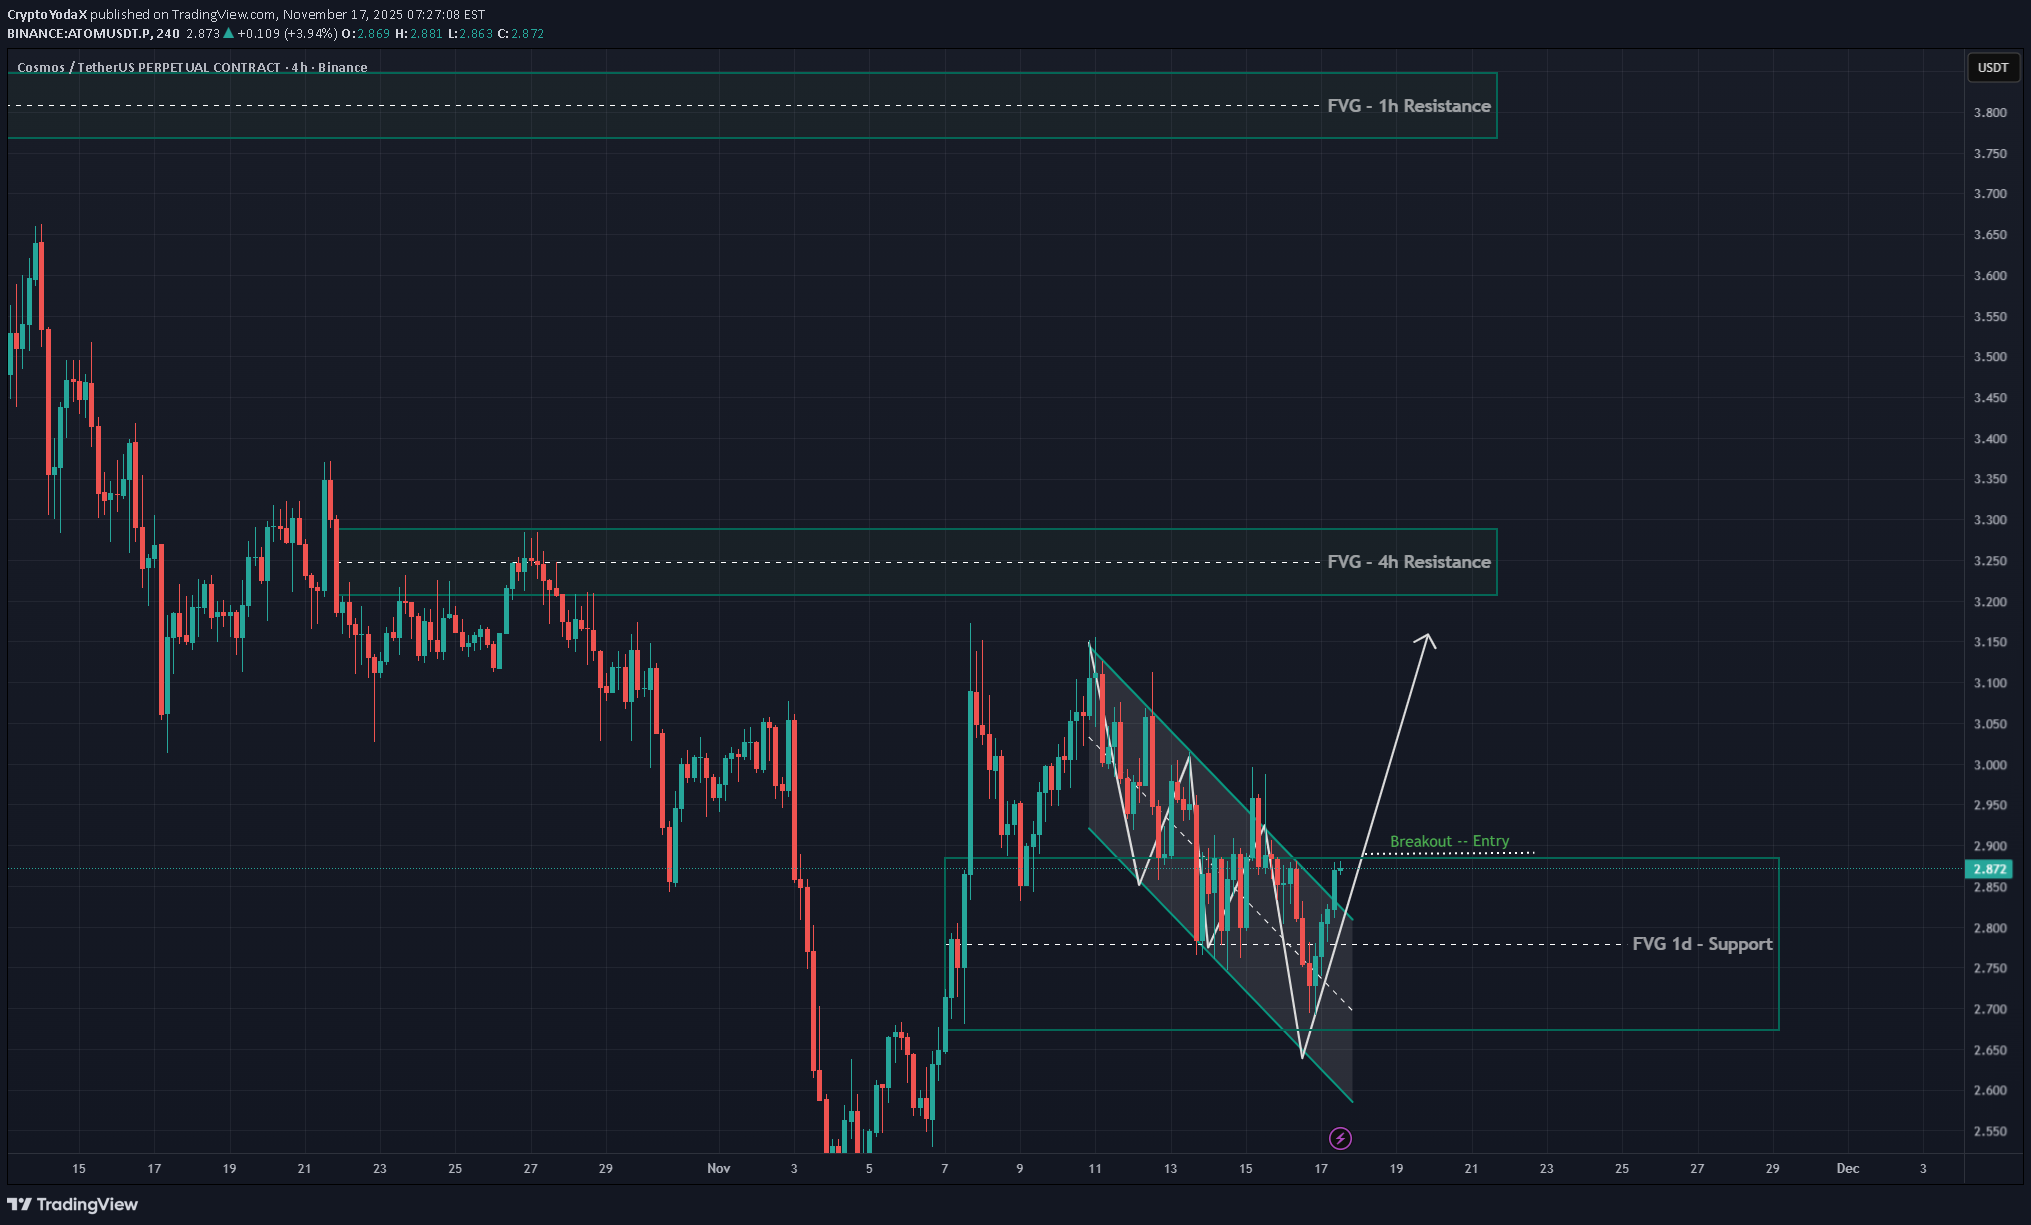
ATOM on 4H is giving the first signals of a bullish reversal, breaking the framework of a Falling Channel and reacting strongly from the strong FVG 1D Support area $2.88. With confirmation above the channel & breakout of FVG 1D $2.89, the nearest targets are $3.2–$3.25. #ATOM #YodaXCallsTarget hit. Clean +8% move delivered straight from the breakout setup.
CryptoYodaX
ZK 1h Double Top
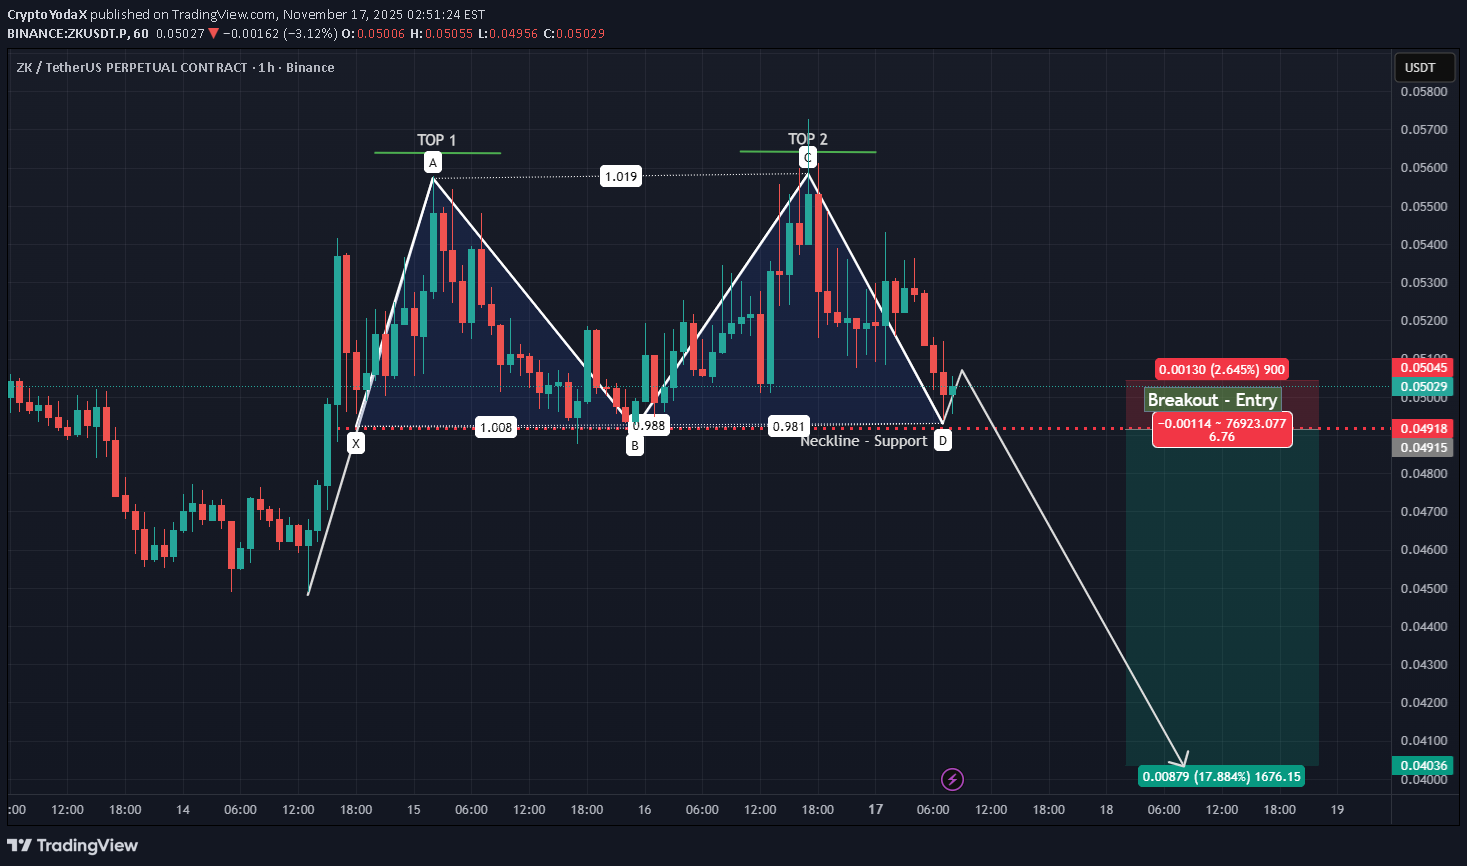
ZKUSDT.P 1H Clear Double Top playing out. Price has tapped the same resistance twice and is now testing the neckline support at $0.049. A clean breakdown below this level confirms the pattern and opens the move toward $0.04 - 17% downside. Structure remains bearish as long as lower highs hold. DYOR & NFA $zkSync #YodaXCalls #ZK #zkSyncTarget hit. Clean +9% move delivered straight from the breakdown setup.
CryptoYodaX
الگوی فنجان و دسته در ZEC: فرصت خرید با هدف ۷۷۷ دلار!
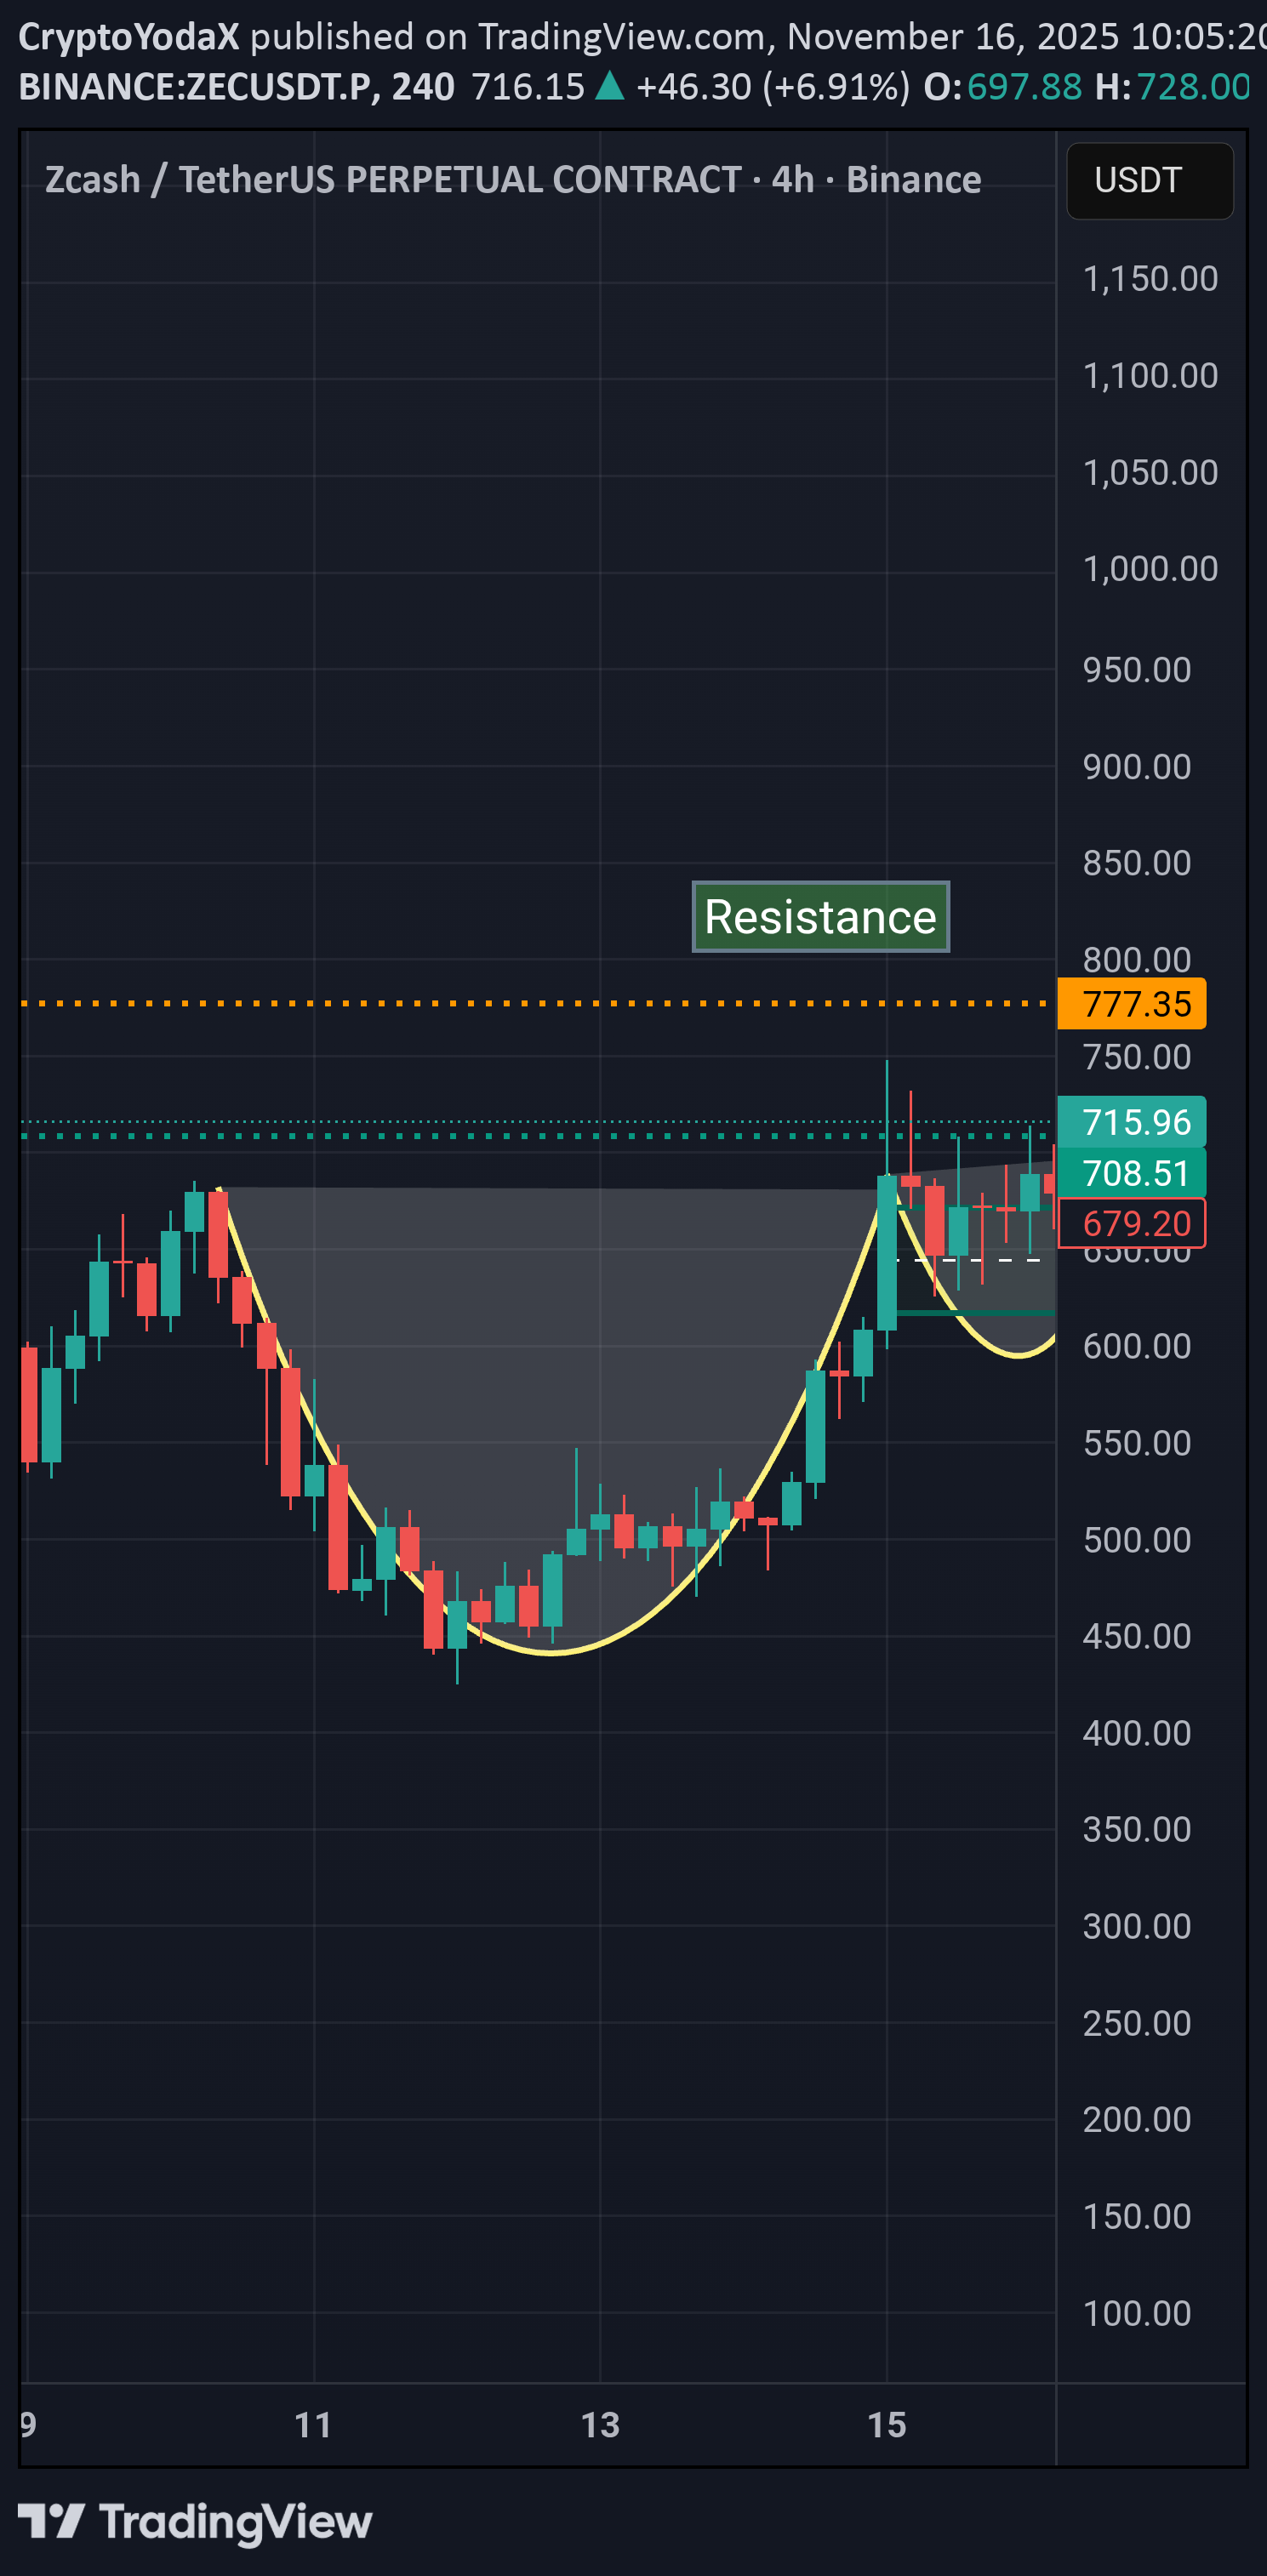
ZEC 4H Clear Cup structure forming with strong bullish momentum. Price is trying to break above $715 a clean breakout targets $777 next. Short-term support: FVG 4H at $650. Bullish structure overall. #ZCHASH #YodaXCalls
CryptoYodaX
سیگنال خرید پرریسک INJ در تایم فریم ۱ ساعته: آیا الان زمان ورود به بازار است؟
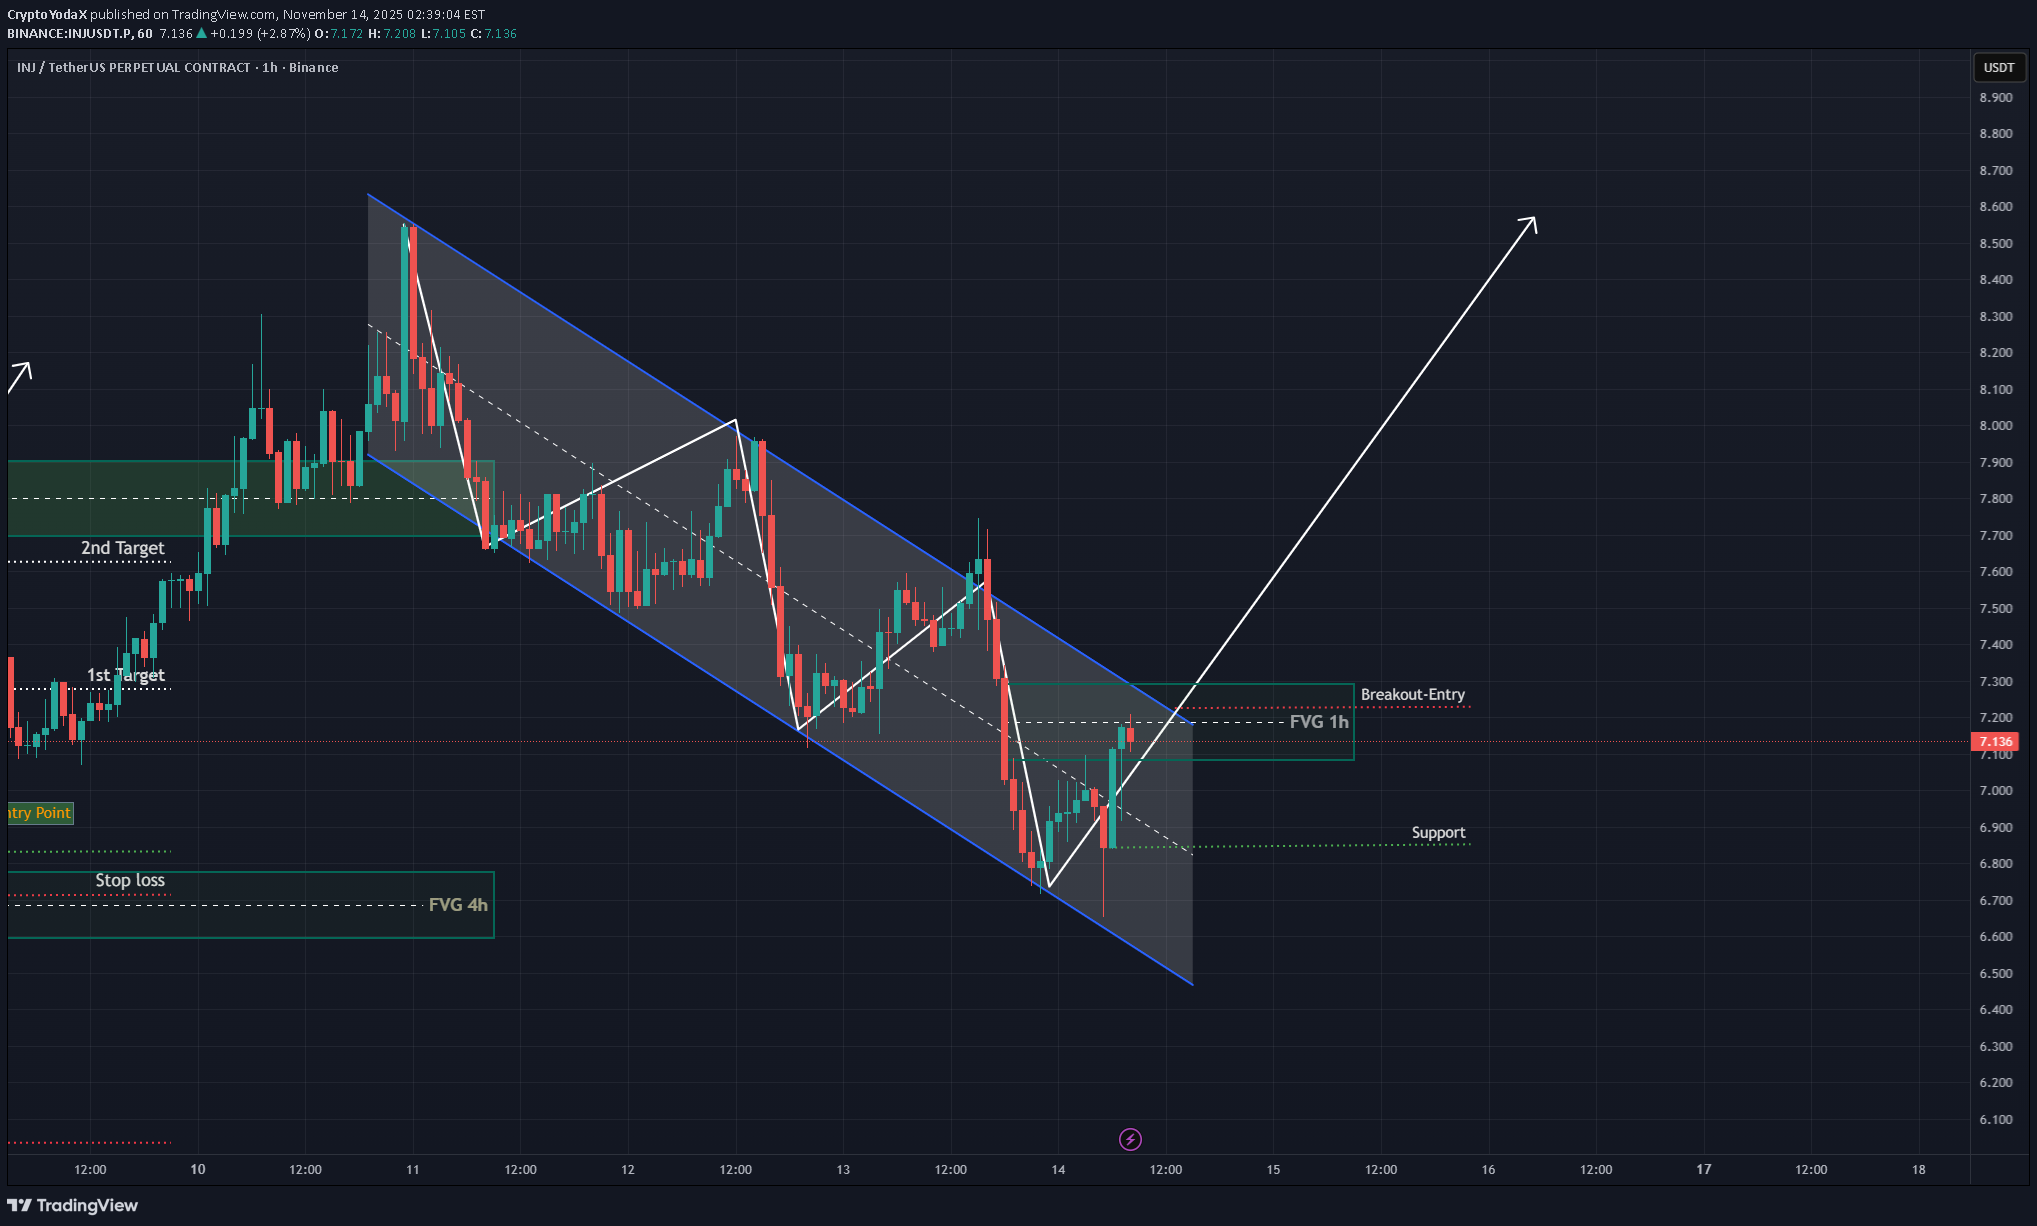
INJ 1H – No Bullish Breakout Yet INJ is still trading inside the descending channel, which means a confirmed bullish breakout has NOT happened yet. Any long entry taken here would be counter-trend, lower probability, and comes with a weaker R:R until price breaks and holds above the channel resistance + key Fib levels. For a safer bullish setup: Wait for a clean breakout above the channel Retest + confirmation Reclaim of 0.382 / 0.5 Fib Until then, trend remains bearish, and longs are considered high-risk. #INJ #YodaXCalls #CryptoAnalysis #RiskManagement #INJUSDT
CryptoYodaX
سیگنال صعودی AXS: آیا کف حمایتی ترکید؟ فرصت خرید پنهان در کانال نزولی!
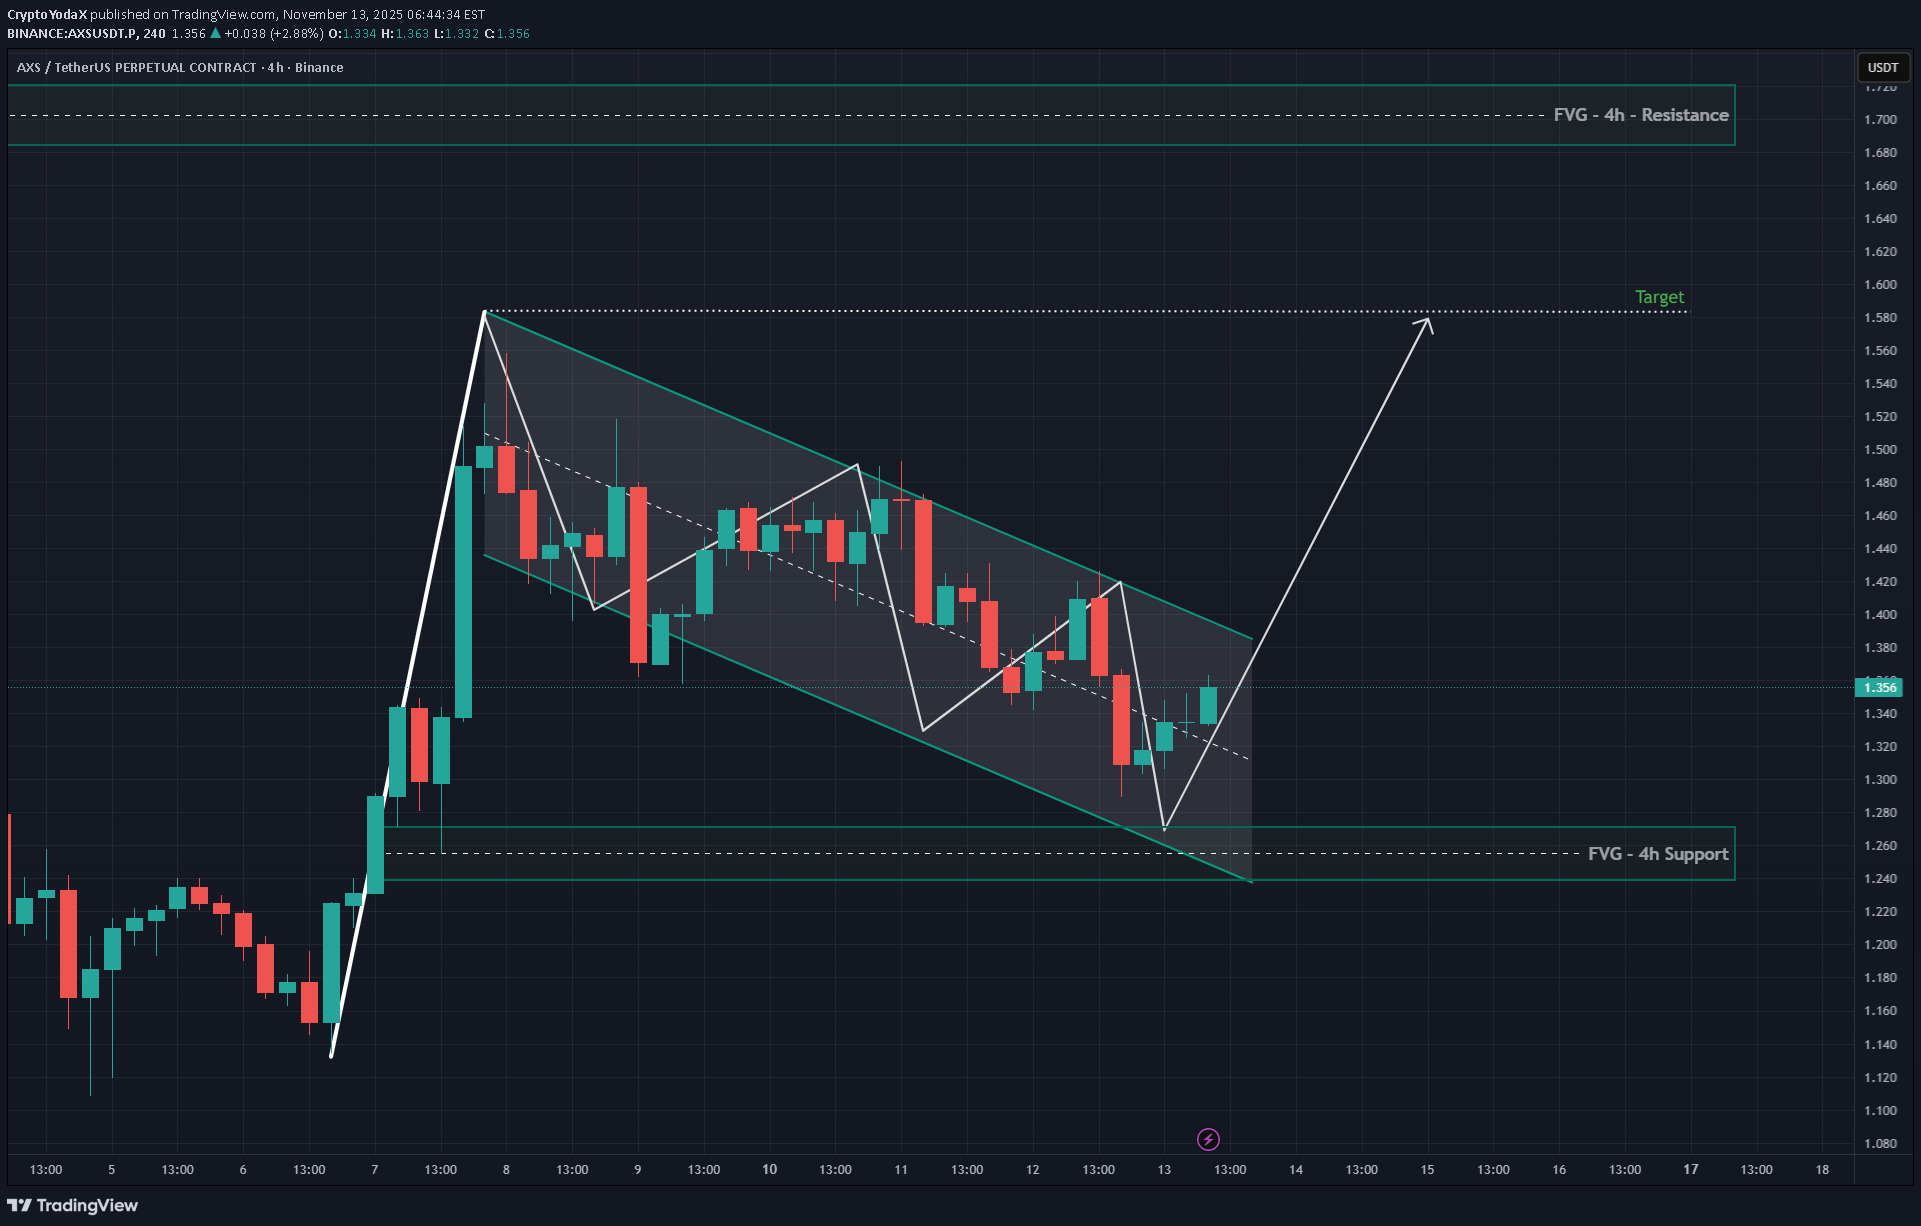
AXS 4H chart showing a falling channel structure, price just bounced perfectly from the 4h FVG support zone. A potential bullish breakout could target the $1.58 area, aligning with the upper channel and 4h resistance zone. Looks like smart money accumulation in progress. #AXSUSDT #Crypto #YodaXCalls
CryptoYodaX
اتریوم در آستانه انفجار؟ الگوی کف دوقلو و هدف جدید ۳۸۰۰ دلار!
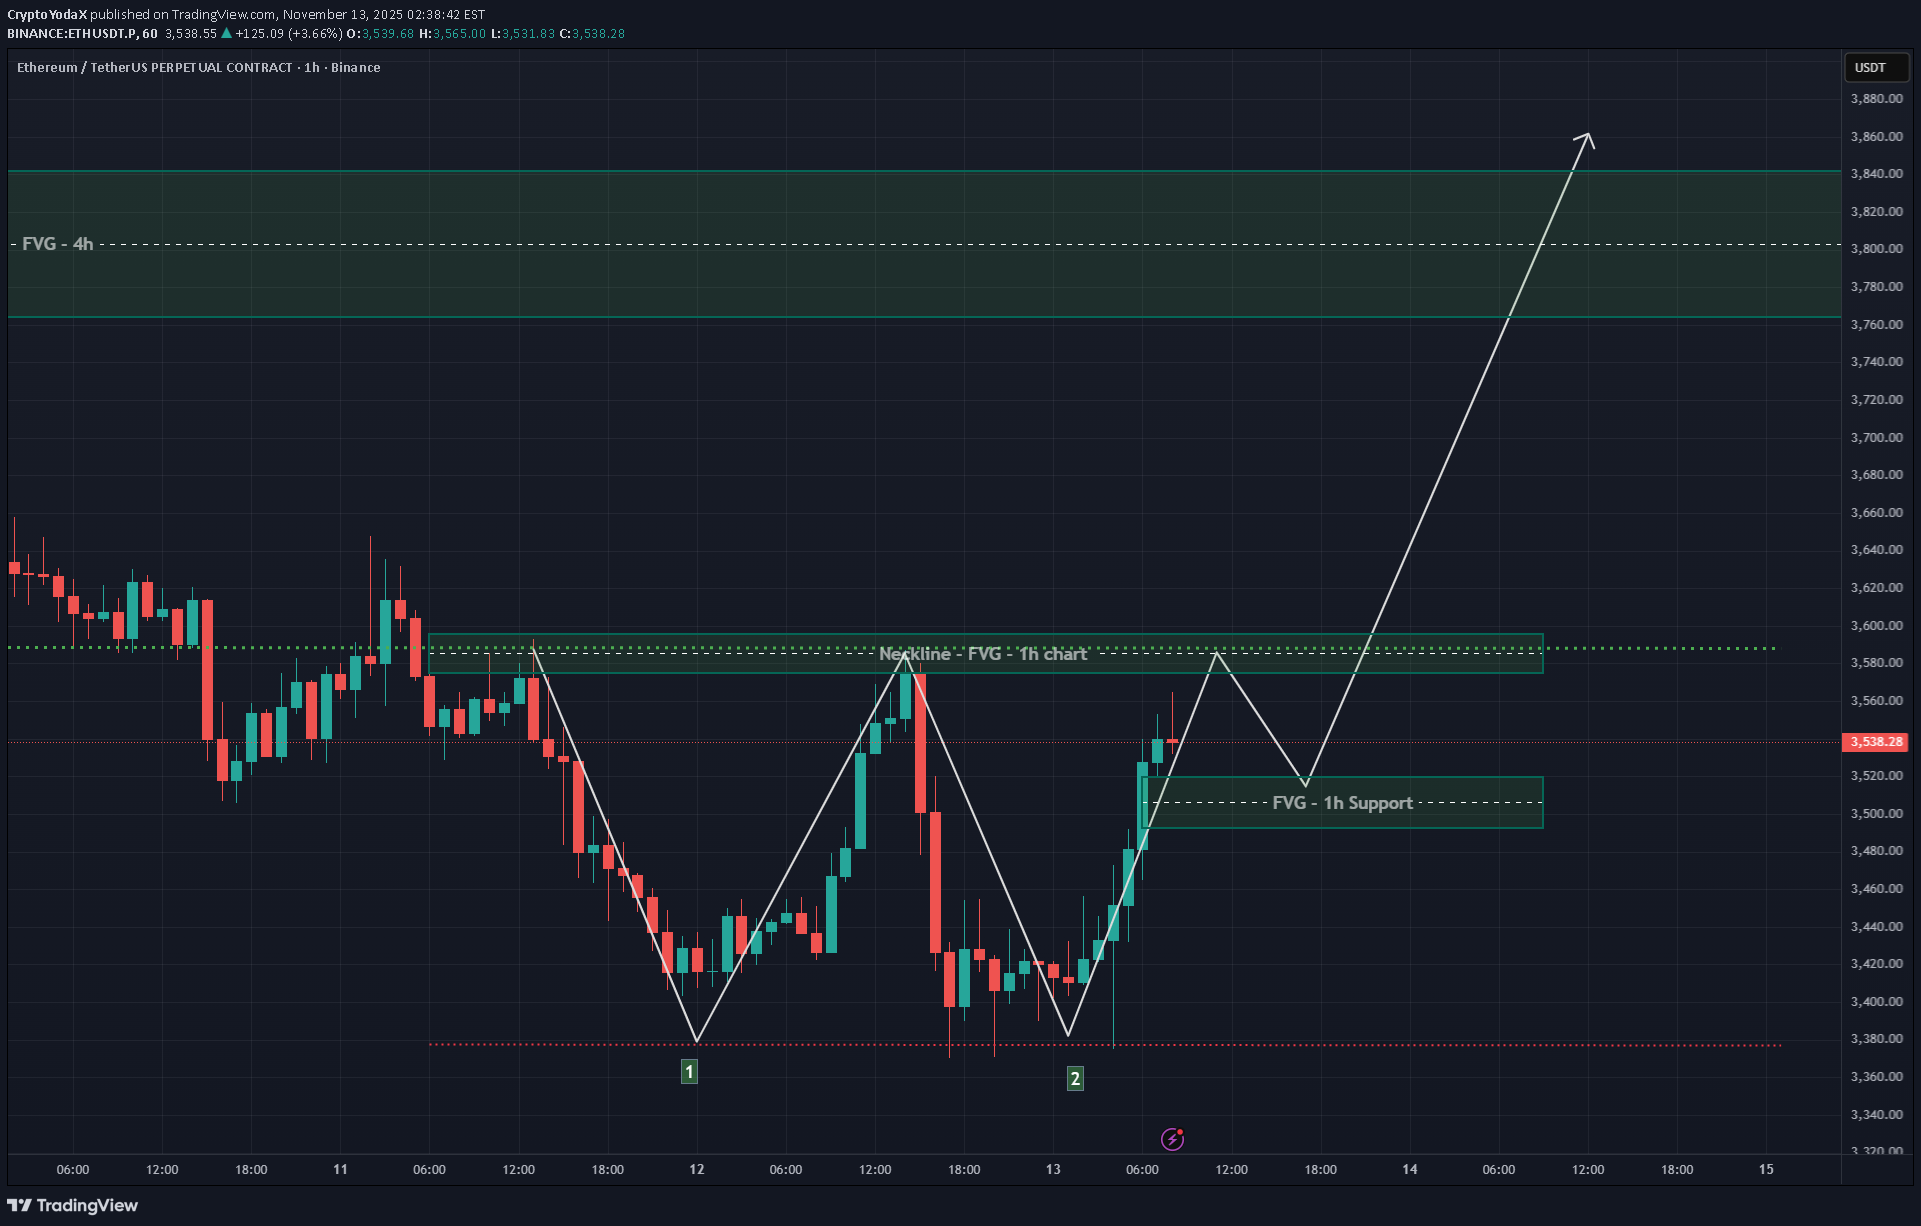
#ETH 1H chart is showing signs of a Double Bottom forming a potential reversal structure. If the neckline breaks and price holds above the 1h FVG zone, next target aligns with the 4h FVG area around +$3.8k. Structure looks clean smart money might already be positioning. Thank me later for this setup. #Ethereum #Crypto #YodaXCalls
Disclaimer
Any content and materials included in Sahmeto's website and official communication channels are a compilation of personal opinions and analyses and are not binding. They do not constitute any recommendation for buying, selling, entering or exiting the stock market and cryptocurrency market. Also, all news and analyses included in the website and channels are merely republished information from official and unofficial domestic and foreign sources, and it is obvious that users of the said content are responsible for following up and ensuring the authenticity and accuracy of the materials. Therefore, while disclaiming responsibility, it is declared that the responsibility for any decision-making, action, and potential profit and loss in the capital market and cryptocurrency market lies with the trader.