
TenderTown
@t_TenderTown

What symbols does the trader recommend buying?
Purchase History
پیام های تریدر
Filter
TenderTown
فشار صعودی تاریخی در نمودار زن (ZEN): آماده انفجار بزرگ بعدی؟
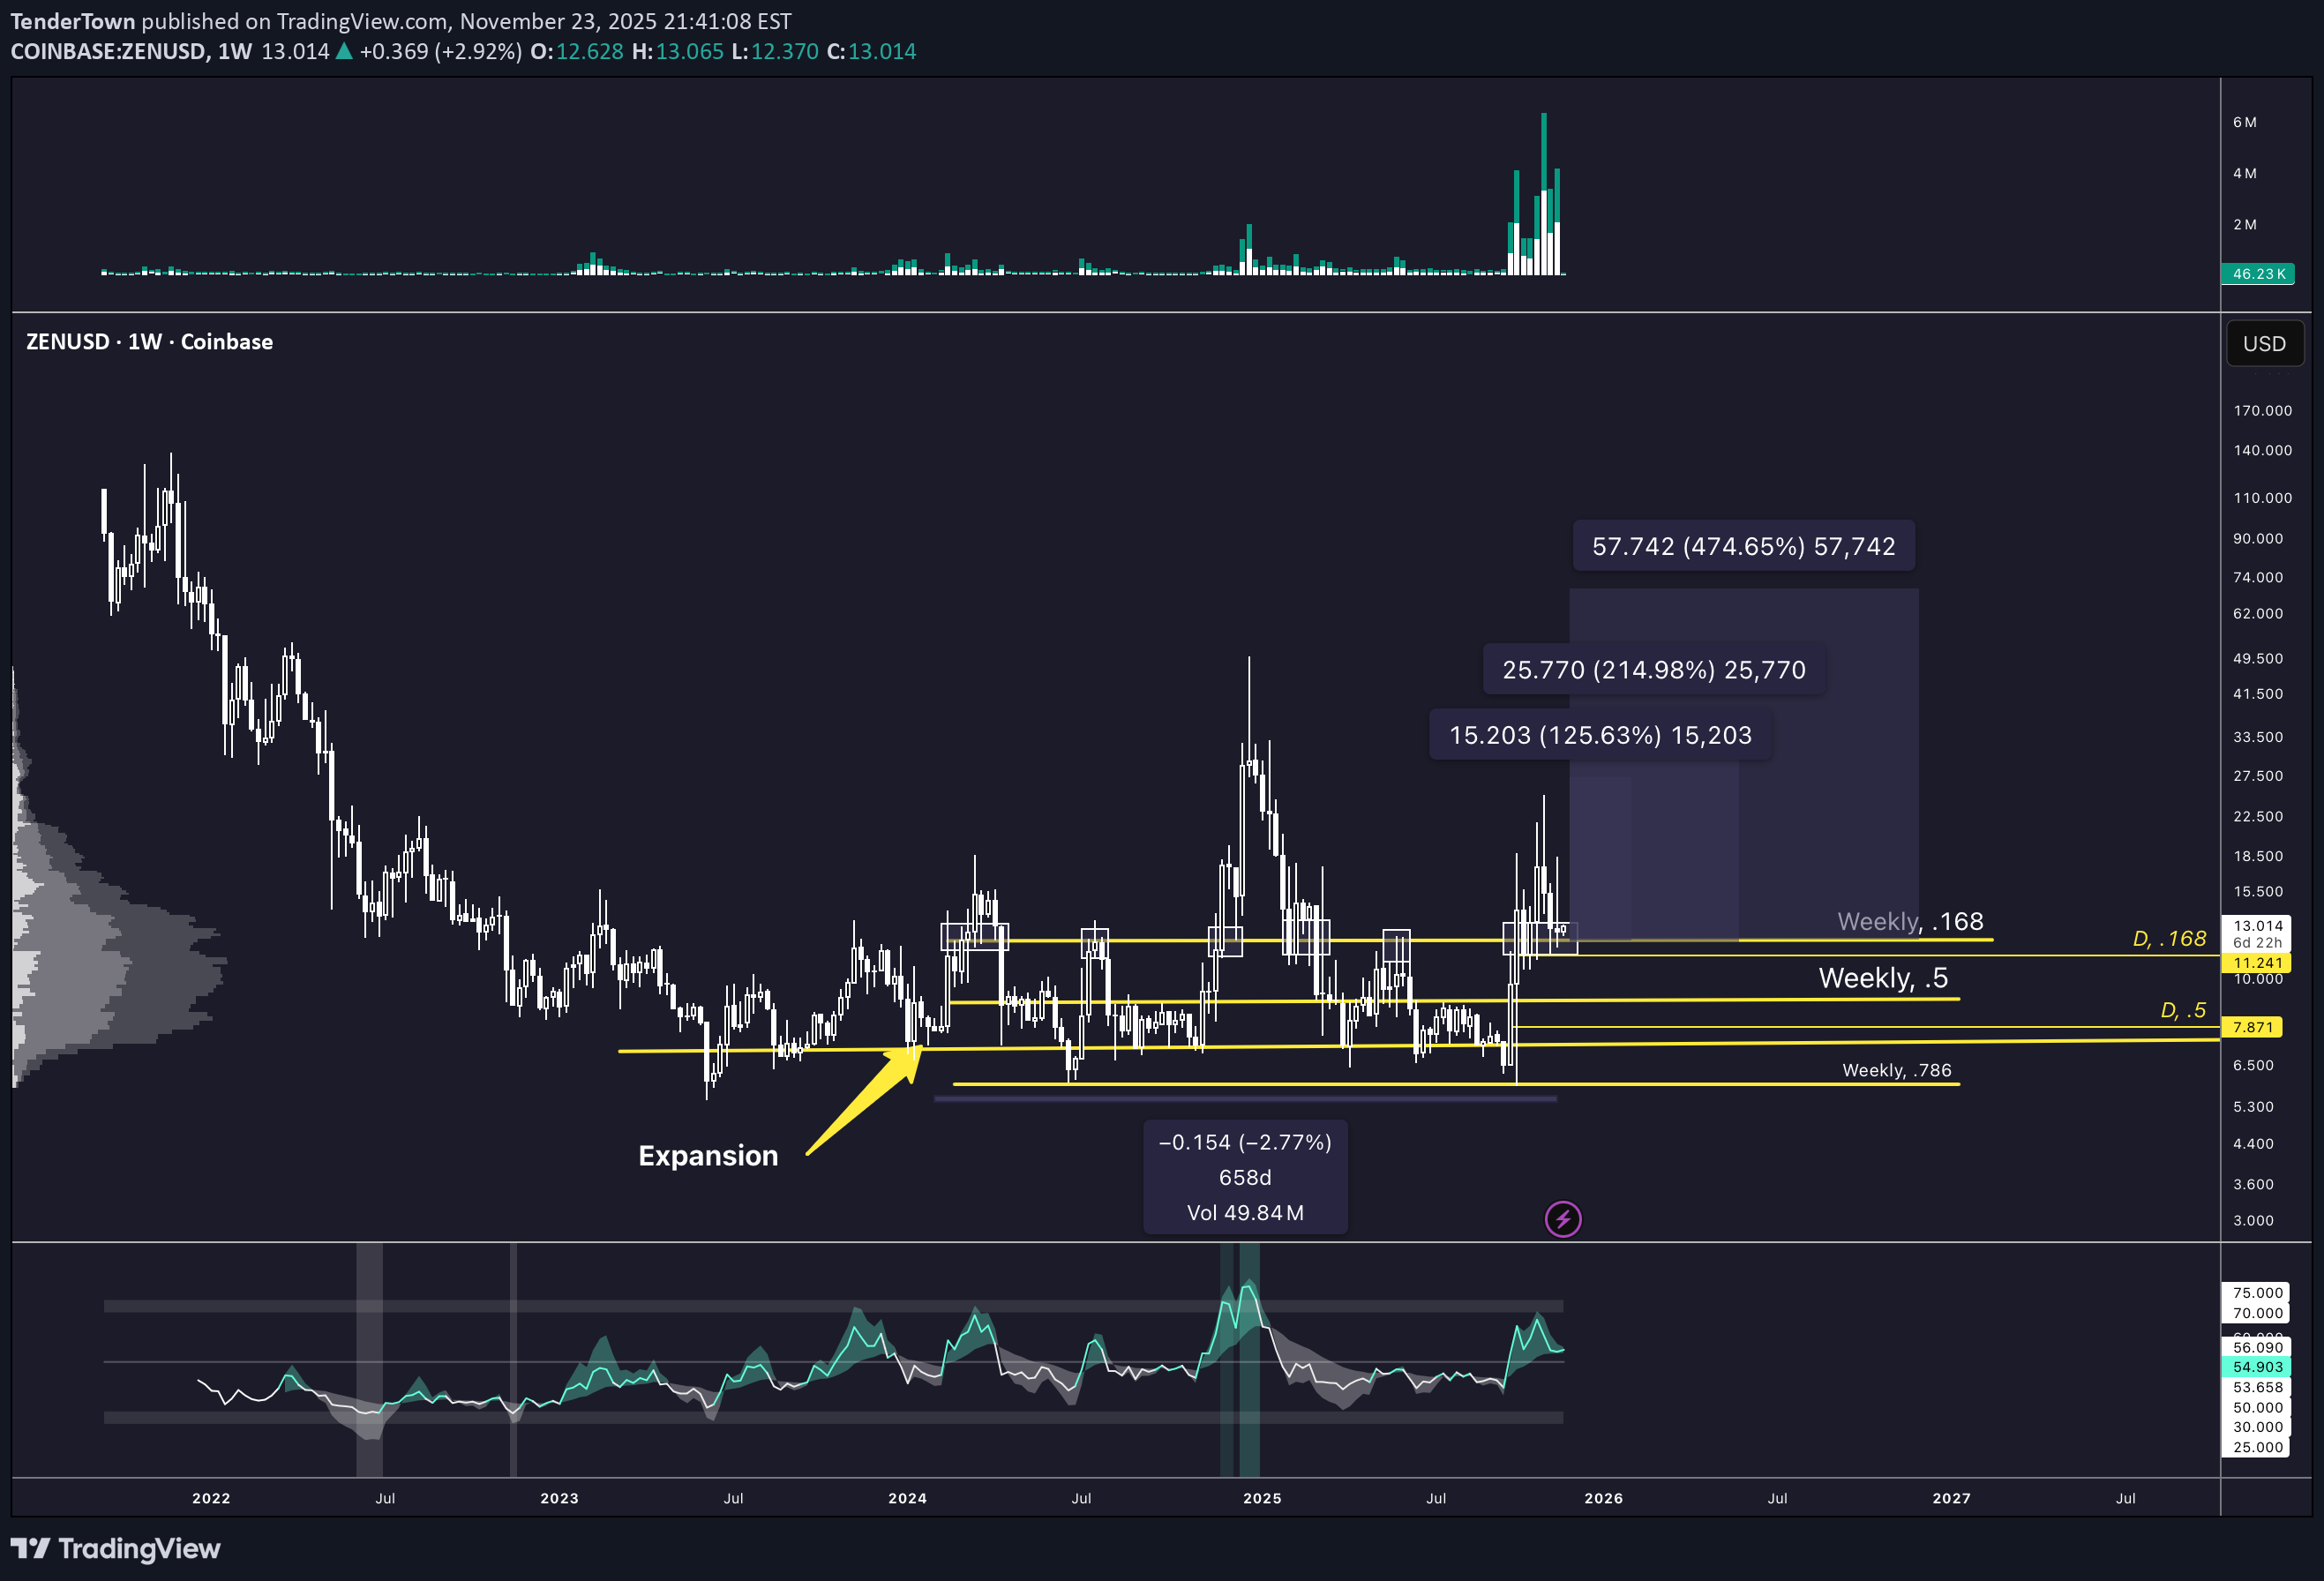
This weekly chart shows a multi-year compression range that has repeatedly expanded into large upside volatility when price reclaims the same set of mid-range levels. Every major impulse in the past two years began from failed breakdowns and quick recoveries inside this zone. Price has once again expanded off the lower boundary and reclaimed the mid-range area around 11–12. Historically, this has triggered strong follow-through moves as volatility shifts from contraction to expansion. The prior expansion legs from this level pushed into the 15, 25 and 57 zones, which are marked as upside projection targets. The structure is simple: long-term support continues to hold, breakdowns fail, and each reclaim of the mid-range leads to aggressive expansion. As long as price holds above the weekly levels shown, the next expansion phase remains intact with the same historical upside ranges active.
TenderTown
تحلیل تکنیکال وِت (VET): راز انفجار قیمت در کف حمایتی!
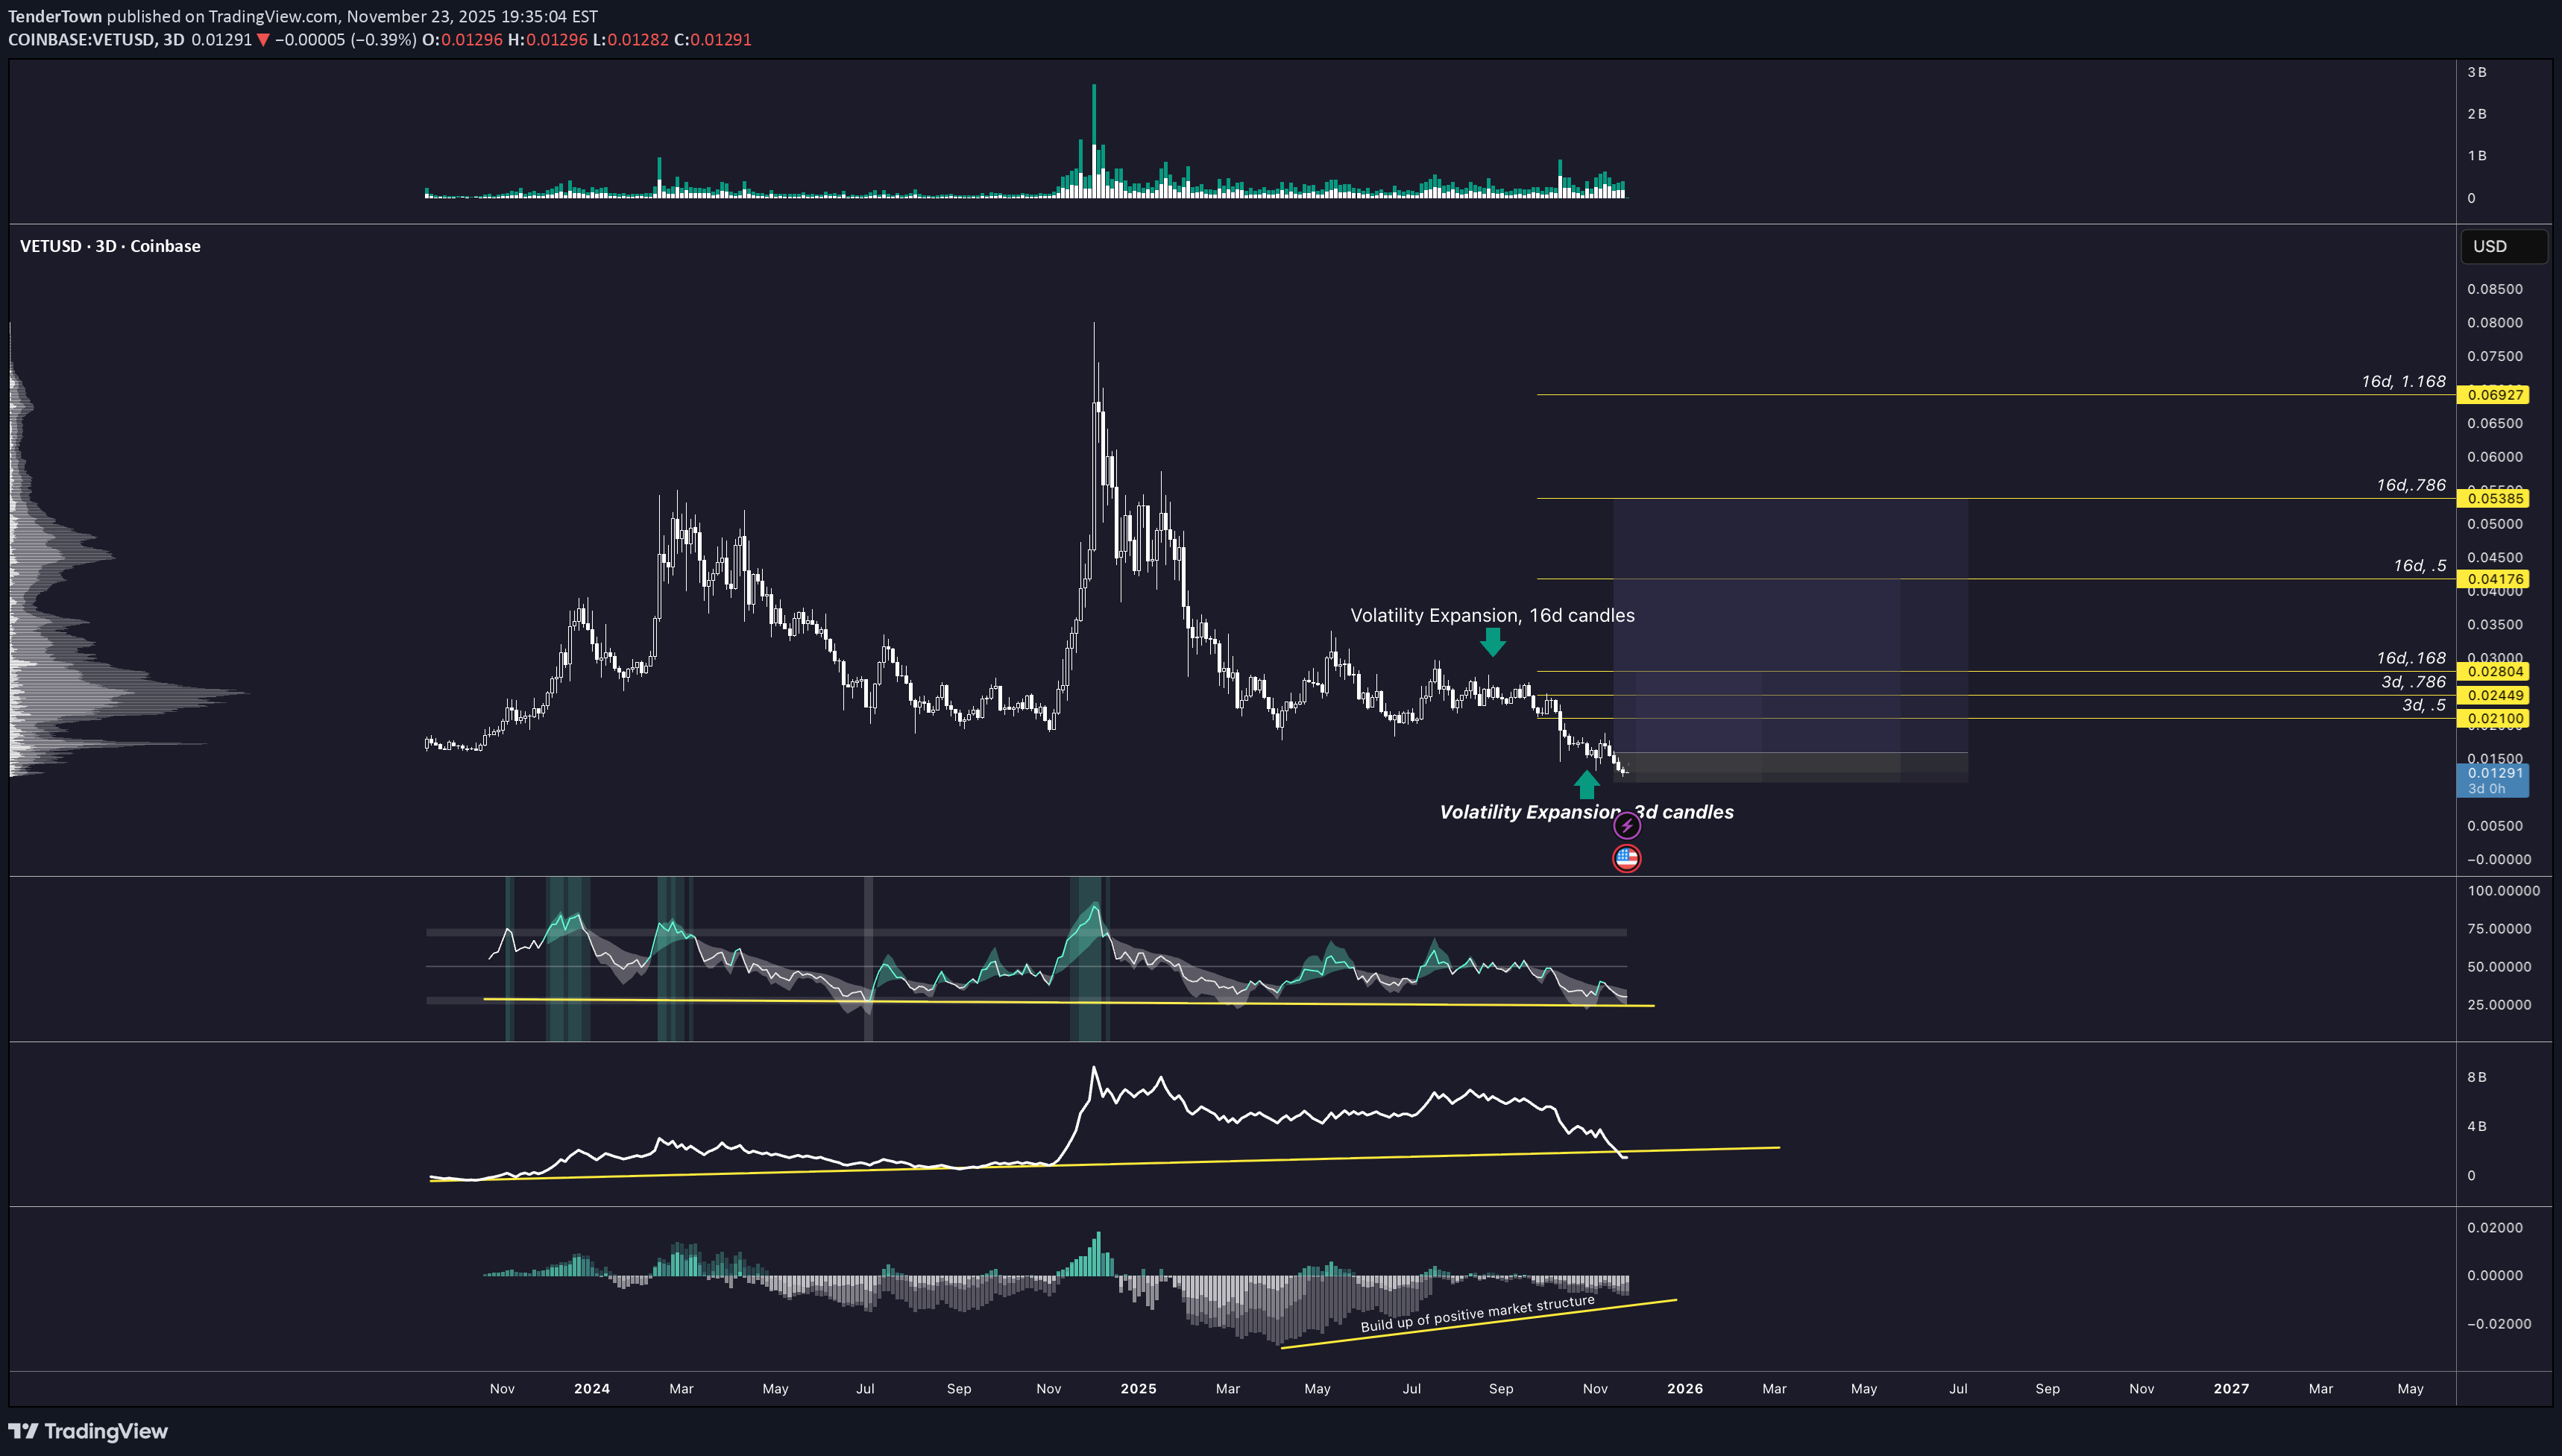
This chart highlights how VET behaves when volatility expansion occurs at major swing levels. There are two clear reference points marked. The first is the expansion that lasted sixteen candles. That move defined the prior expansion cycle and shows how price behaves when it breaks out of a compressed range with rising volatility. It also provides a baseline for cycle duration and expected reach. The second is the current three day expansion signal on the right side of the chart. Price is pressing into a multi-month support floor while the market has been contracting for an extended period. This is the same condition that preceded the last major expansion. The repeated small-range candles, declining volatility, and low momentum readings all confirm compression. The expansion targets are mapped using both the three day and sixteen day fib projections. The initial levels sit at zero point zero two four four nine and zero point zero two eight two zero four. The extended cycle levels sit at zero point zero four one seven six, zero point zero five three eight five, and zero point zero six nine two seven. These reflect the historical reach of prior volatility expansion cycles and outline the potential move if the current base holds. The shaded zones represent the probable path of expansion if volatility normalizes. The key point is that price is forming another expansion trigger at the bottom of the range while the broader structure remains unchanged. When these conditions align, the market has repeatedly responded with strong multi-week expansion cycles.
TenderTown
تحلیل انفجار قیمتی اینجکتیو (INJ): آیا حمایت تاریخی دوباره موجب صعود خواهد شد؟
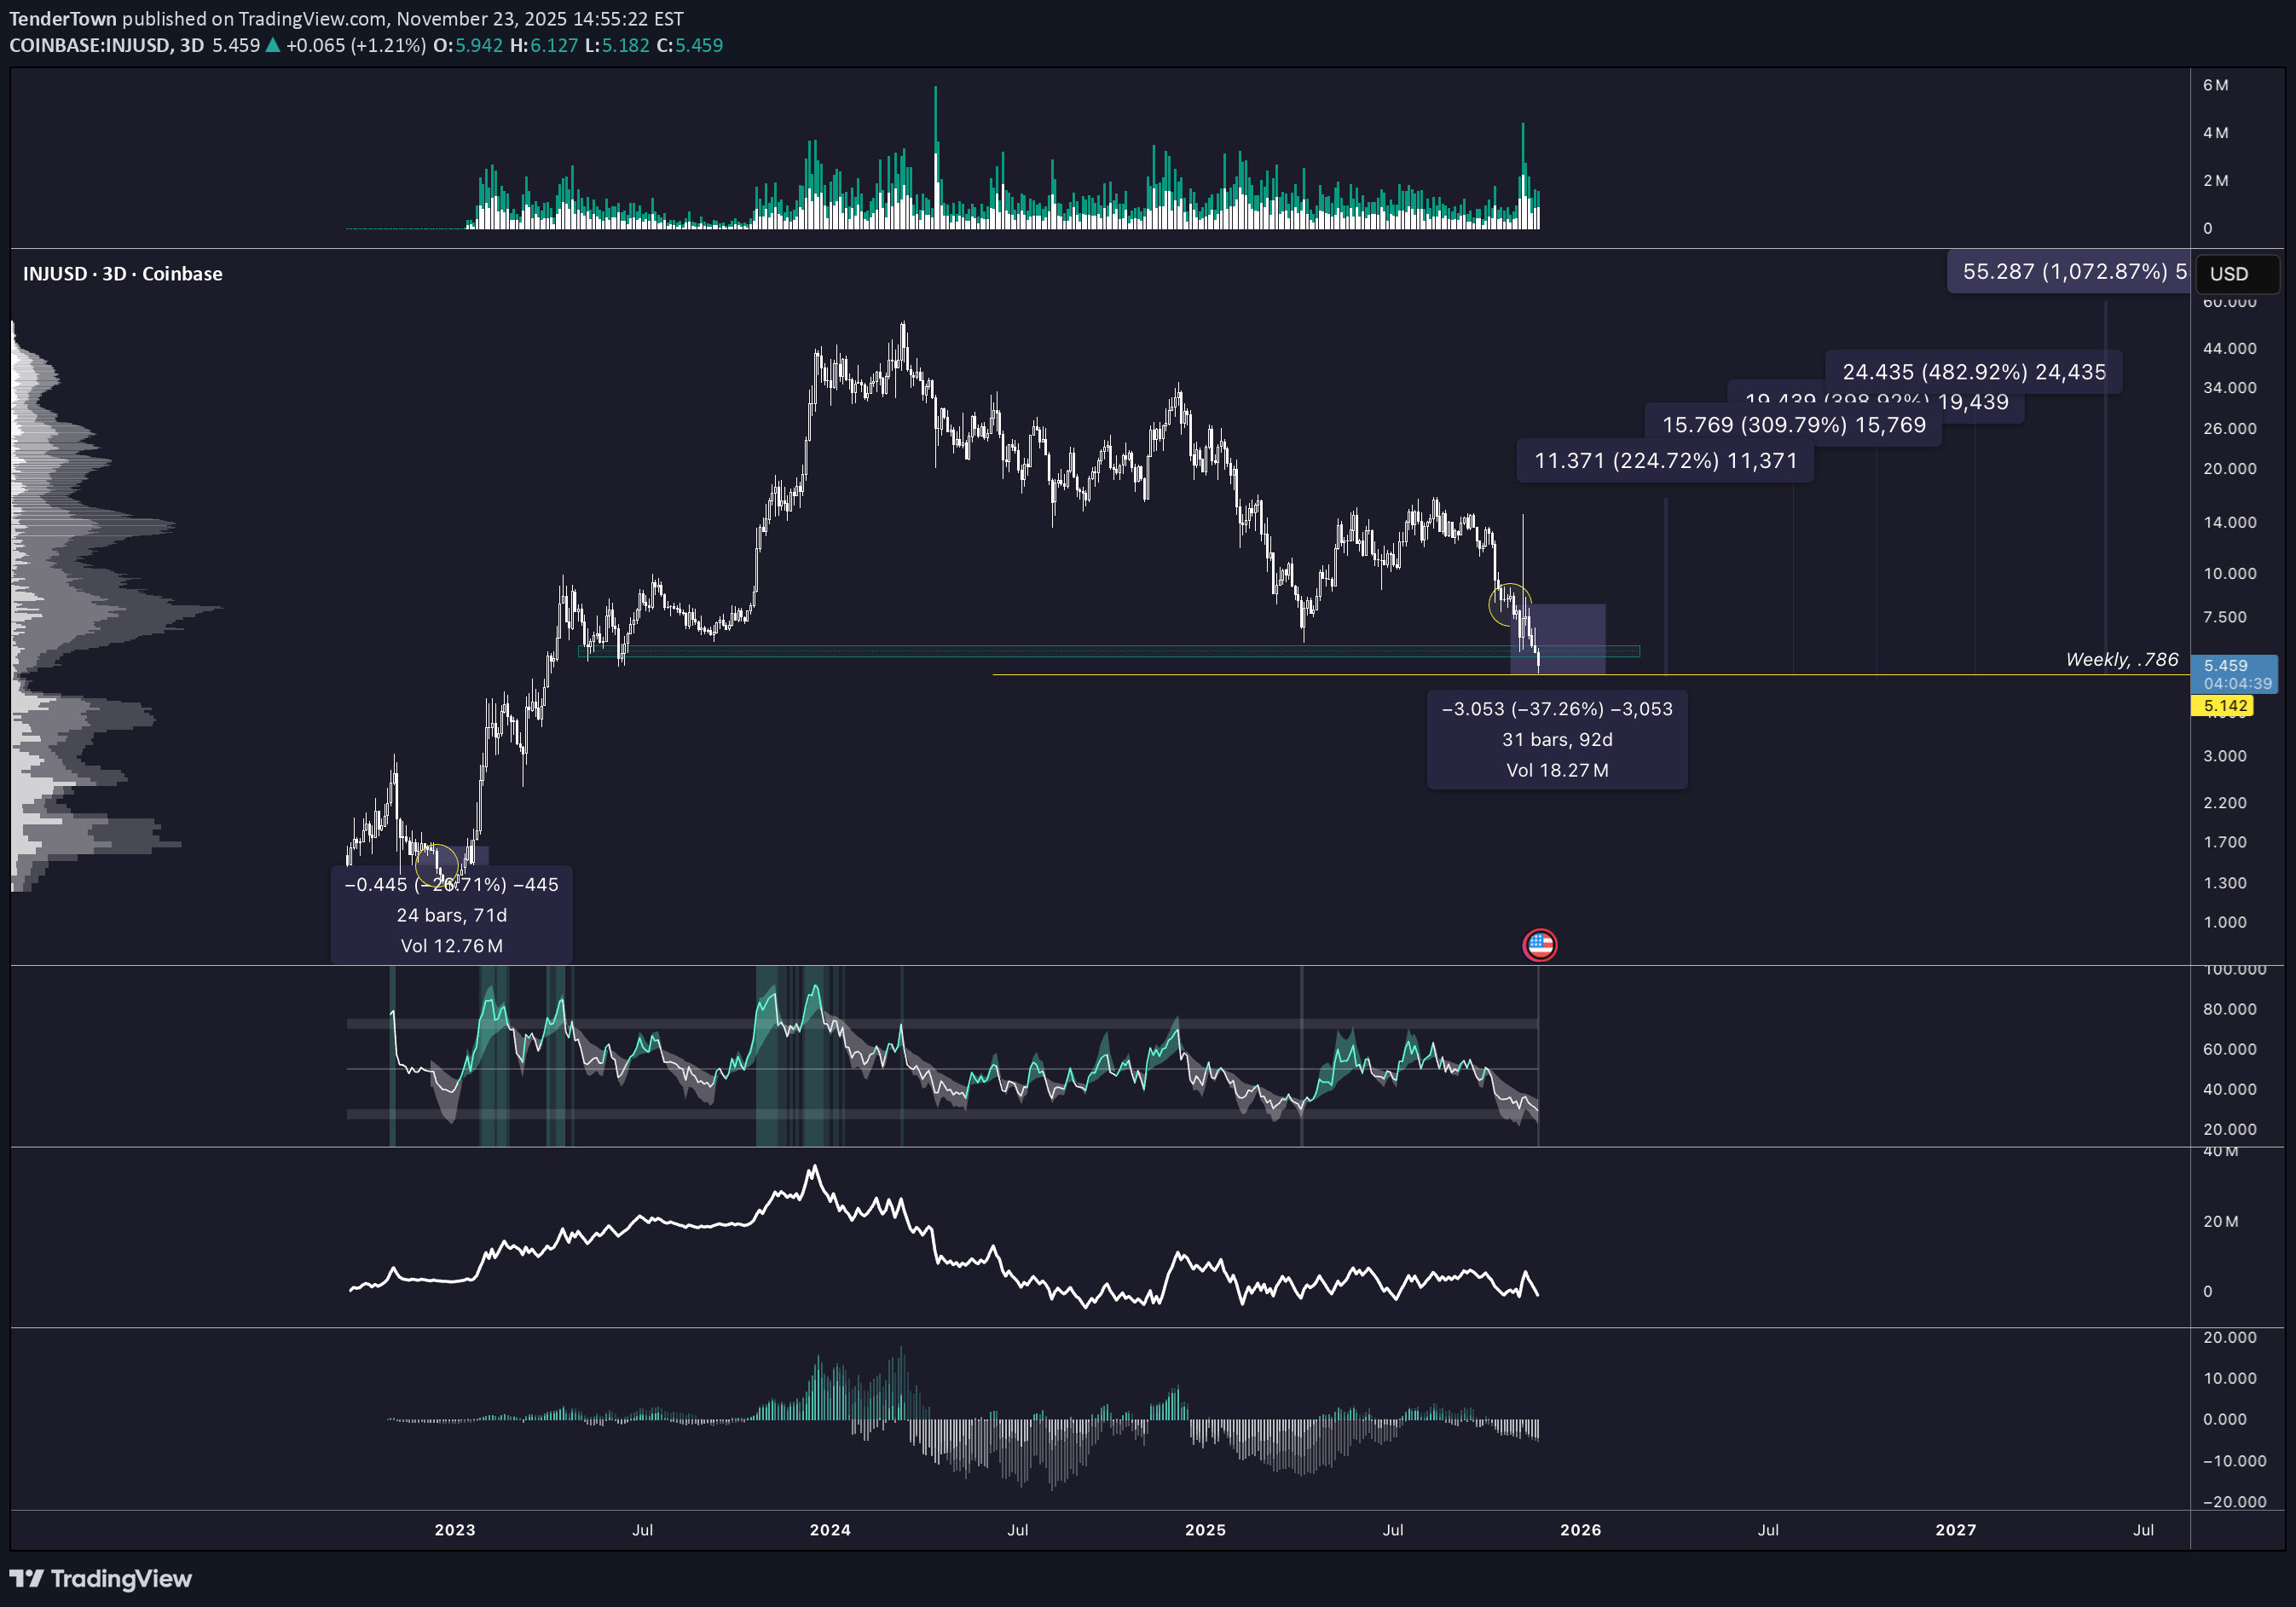
This idea focuses on how volatility expansion behaves around major structural levels on INJ using the three day and weekly charts. The first key reference point is the 2023 bottom on the left side of the chart. Price produced a cluster of exhaustion style candles, volume spiked, and volatility was compressed before a full expansion cycle began. That entire sequence is included as a historical example of how volatility expansion typically starts from deep compression and reclaimed structure. The second and most important focus is the current setup. Price has retraced directly into the same major support shelf that launched the previous expansion cycle. The yellow arrows on the weekly chart highlight the structural zone and how cleanly price is retesting it. This level also aligns with the seventy eight six retracement, giving both structural and fib confluence. The volatility panels show compression building again. Momentum is fading into support and historical volatility is sitting at the lower end of its range. This type of environment has repeatedly been the base condition for volatility expansion to occur when support holds. On the right side of the chart the fib projections outline the potential expansion legs. Eleven point three seven one and fifteen point seven six nine are the initial targets if price stabilizes above support. Twenty four point four three five and fifty five point two eight seven represent extended cycle targets based on prior expansion behavior. The idea is simple. Price is retesting a major level with volatility compressed. Historically this combination has led to strong expansion cycles. The next move depends on whether this structural shelf holds or fails.
TenderTown
صعود نهایی بیت کوین: آیا سقف ۱۴۰ هزار دلار در راه است؟
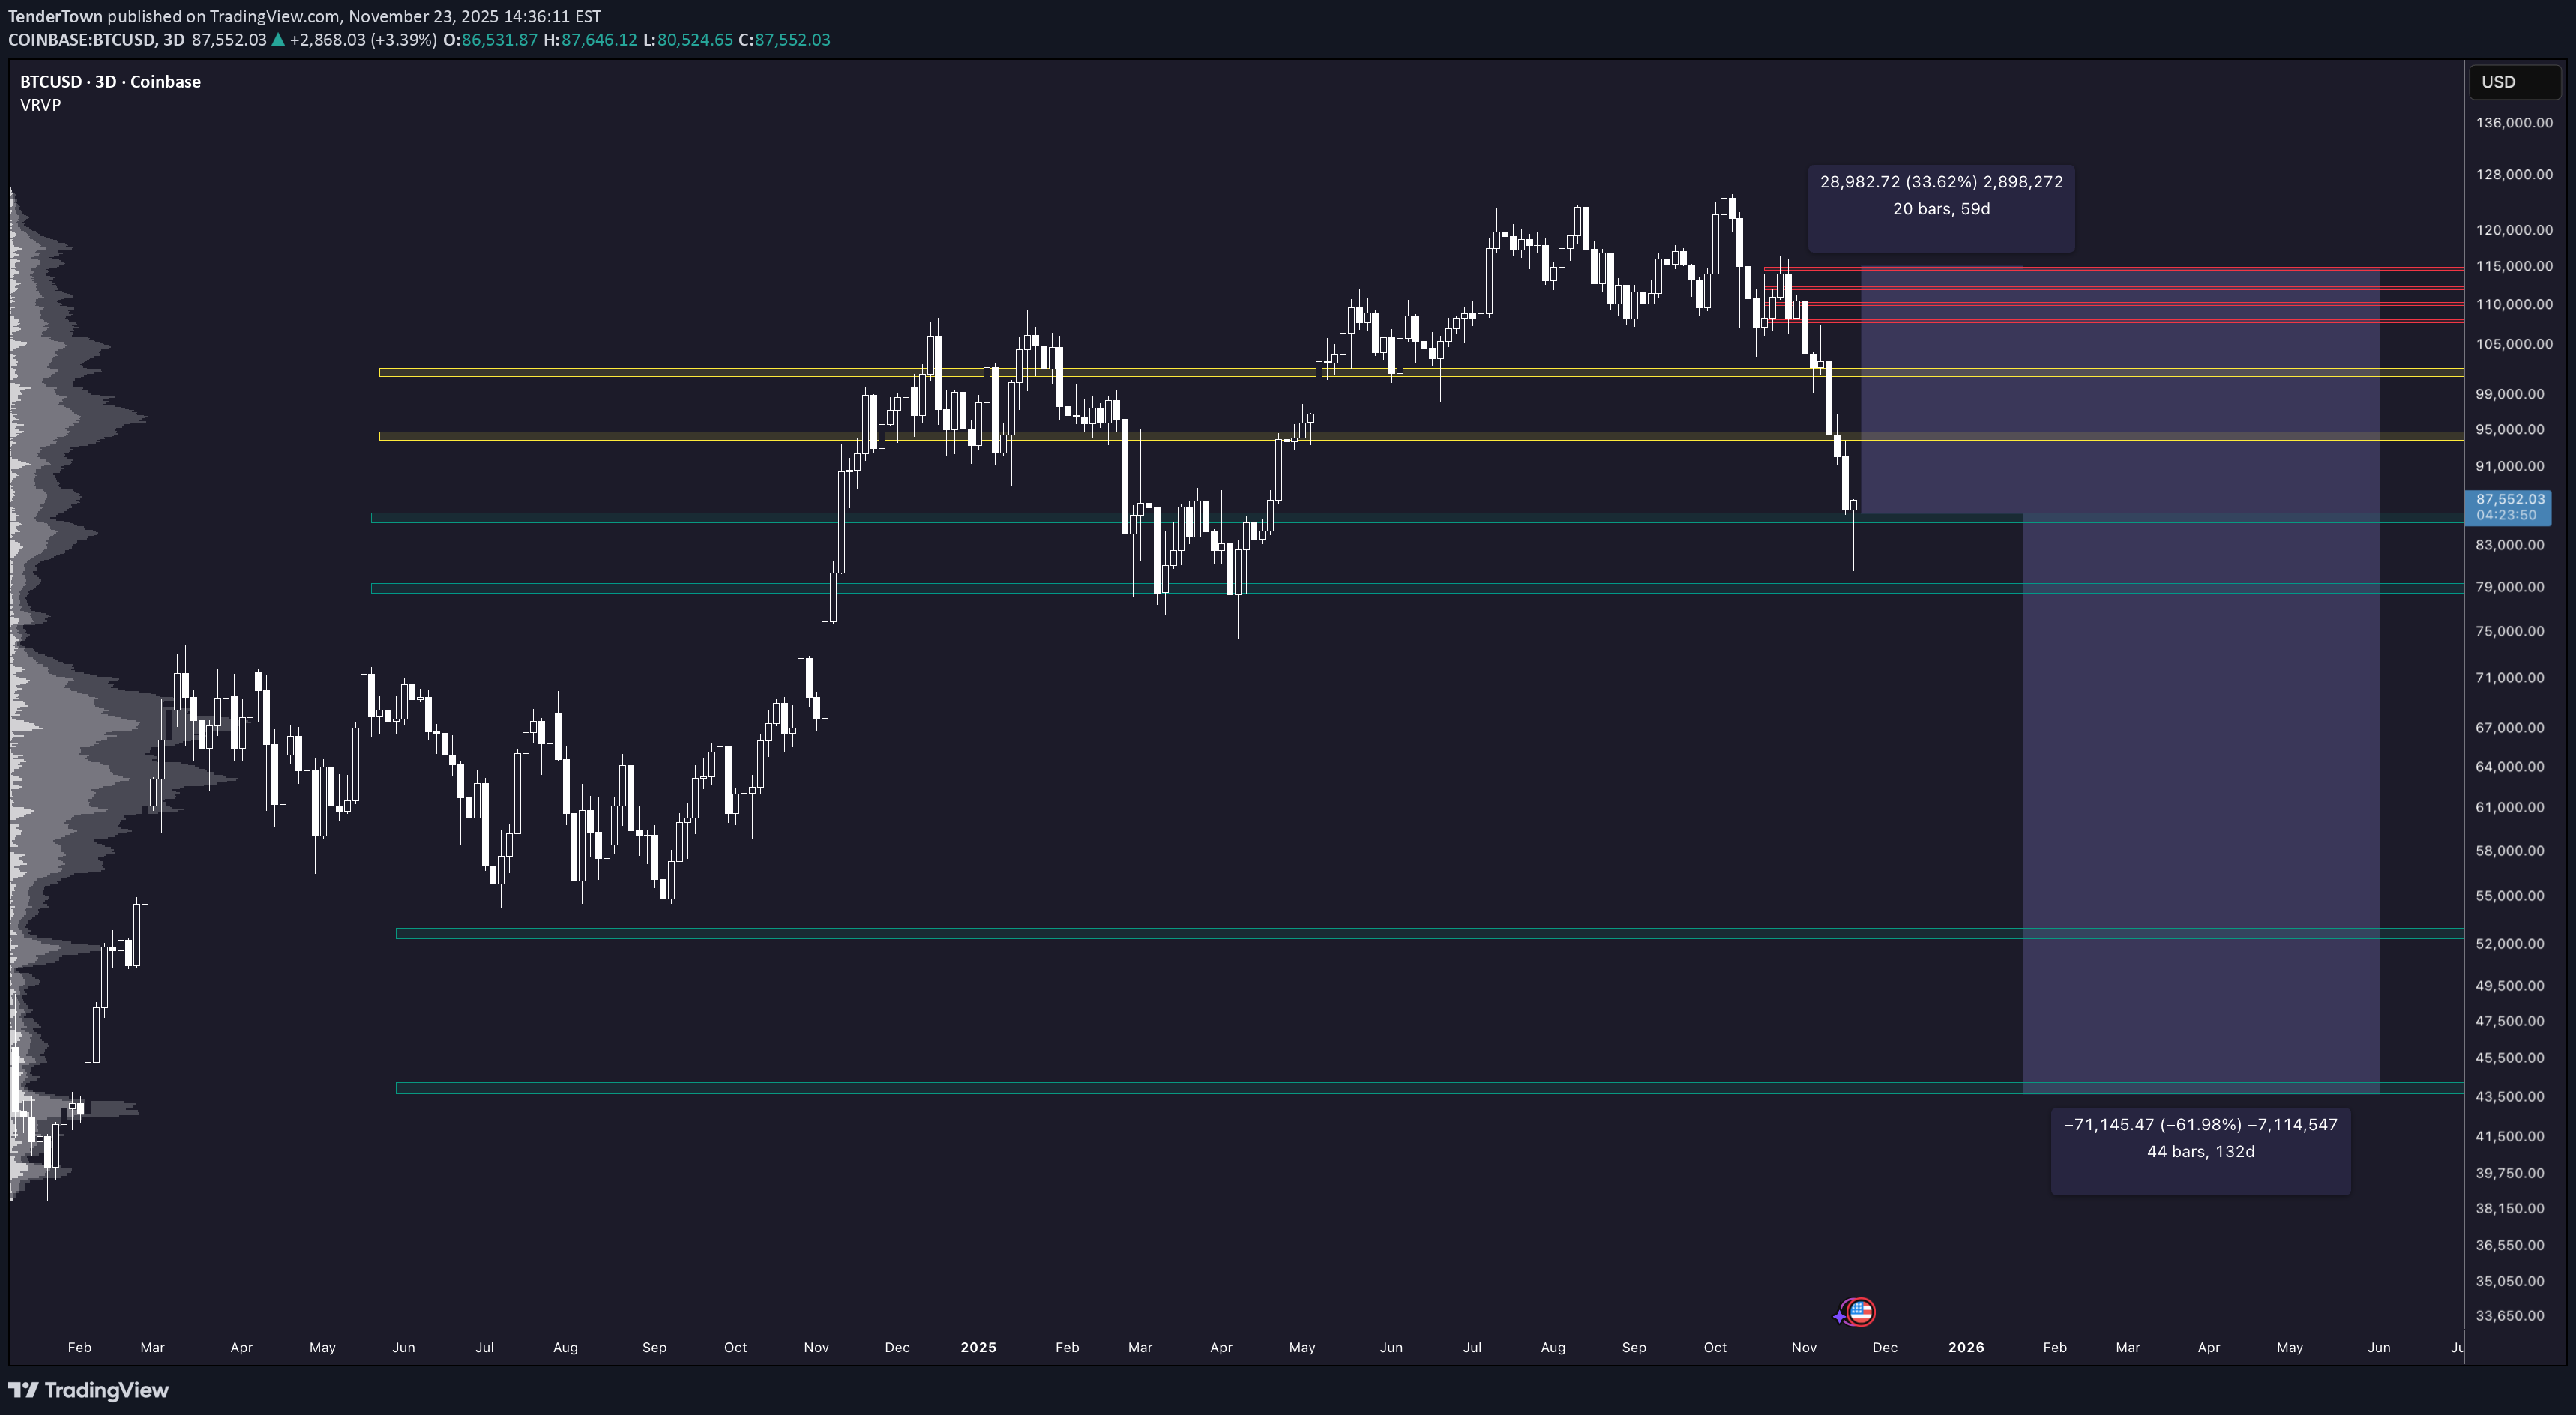
Bitcoin should have its last leg up before going into a bear market like draw down. This would be an area where buyers could step back in changing market dynamics. This follows the similar patter 4 years ago when everyone was caught off guard by a dead cat bounce and "altcoin" season. There are a lot of similarities between now, 2019, and 1990 in terms of macro-economic backdrop, rate cute cycles, and price "action". I do think Bitcoin will make a new all time high during this leg up topping at around 140k.
TenderTown
افزایش ۶۴ درصدی اتریوم (ETH) از ۲۷۰۰ دلار؛ آیا آلتسیزن بالاخره فرا رسید؟
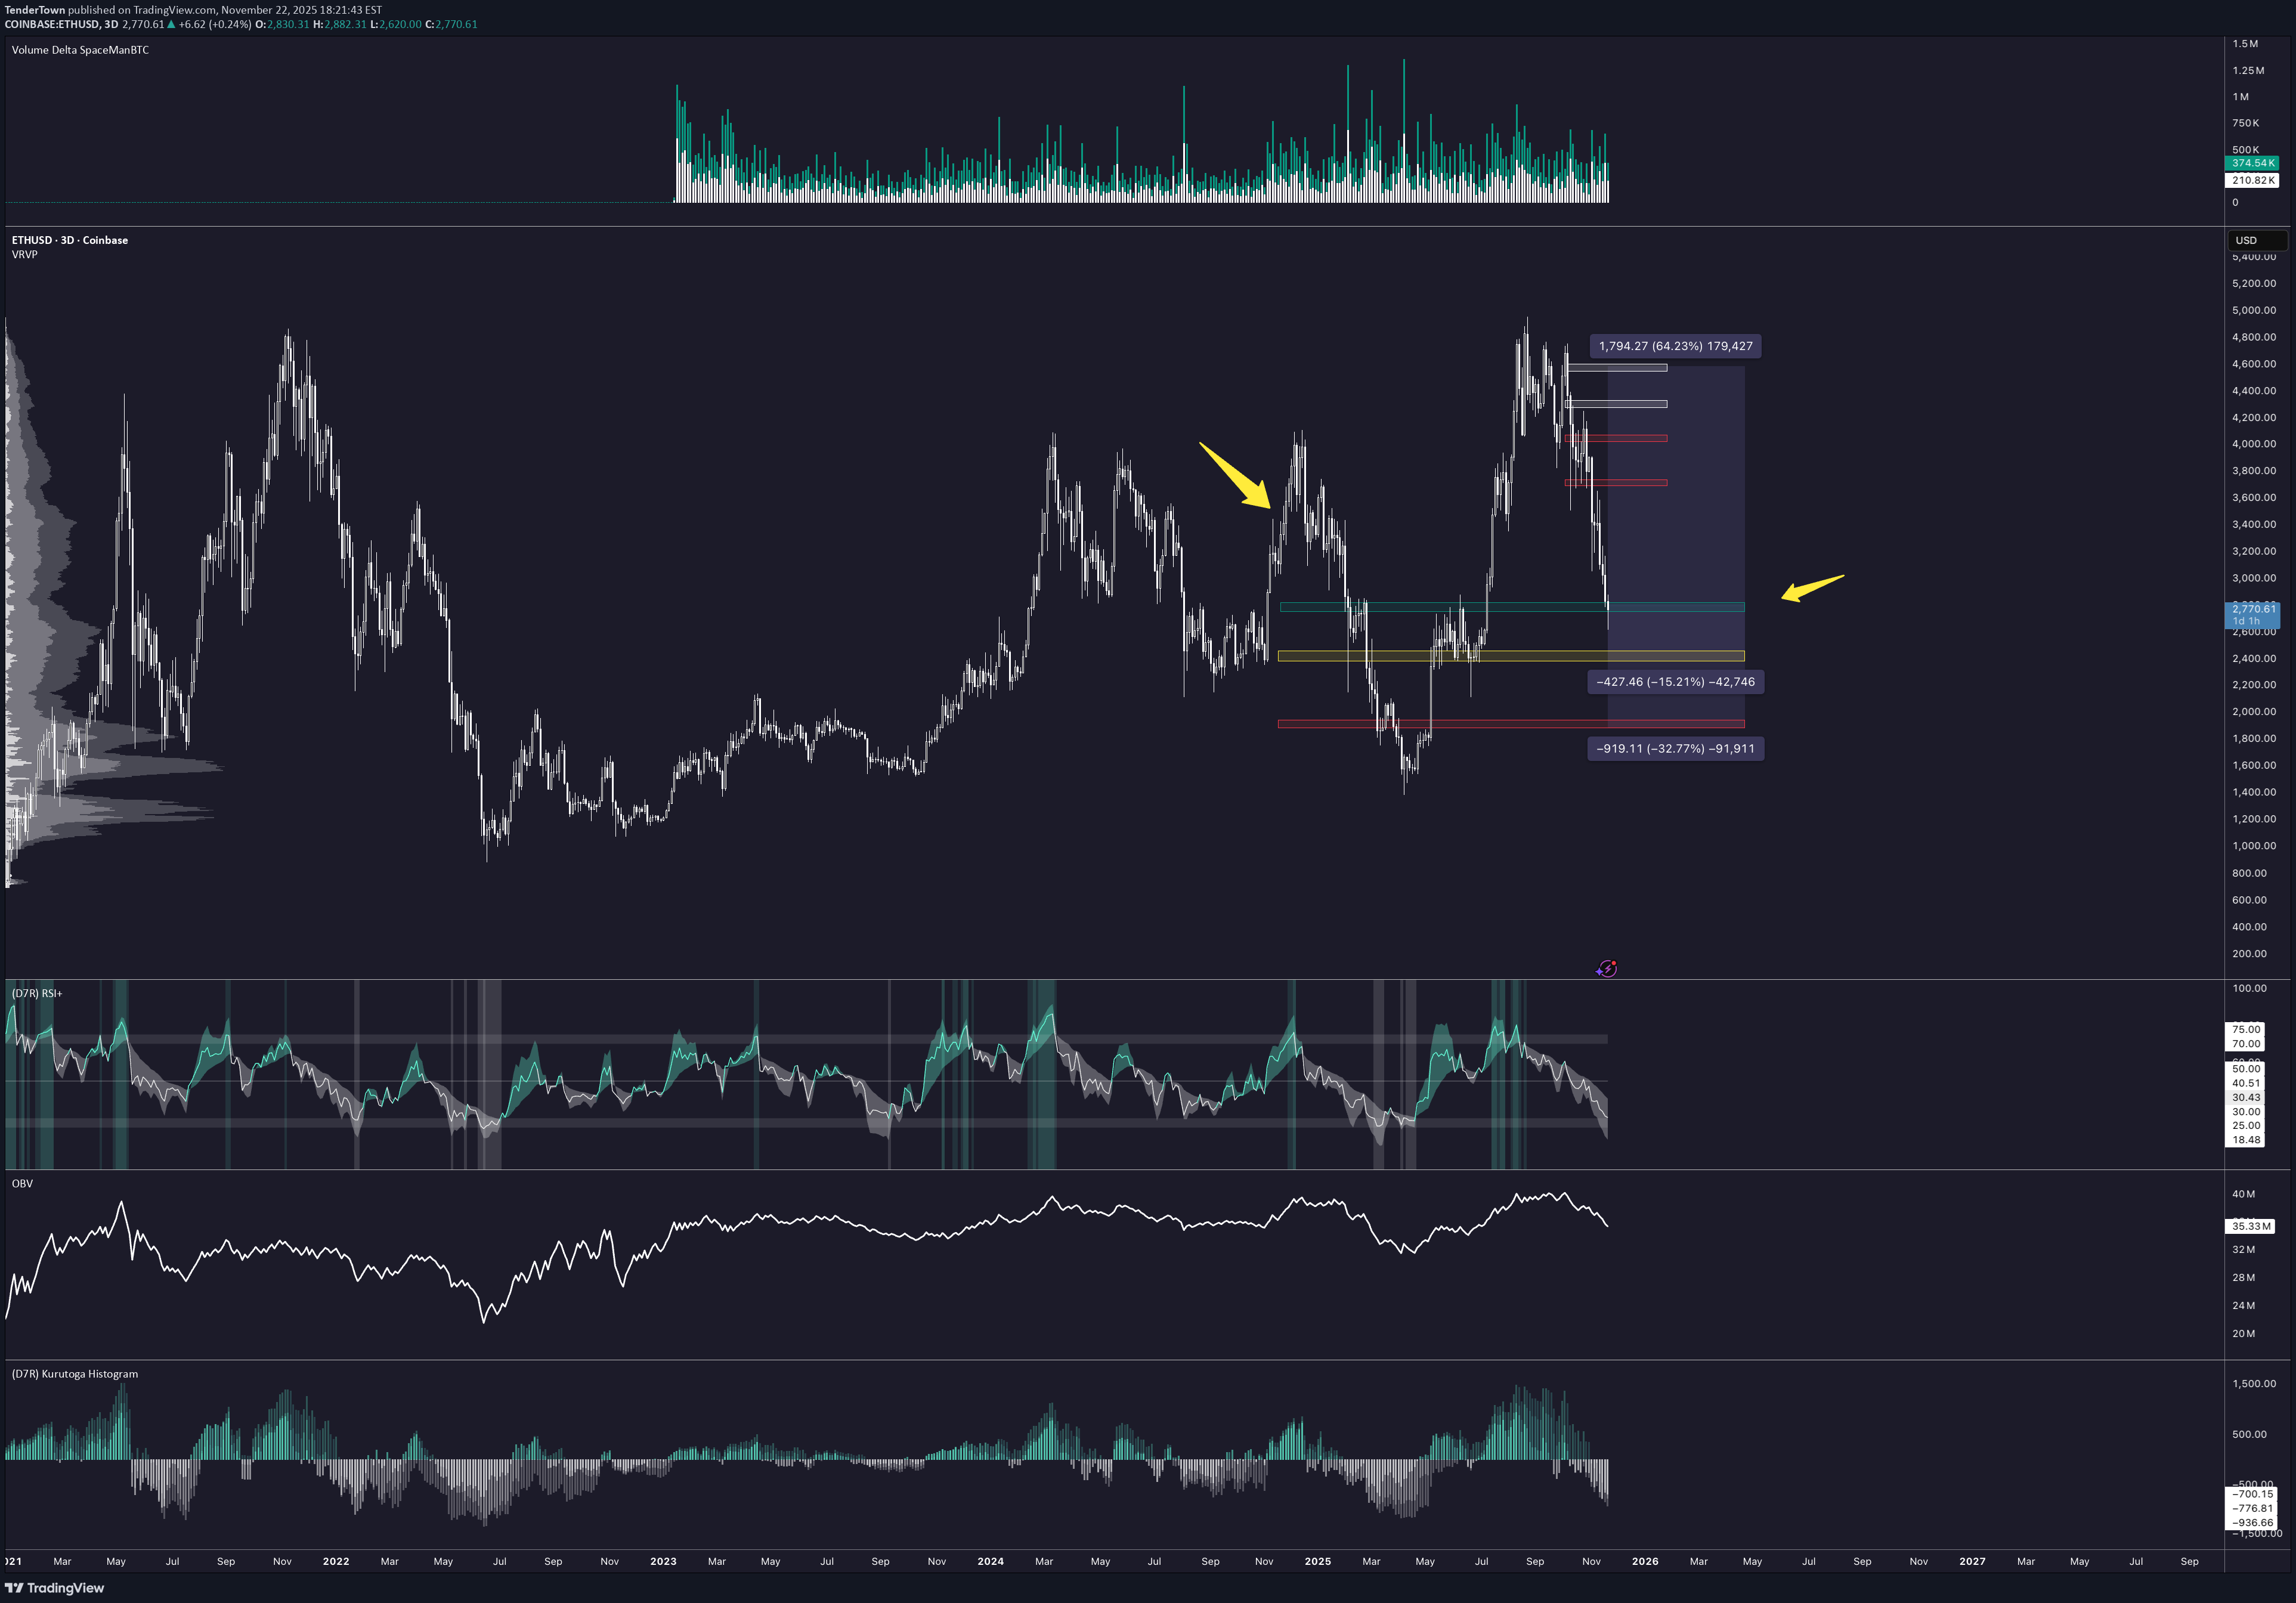
This call is based on a volatility expansion 50% level retest on the 3d. This tool identifies volatility expansion events, tracks how price behaves after them, and builds volatility based projection levels and statistics. It shows how far reversal moves typically travel and how reliable they have been. I expect a re-test of these same levels provided on the 4h time frame as indicated by the red and white boxes on the upper bound of price. We have had a good couple weeks of buyers and sellers trading around this level with out any further violent moves below it. Bitcoin is also starting to show positive market structure on LTF's. I believe during the BTC dead cat bounce alt season will have finally arrived after 4-5 years
TenderTown
Tesla (TSLA) – Daily Chart Analysis
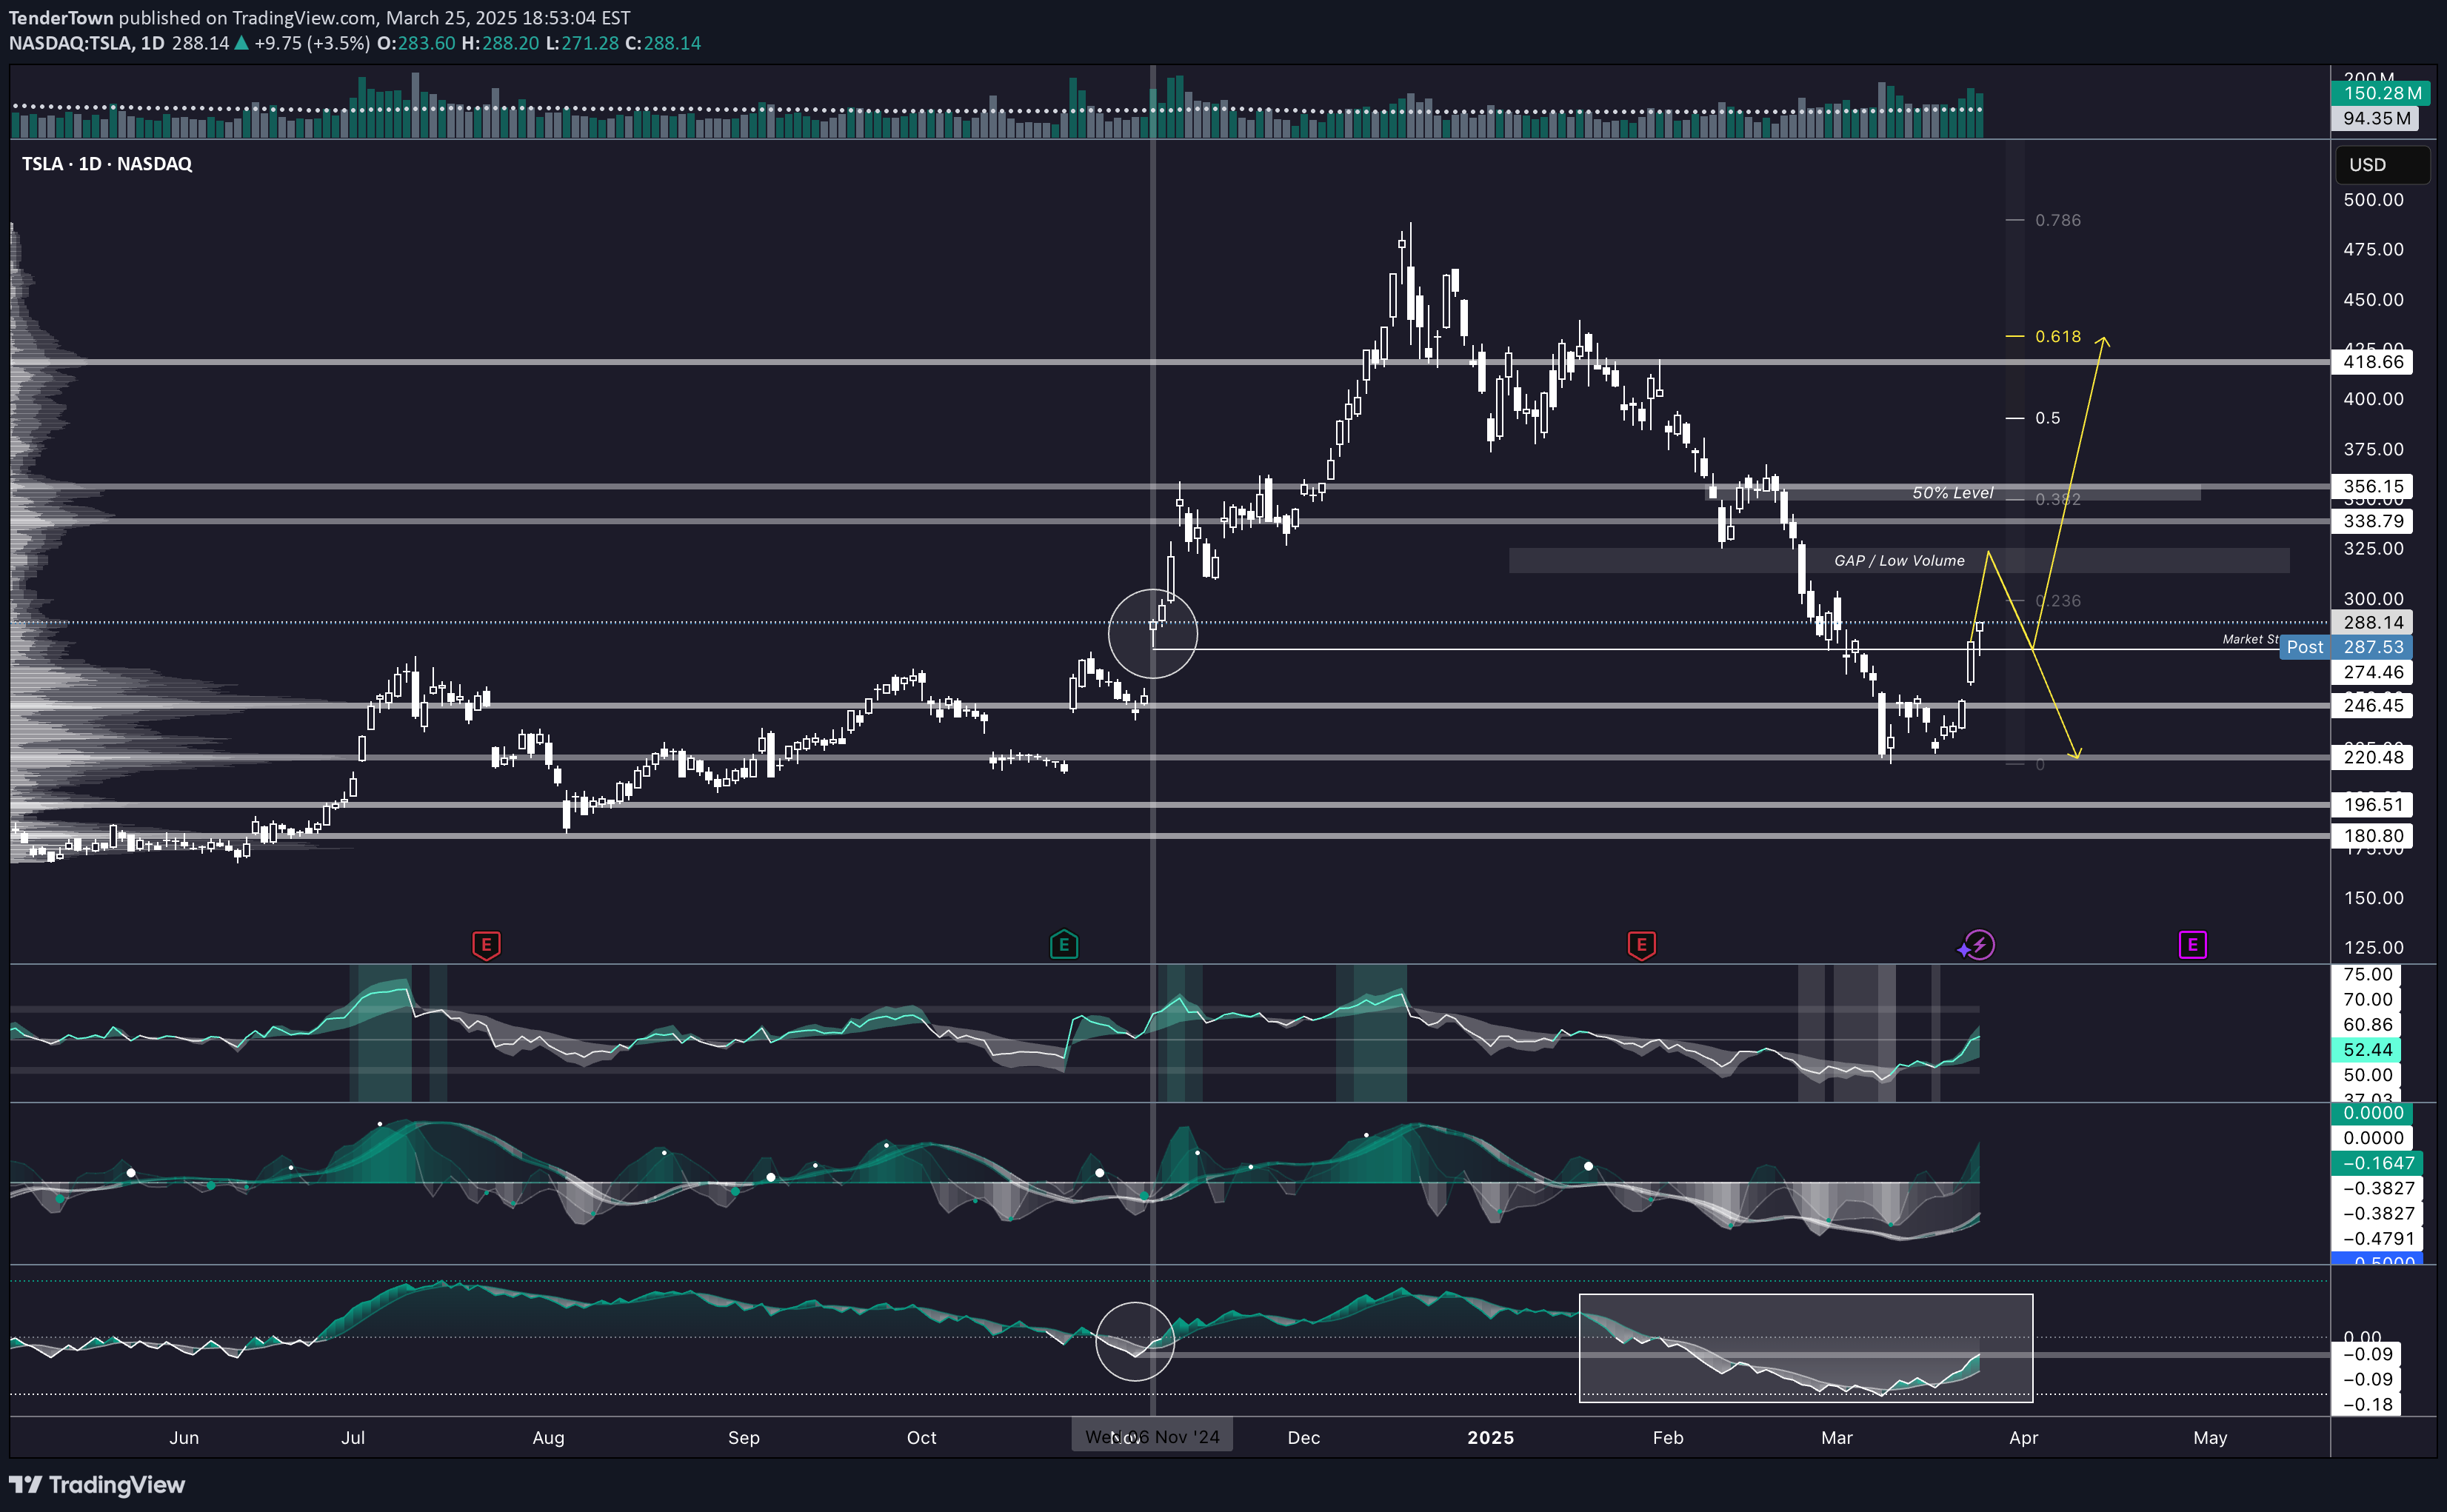
Technical Landscape Immediate Resistance: Gap / Low Volume Zone: $288.14 – $338.79 0.236 Fibonacci retracement at ~$338.79 Major Resistance Above: 50% Retracement: ~$356.15 0.618 Fibonacci: ~$418.66 Key Support Levels: $246.45 (recent structural low) $220.48 $196.51 $180.80 Momentum Indicators RSI Currently rising and reclaiming the 50.00 level, a significant threshold. Momentum profile closely mirrors the November 2024 recovery (highlighted with circle). Prior surges from similar RSI+ structures led to multi-week uptrends. Trend Bullish crossover confirmed with expanding green histogram. Momentum is accelerating out of a deeply oversold condition—similar to the late 2024 rally initiation. Signal line separation is clear, suggesting short-term strength remains intact. On Balance Volume Just printed its first strong upturn in over two months. The curve has transitioned from flat to rising, forming a mirror image of the reversal seen in November 2024. While early, the formation suggests underlying accumulation and rotation back into strength. Scenarios Based on Current Structure Scenario 1: Bullish Continuation Through Gap Zone Trigger: Break and hold above ~$288.14 (gap entry) with increasing volume and confirmation from RSI+ and WaveTrend. Structure: Price accelerates into low-volume gap region, seeking fill up to ~$338.79. Target 1: $338.79 (0.236 Fib) Target 2: $356.15 (50% retracement) Target 3: $418.66 (0.618 retracement) Momentum Bias: All three indicators currently favor bullish continuation. Scenario 2: Short-Term Rejection at Gap Resistance Trigger: Price rejects within $288–$300 and fails to sustain above the low-volume node. Price Response: Retests structural support near $246.45 or deeper at $220.48. Setup: Look for RSI+ to lose the 50 level and WaveTrend to flatten or recross down. Bias: Short-term corrective move, but still within a broader base-building structure. Scenario 3: Breakdown Back Into Range Trigger: A sharp reversal with high-volume rejection from the current rally leg, especially without full gap fill. Confirmation: Indicators roll over—WaveTrend flips negative, Volume Buoyancy breaks down. Target: $220.48 initially, then $196.51 and potentially $180.80 if broader market weakens. Implication: Reclassifies price action as a failed relief rally, resuming prior downtrend. Summary Tesla is in the early stages of a potential trend reversal. The alignment of RSI+, WaveTrend 3D, and Volume Buoyancy with prior bottoming conditions suggests further upside is likely if the stock clears the low-volume region starting at ~$288. That said, this is a structurally thin area, and rejection within the gap could send price back to major support zones. Volume will be key in validating breakout attempts. Should momentum fade and structural levels fail, the broader downtrend may reassert itself.
TenderTown
Robinhood (HOOD) – Daily Chart Analysis
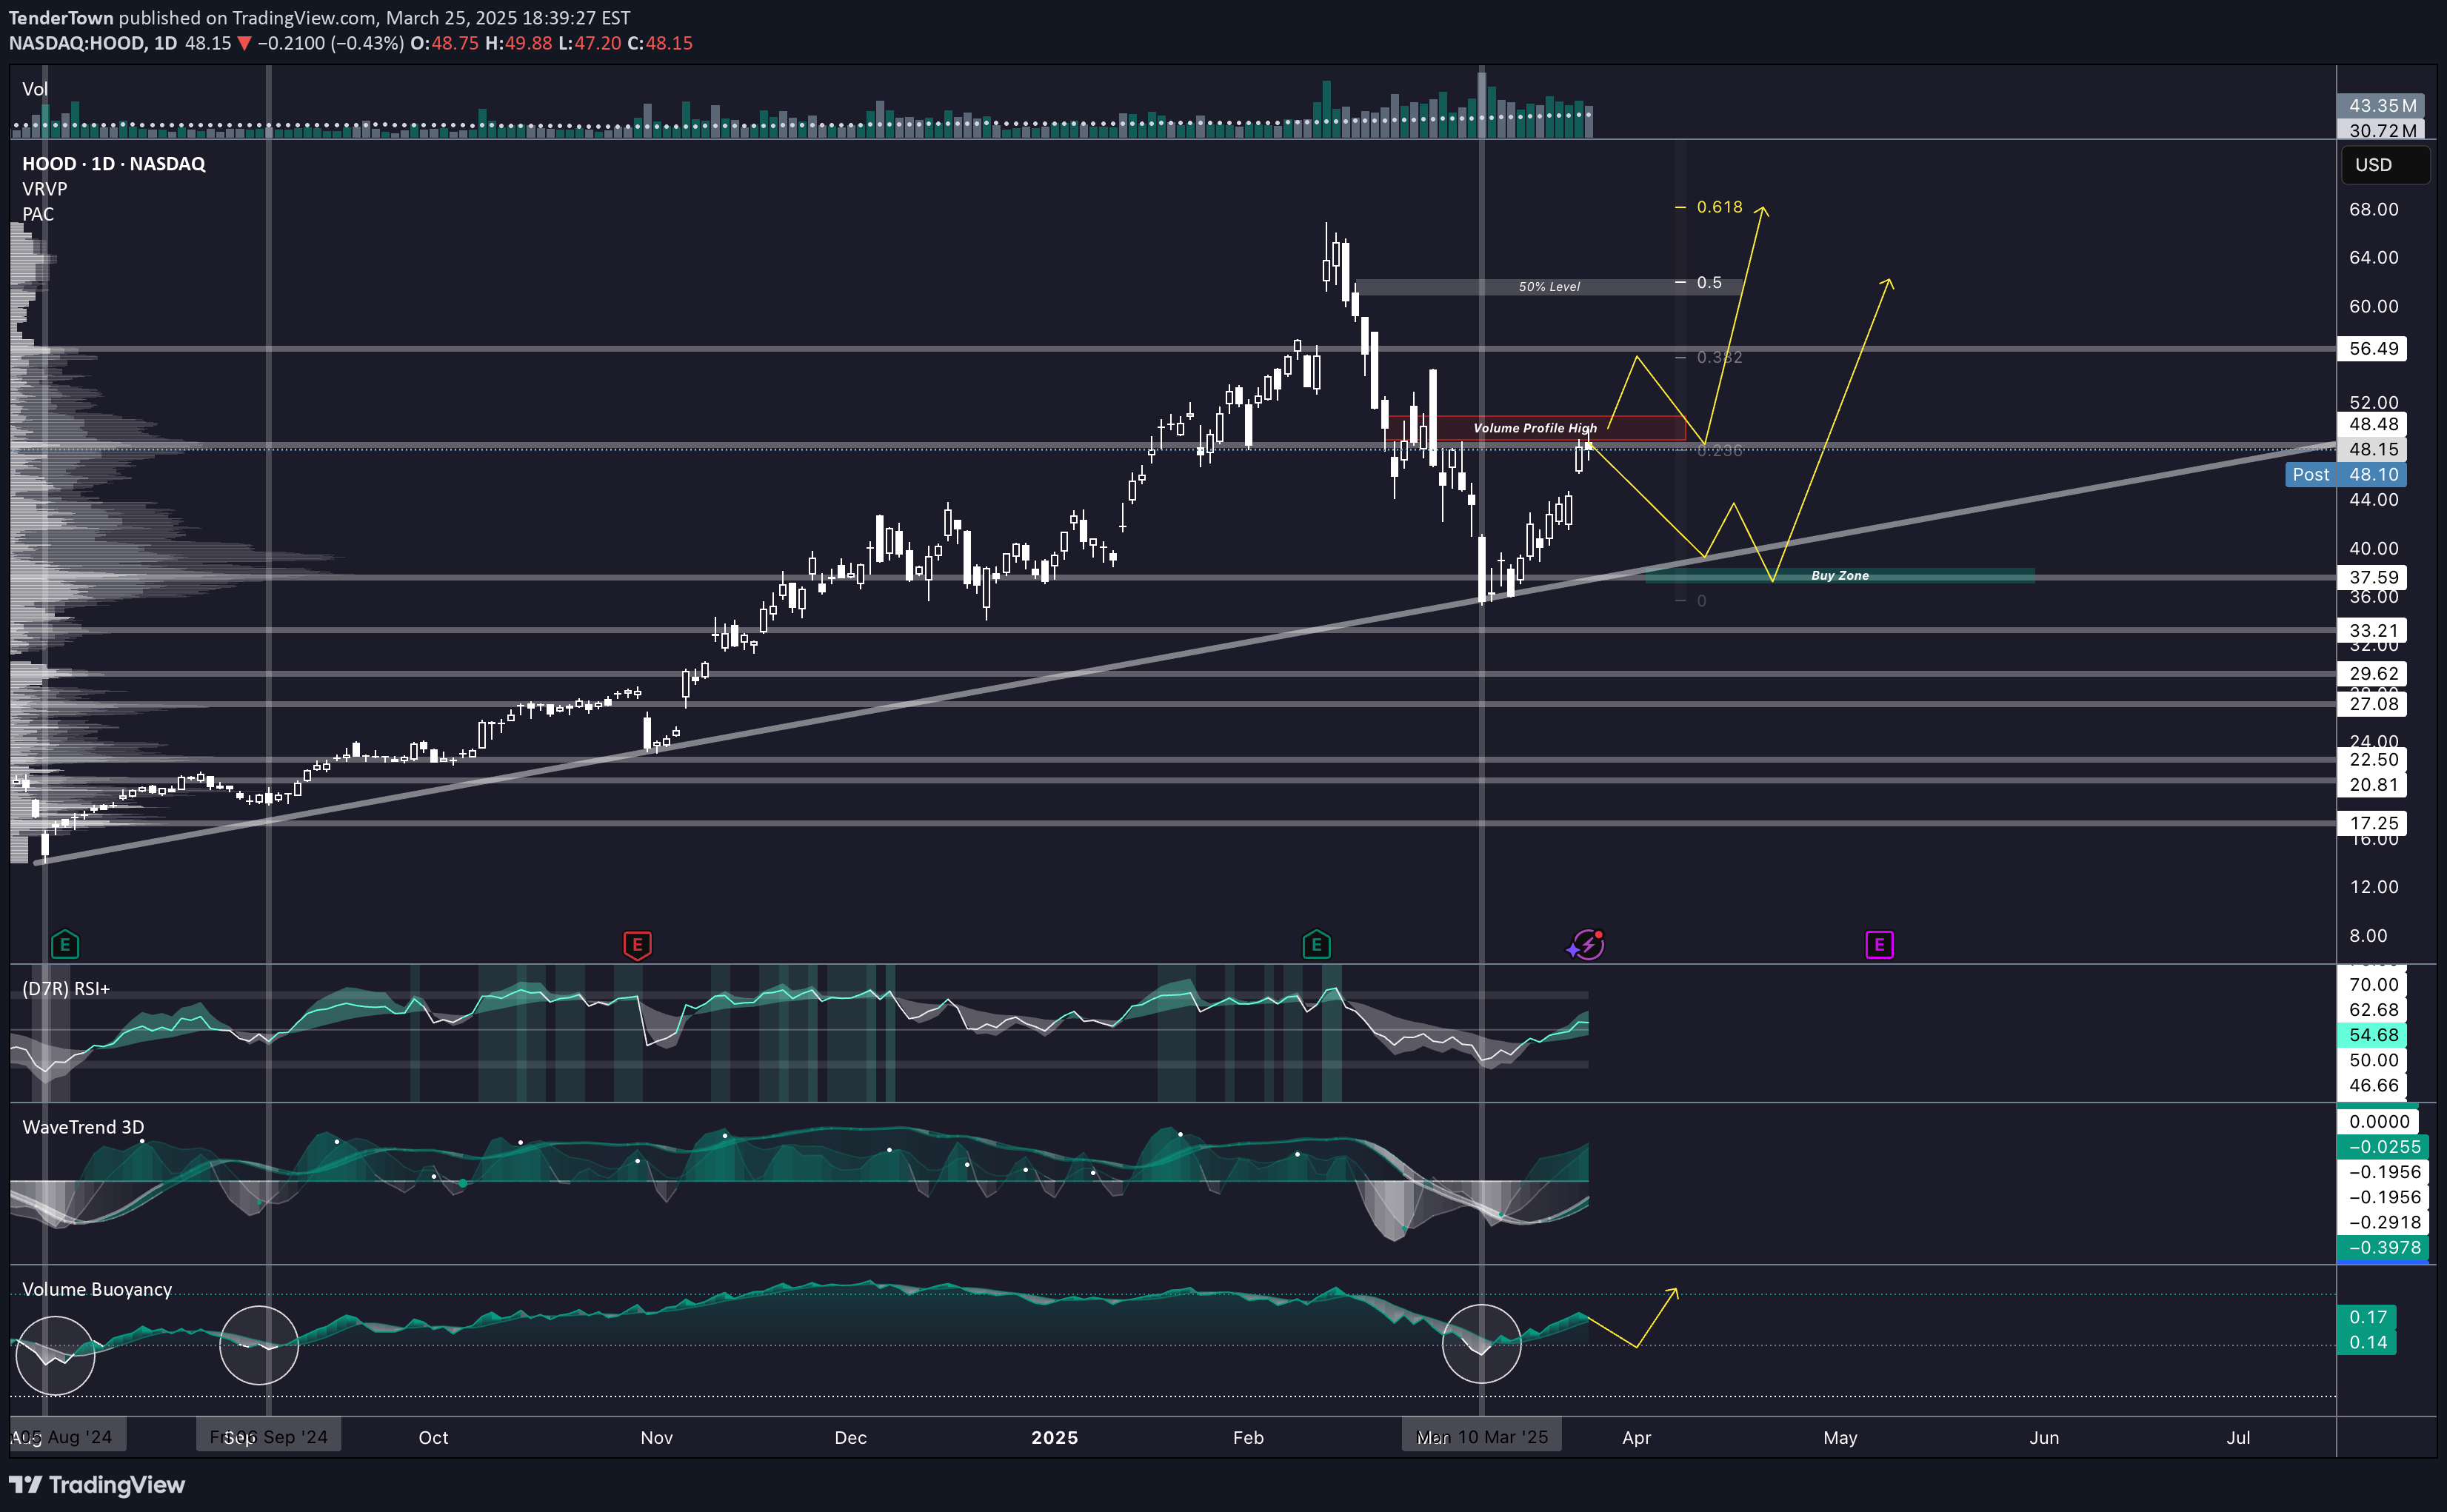
As of March 25, 2025, Robinhood (NASDAQ: HOOD) is approaching a high-volume resistance level near $48.15–$48.48. Price has been rallying off a March low and is now testing key areas of confluence that could either trigger a breakout continuation or prompt a corrective move. Technical Overview Price Structure Current Resistance Zone: $48.15–$48.48, aligning with the Volume Profile High. Support Structure: Ascending trendline stretching from August 2024 lows; recent price behavior has respected this line cleanly. Fibonacci Levels 0.5 retracement at $56.49 0.618 extension above $60 These are potential upside targets if current resistance is cleared on volume. Momentum and Trend Indicators RSI The RSI indicator has turned upward and exited its prior downtrend channel. The last three times this indicator rebounded from its lower band (circled on chart), price followed with a sustained bullish leg. Currently printing near 54.68, suggesting renewed momentum without being overbought. Trend Recently flipped bullish: the green histogram has turned positive, and the wave has crossed above its signal line. Previous flips from similar structure (highlighted by white dots and wave crossovers) have marked strong trend beginnings. The clean separation between the wave and signal line is a confirmation of strength. Volume The most important tell: the recent reversal mirrors August and September 2024 setups nearly identically. The March 10, 2025, bottom was accompanied by a smooth upward curve and bullish divergence. The projected yellow path (shown on the chart) suggests volume support is building under price, signaling sustainable upside. Scenario-Based Outlook Scenario 1: Bullish Breakout Price breaks above $48.48 with volume. Indicators confirm momentum across all three custom tools. Target: $56.49 (0.5 Fib), then $60.00–$62.00 (0.618 Fib + psychological level). Scenario 2: Rejection & Pullback Price stalls at Volume Profile High. Pullback into trendline or full retracement toward Buy Zone ($37–$36). Watch for renewed confluence from RSI+, WaveTrend 3D, and Volume Buoyancy for long re-entry. Summary Robinhood is at a critical juncture. Momentum across the RSI+, WaveTrend 3D, and Volume Buoyancy is aligned to support continuation—but the price must clear the Volume Profile High to confirm. If rejected, the trendline and deeper demand zone provide defined levels to reassess. Indicators suggest the recent bottom was a structural low with strength building beneath the surface. This setup offers a favorable risk-reward profile in both breakout and pullback scenarios, provided the indicators continue to support momentum and volume follows through.
Disclaimer
Any content and materials included in Sahmeto's website and official communication channels are a compilation of personal opinions and analyses and are not binding. They do not constitute any recommendation for buying, selling, entering or exiting the stock market and cryptocurrency market. Also, all news and analyses included in the website and channels are merely republished information from official and unofficial domestic and foreign sources, and it is obvious that users of the said content are responsible for following up and ensuring the authenticity and accuracy of the materials. Therefore, while disclaiming responsibility, it is declared that the responsibility for any decision-making, action, and potential profit and loss in the capital market and cryptocurrency market lies with the trader.