Technical analysis by TenderTown about Symbol VET: Buy recommendation (11/24/2025)

TenderTown
تحلیل تکنیکال وِت (VET): راز انفجار قیمت در کف حمایتی!
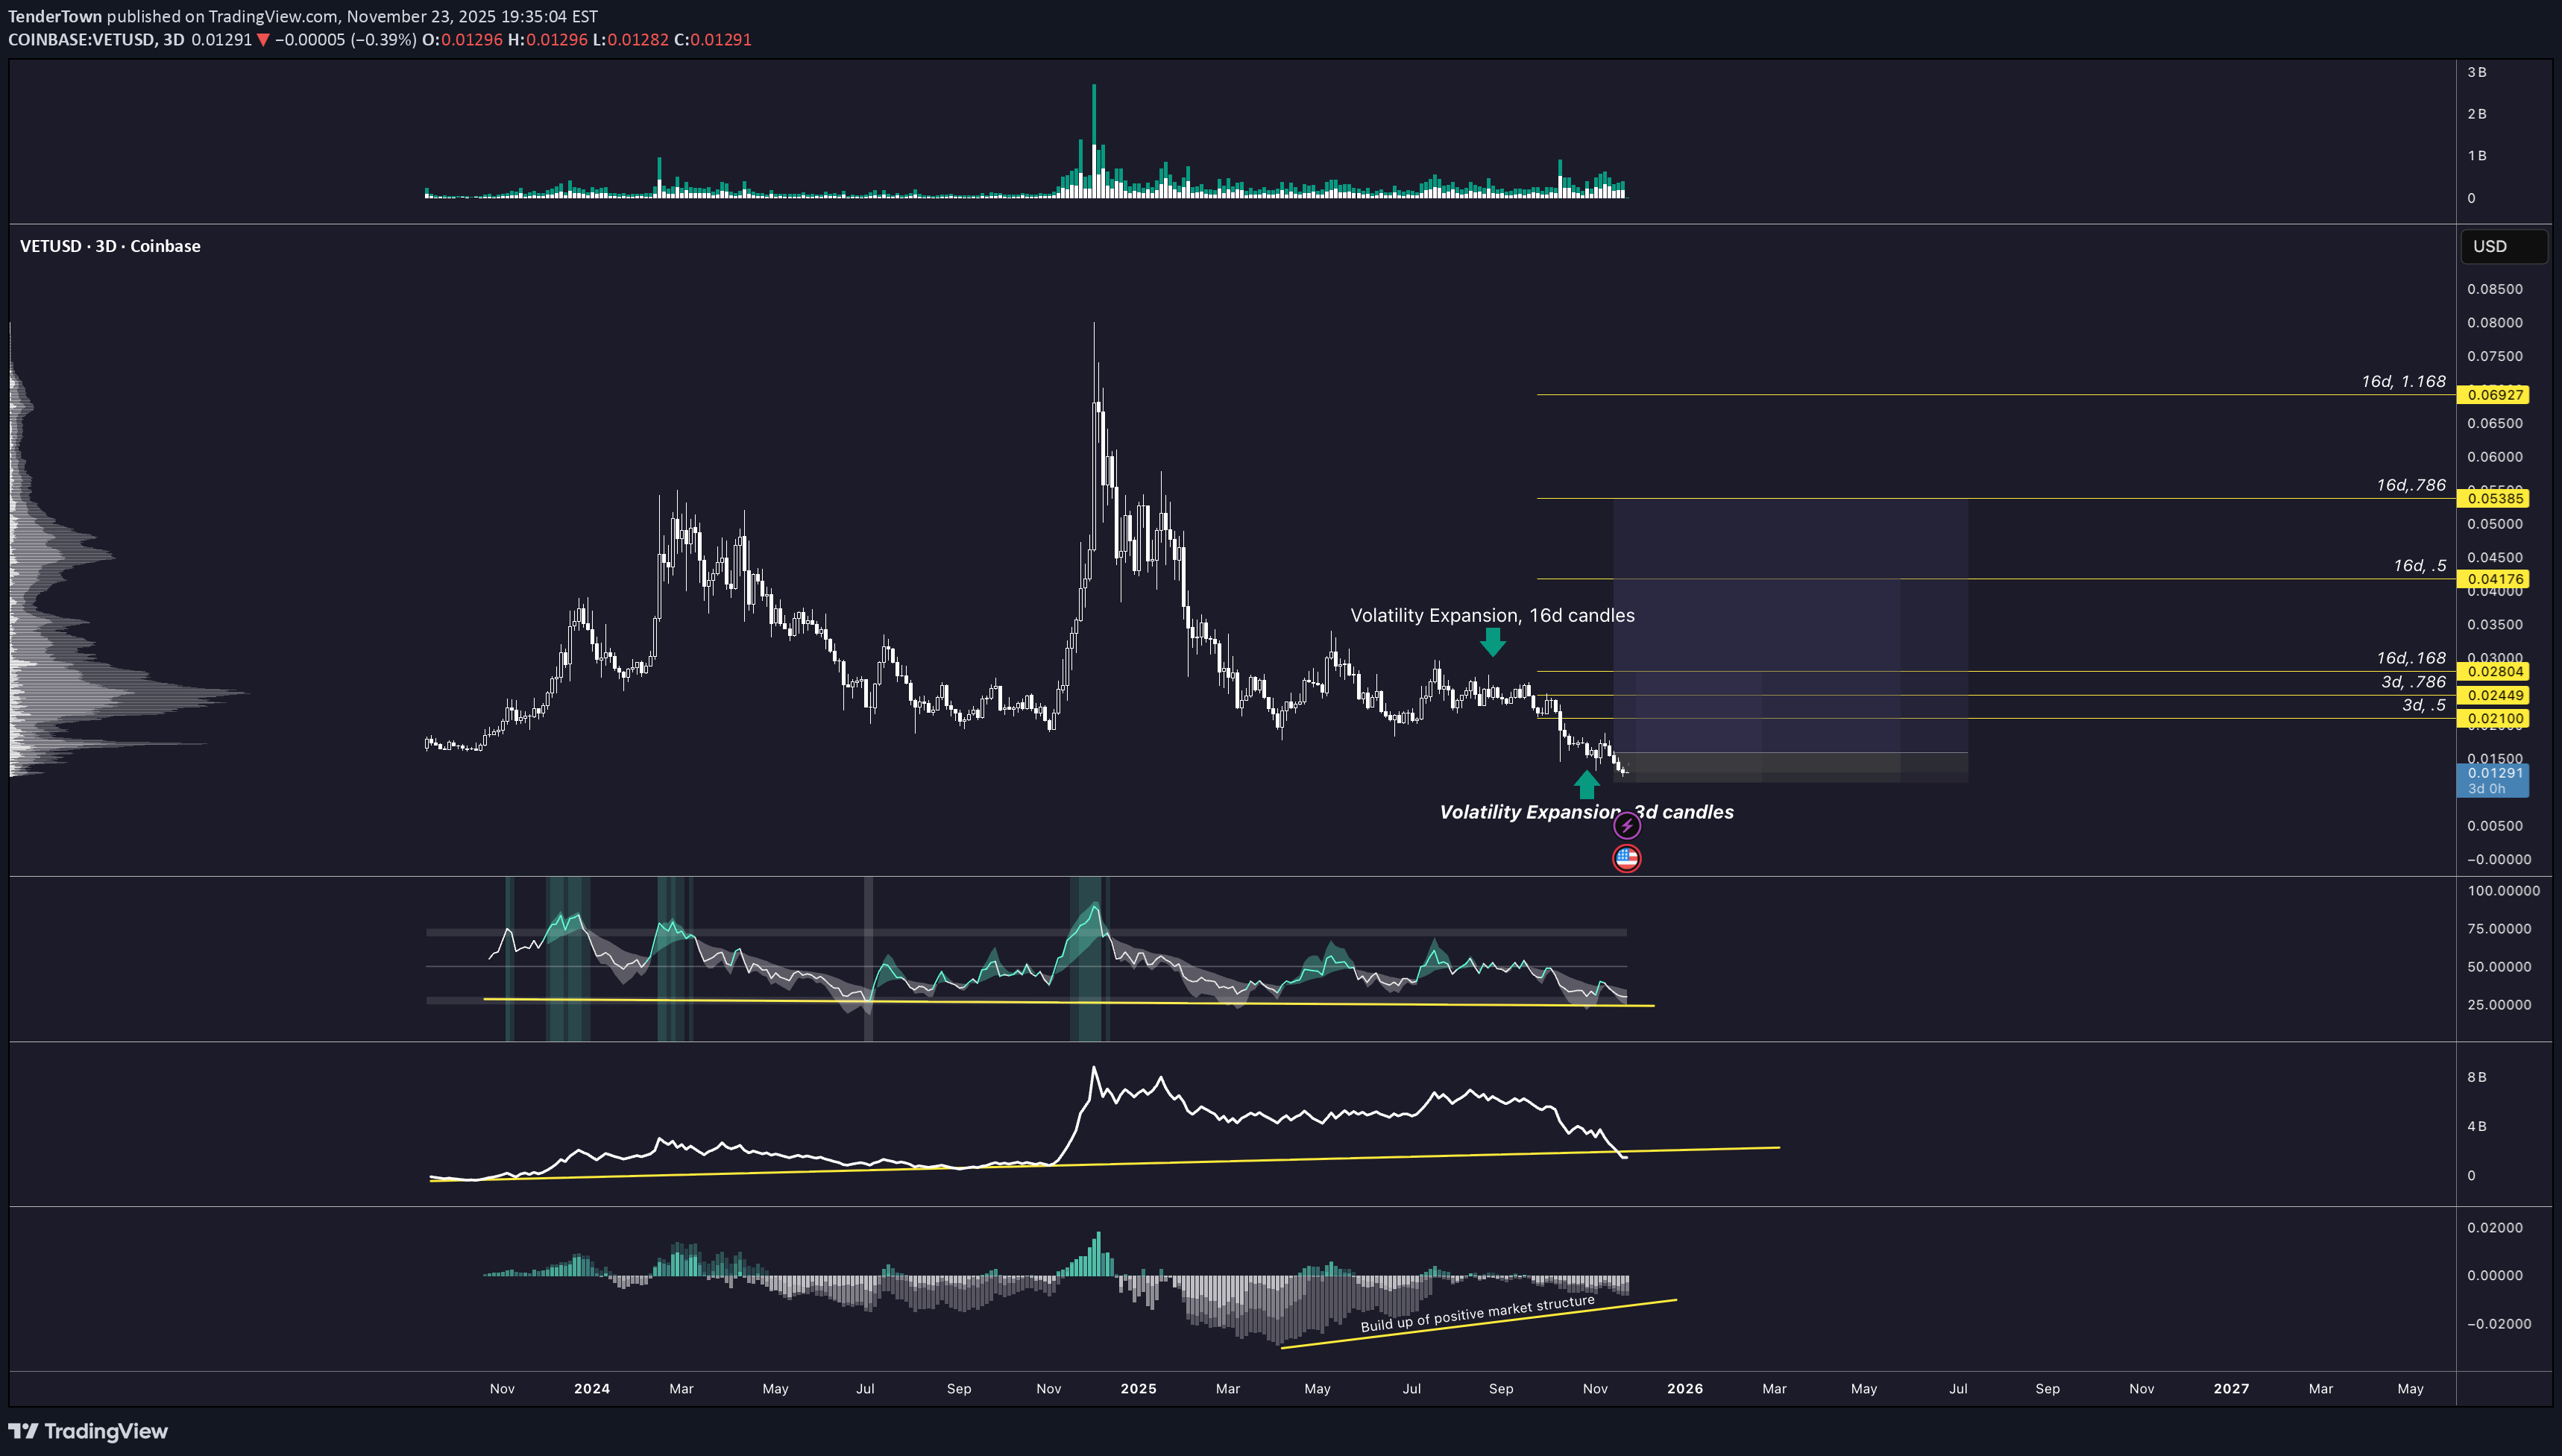
This chart highlights how VET behaves when volatility expansion occurs at major swing levels. There are two clear reference points marked. The first is the expansion that lasted sixteen candles. That move defined the prior expansion cycle and shows how price behaves when it breaks out of a compressed range with rising volatility. It also provides a baseline for cycle duration and expected reach. The second is the current three day expansion signal on the right side of the chart. Price is pressing into a multi-month support floor while the market has been contracting for an extended period. This is the same condition that preceded the last major expansion. The repeated small-range candles, declining volatility, and low momentum readings all confirm compression. The expansion targets are mapped using both the three day and sixteen day fib projections. The initial levels sit at zero point zero two four four nine and zero point zero two eight two zero four. The extended cycle levels sit at zero point zero four one seven six, zero point zero five three eight five, and zero point zero six nine two seven. These reflect the historical reach of prior volatility expansion cycles and outline the potential move if the current base holds. The shaded zones represent the probable path of expansion if volatility normalizes. The key point is that price is forming another expansion trigger at the bottom of the range while the broader structure remains unchanged. When these conditions align, the market has repeatedly responded with strong multi-week expansion cycles.