
HodlAhmad
@t_HodlAhmad

What symbols does the trader recommend buying?
Purchase History
پیام های تریدر
Filter
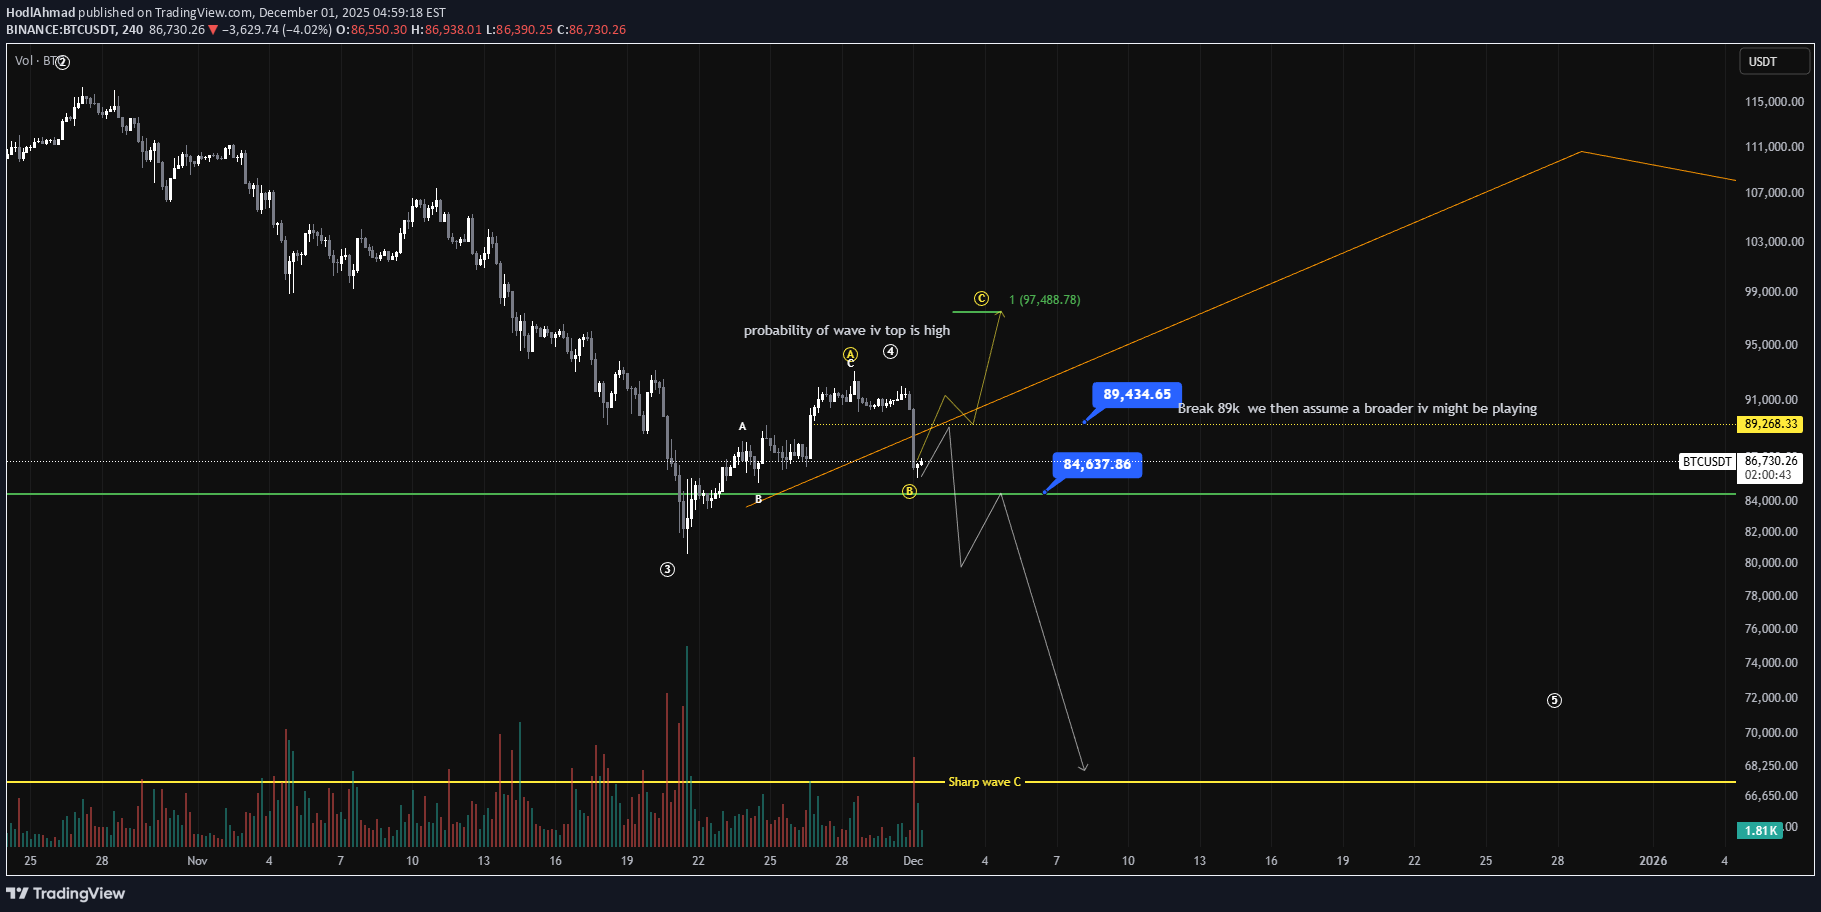
HodlAhmad
تحلیل فوری بیت کوین: آیا موج چهارم کامل شد؟ مرزهای 84 هزار و 89 هزار کلیدی هستند!
HodlAhmad
پیشبینی کوتاه مدت اتریوم: آیا منتظر جهش به ۲۷۰۰ دلار هستیم؟
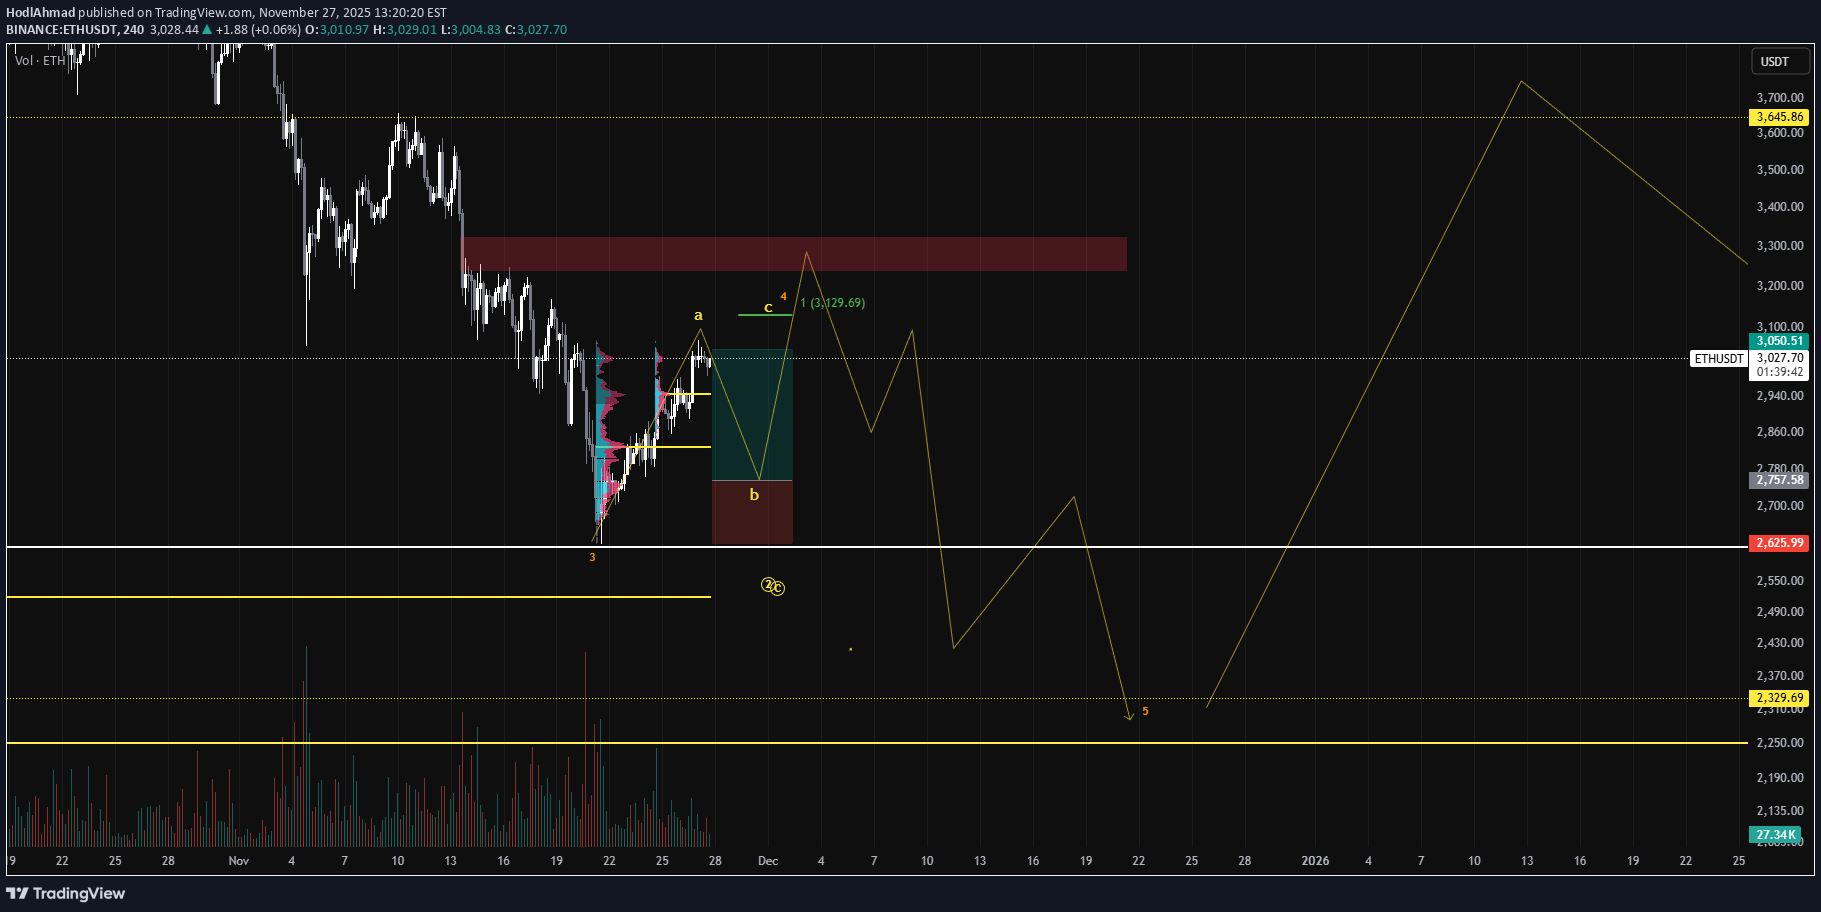
eth might be forming wave 4 here expecting a short term bounce around 2700$ level tp and sl are mentioned in the chartclosing this9% profit booked
HodlAhmad
احتمال جهش اتریوم به محدوده ۷ تا ۸ هزار دلار: استراتژی خرید و نگهداری (ETH Spot)
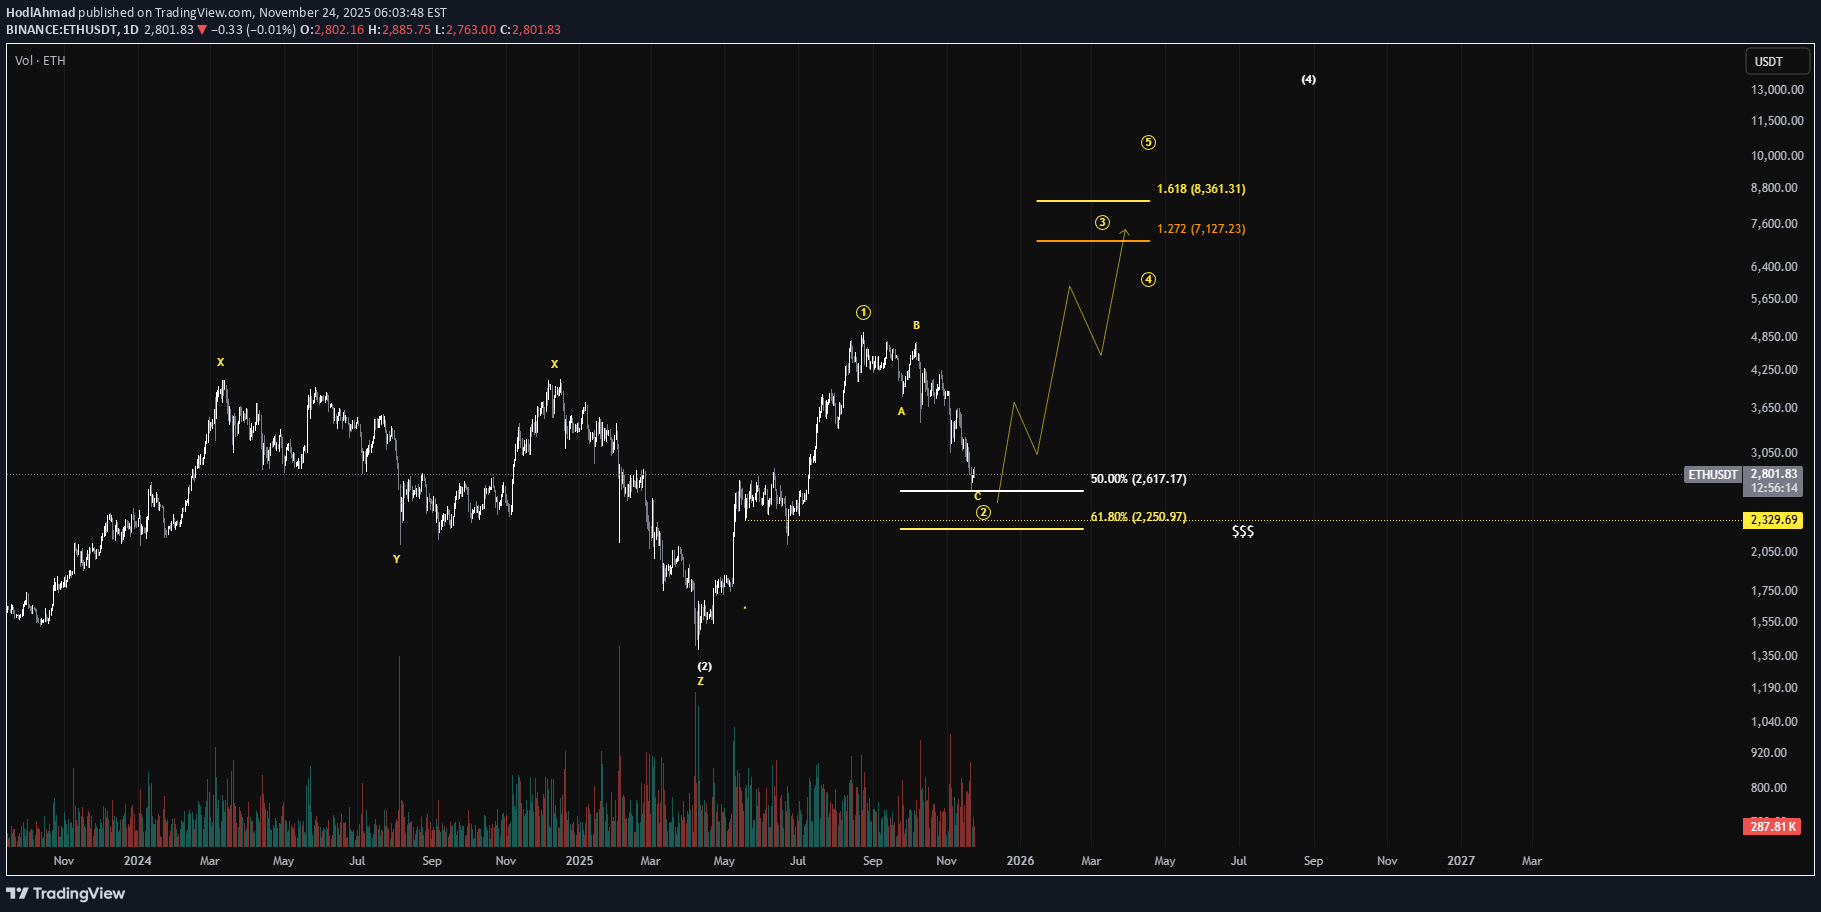
ETH is approaching a strong corrective zone around the 50–61.8% retracement. If this marks the completion of Wave 2, the structure supports a potential impulse toward 7k–8k. You might want to be positioned if this level holds
HodlAhmad
آیا این آخرین فرصت برای جهش 30 برابری ارز INJ است؟ (تحلیل پله نهایی)

“INJ macro view: Final corrective leg nearing completion. If we tap the green box, next macro leg targets $60+. 30x potential from the lows. Don’t hate me for this… it is what it is 🚀📈”
HodlAhmad
برنامه بیت کوین: ساختار اصلاحی بزرگ و مثلثهای طاقتفرسا!
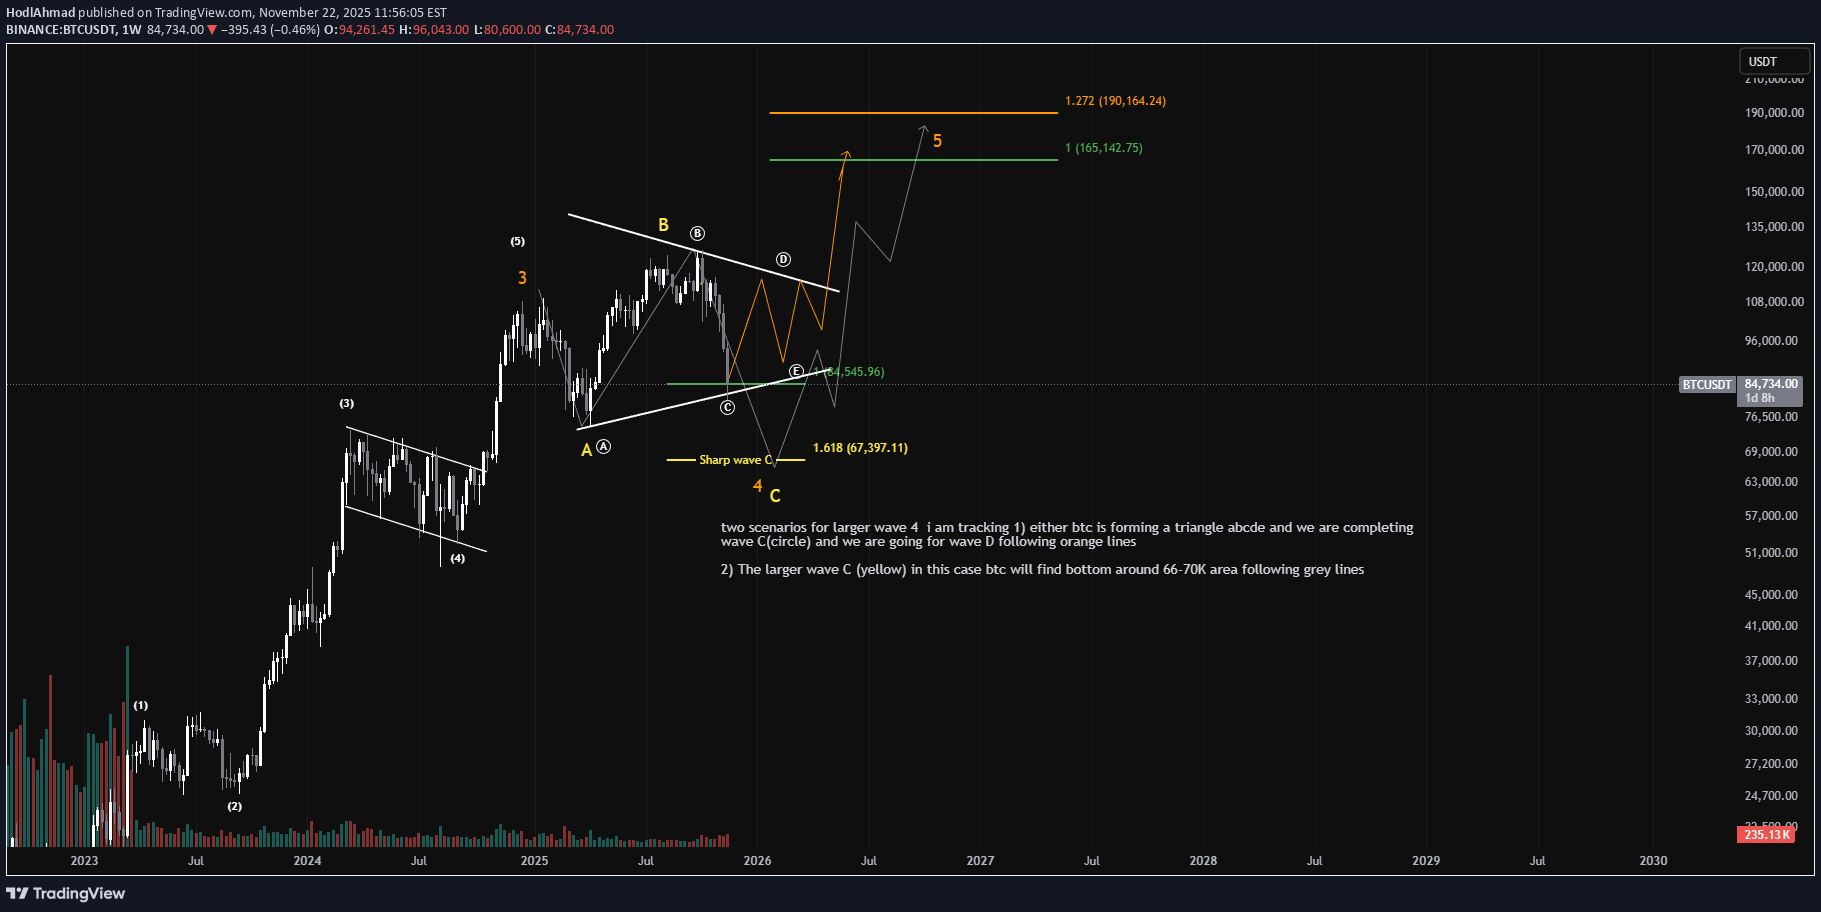
Bitcoin – Higher Timeframe Structure Update Back in August, I highlighted that BTC’s move to the upside wasn’t impulsive but corrective. That played out exactly as expected: Bitcoin completed Wave B (yellow) near 126K and then sold off sharply into Wave C. Zooming out, BTC is still in a larger Wave 4. Historically, Wave 4s tend to form triangle structures (A-B-C-D-E) rather than simple ABC corrections. These patterns are usually long, sideways, and extremely frustrating for traders. At this stage, I’m tracking two possible scenarios, but based on current price action, there’s roughly an 80% probability that BTC is developing a Wave 4 triangle. Key takeaway: The market is still corrective on the macro level, and patience is required while the triangle completes.
HodlAhmad
تحلیل موج الیوت ONDO: آیا وقت خرید برای جهش به ۳ دلار رسیده است؟
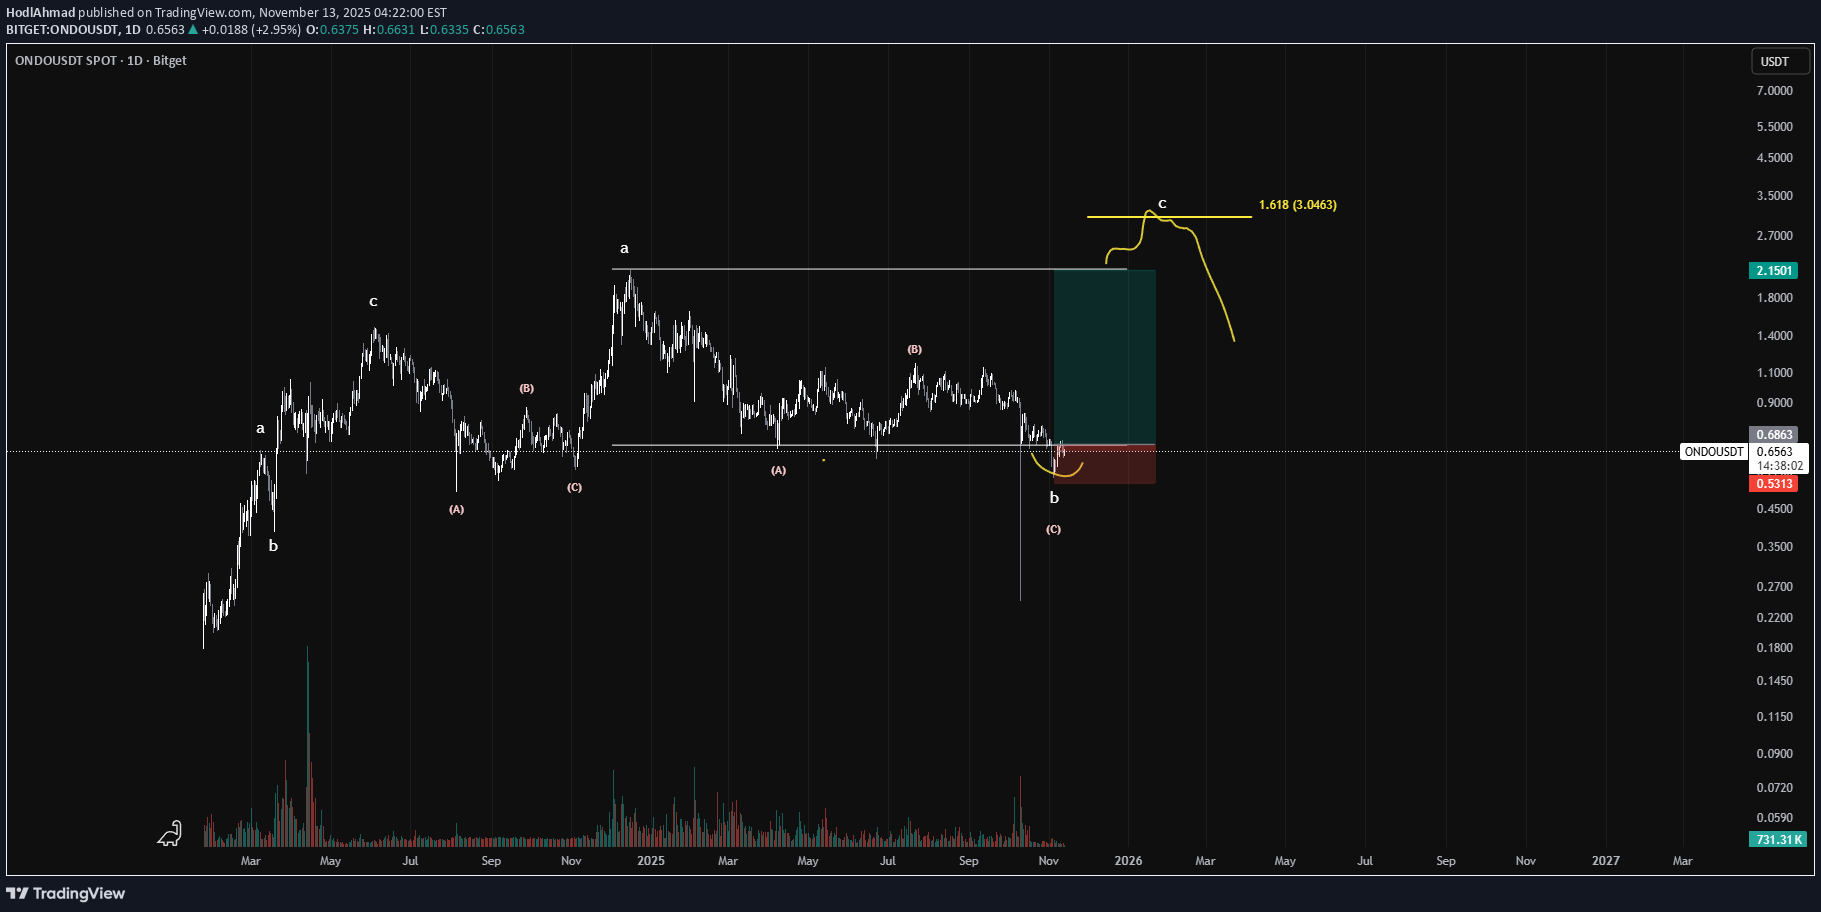
ONDOUSDT – Elliott Wave Setup (1D Timeframe) ONDO is completing a corrective structure and showing signs of reversal from the b-wave (C) low, hinting at a potential start of a new impulsive move upward. 📈 Analysis Summary: Structure: Complex corrective wave (A)-(B)-(C) forming a bottom near $0.63–$0.65 Wait for range reclaim before entry confirmation Bullish target: 1.618 Fib extension = $3.0463 Stop-loss: Below recent swing low (~$0.53) Risk-to-reward: Highly favorable upon breakout confirmation ⚠️ Note: Wait for price to reclaim and close above the range before confirming the long setup — otherwise, the structure could still be part of an extended correction.
HodlAhmad
نقشه راه لایتکوین و ارزهای مشابه: استراتژی معاملاتی الگوهای مثلثی در تایم فریمهای بالا

similar to many altcoins ex like LTC who are in the last stages of their triangle completion I just love trading these patterns on HTF supports and tps are mention in the chart
HodlAhmad
کشف بزرگ لایت کوین: رمزگشایی مثلث ۷ ساله و انتظار انفجار قیمتی!

LTC has been consolidating inside a massive 7-year symmetrical triangle, forming a clean A–B–C–D–E corrective structure. With wave E nearly complete, the pattern is 99% mature — a decisive breakout could be imminent. This range has trapped traders for years, but structures like this don’t appear every day. Once this triangle resolves, volatility will return and LTC could finally make a macro move after years of compression. Invalidation below $40.6.going big on this one
HodlAhmad
link Bullish Idea
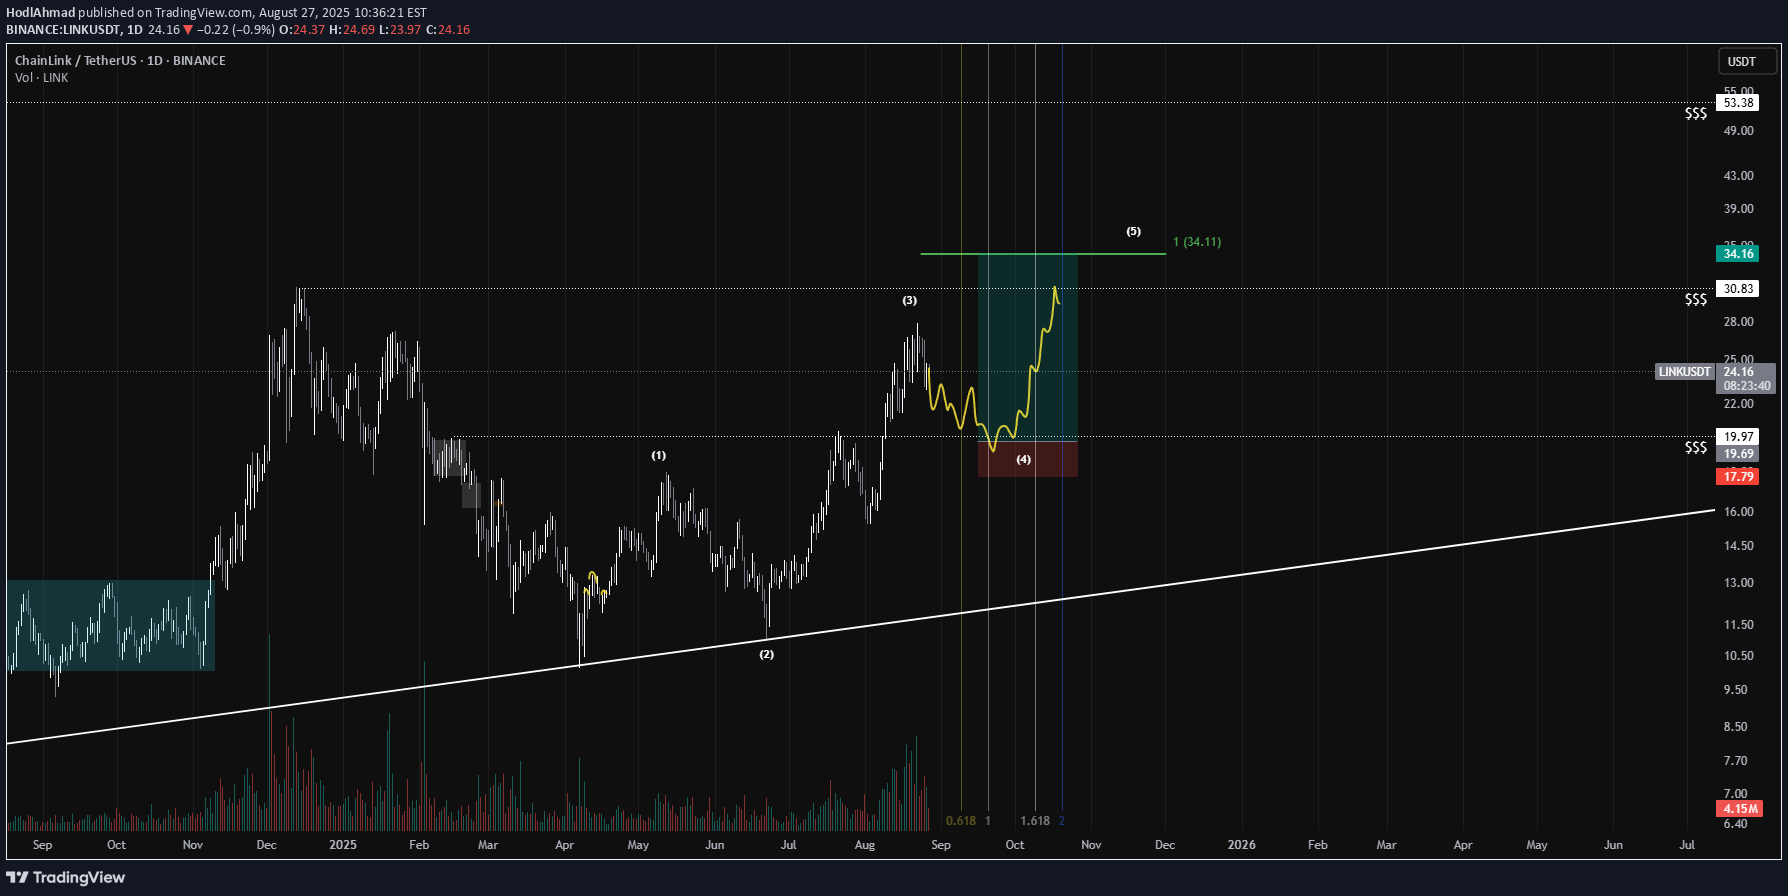
High probability trade setup for link price rallied strongly from wave 2 now i'm looking for wave 4 pullback entry Sl and tp are mentioned in chart Note: this is not a financial advice in sort
HodlAhmad
btc idea
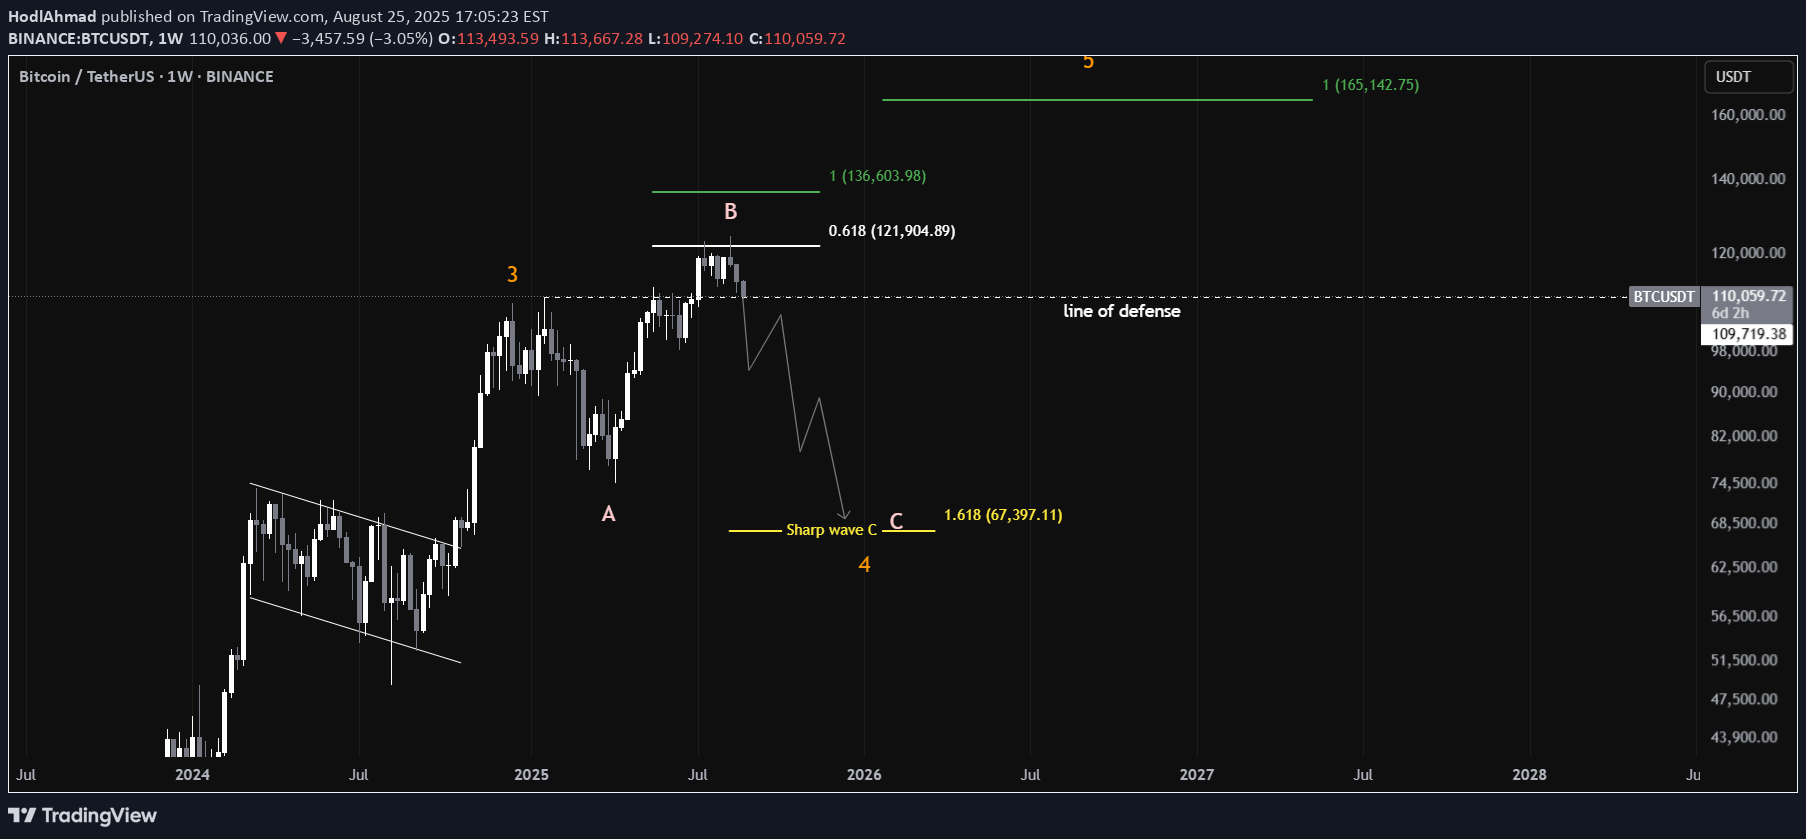
We had a great run since Nov 2022 when wave 2 bottomed. Wave 3 delivered a massive rally, peaking near 109k. Since then, I’ve been tracking wave 4: Wave A bottomed ~75k Wave B rallied us to the 124k rejection right at the 0.618 fib This rally wasn’t impulsive but corrective (classic Wave B overshoot). ⚠️ If BTC loses 110k on 1D, the probability for a sharp Wave C massively increases → target 66-68k. From there, Wave 5 could unfold with a brand new rally. 🚀95% chances we have topped in Wave Bmade this post in april look perfectly rejected from 0.618 fib my target remains the same for 67k C wavewell called this move in august if u followed me u would be safe
Disclaimer
Any content and materials included in Sahmeto's website and official communication channels are a compilation of personal opinions and analyses and are not binding. They do not constitute any recommendation for buying, selling, entering or exiting the stock market and cryptocurrency market. Also, all news and analyses included in the website and channels are merely republished information from official and unofficial domestic and foreign sources, and it is obvious that users of the said content are responsible for following up and ensuring the authenticity and accuracy of the materials. Therefore, while disclaiming responsibility, it is declared that the responsibility for any decision-making, action, and potential profit and loss in the capital market and cryptocurrency market lies with the trader.